Home > Analyses > Utilities > CenterPoint Energy, Inc.
CenterPoint Energy powers millions of homes and businesses, quietly fueling daily life with essential electric and natural gas services. As a stalwart in the U.S. utility sector, it operates extensive transmission networks and delivers reliable energy across multiple states. Known for steady infrastructure investment and regulated market presence, CenterPoint blends stability with innovation. The key question now: does its solid foundation support compelling growth and valuation in today’s evolving energy landscape?

Table of contents
Business Model & Company Overview
CenterPoint Energy, Inc., founded in 1866 and headquartered in Houston, Texas, stands as a dominant public utility holding company in the United States. It operates a cohesive ecosystem spanning electric transmission, distribution, and generation, coupled with extensive natural gas services. This integration serves 2.7M metered customers through a vast infrastructure, including 239 substations and 1M miles of natural gas mains, reinforcing its pivotal role in the general utilities sector.
The company’s revenue engine balances regulated electric and natural gas distribution with ancillary services like home appliance maintenance and protection plans. CenterPoint leverages its strategic footprint across key U.S. markets, notably in Minnesota, Arkansas, and Texas, to capture diverse demand streams. Its scale and regulated assets create a formidable economic moat, positioning the company as a vital energy infrastructure steward shaping the sector’s future.
Financial Performance & Fundamental Metrics
I analyze CenterPoint Energy’s income statement, key financial ratios, and dividend payout policy to assess its operational efficiency and shareholder value creation.
Income Statement
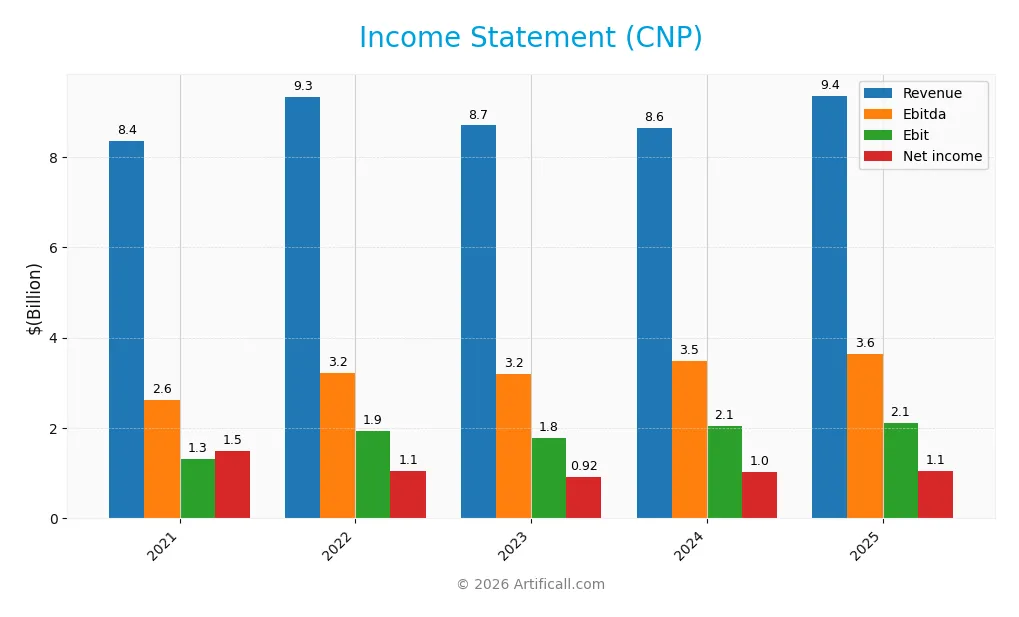
The table below summarizes CenterPoint Energy, Inc.’s key income statement figures for fiscal years 2021 through 2025, highlighting revenue, expenses, and profitability metrics.
| 2021 | 2022 | 2023 | 2024 | 2025 | |
|---|---|---|---|---|---|
| Revenue | 8.35B | 9.32B | 8.70B | 8.64B | 9.36B |
| Cost of Revenue | 5.15B | 5.92B | 5.01B | 4.67B | 6.67B |
| Operating Expenses | 1.84B | 1.83B | 1.93B | 1.99B | 576M |
| Gross Profit | 3.21B | 3.40B | 3.69B | 3.98B | 2.69B |
| EBITDA | 2.62B | 3.23B | 3.19B | 3.49B | 3.64B |
| EBIT | 1.31B | 1.94B | 1.79B | 2.05B | 2.11B |
| Interest Expense | 529M | 524M | 701M | 838M | 903M |
| Net Income | 1.49B | 1.06B | 917M | 1.02B | 1.05B |
| EPS | 2.35 | 1.60 | 1.37 | 1.58 | 1.61 |
| Filing Date | 2022-02-22 | 2023-02-17 | 2024-02-20 | 2025-02-20 | 2026-02-19 |
Income Statement Evolution
CenterPoint Energy’s revenue grew 12% from 2021 to 2025, with an 8.3% increase in the last year alone. However, net income declined nearly 30% over the period, reflecting margin compression. Gross margin fell significantly in 2025, while EBIT margin remained stable and net margin shrank, signaling rising costs and pressure on profitability despite growing sales.
Is the Income Statement Favorable?
In 2025, fundamentals show mixed signals. Revenue growth at 8.3% outpaced cost increases, supporting a stable EBIT margin near 22.5%. Yet, gross profit declined sharply, and net margin dropped over 4%, reflecting higher expenses and interest costs consuming earnings. Overall, the income statement is favorable but highlights margin risks and earnings volatility investors must monitor closely.
Financial Ratios
The following table summarizes key financial ratios for CenterPoint Energy, Inc. from 2021 to 2025, providing a clear view of its profitability, liquidity, leverage, and efficiency metrics:
| Ratios | 2021 | 2022 | 2023 | 2024 | 2025 |
|---|---|---|---|---|---|
| Net Margin | 17.79% | 11.34% | 10.55% | 11.79% | 11.24% |
| ROE | 15.78% | 10.52% | 9.49% | 9.55% | 9.43% |
| ROIC | 3.45% | 3.29% | 4.02% | 4.15% | 4.01% |
| P/E | 11.14 | 17.86 | 19.66 | 20.03 | 23.80 |
| P/B | 1.76 | 1.88 | 1.86 | 1.91 | 2.24 |
| Current Ratio | 1.72 | 0.92 | 0.78 | 1.08 | 0.91 |
| Quick Ratio | 1.57 | 0.75 | 0.58 | 0.91 | 0.91 |
| D/E | 1.71 | 1.68 | 1.93 | 1.97 | 0.22 |
| Debt-to-Assets | 42.74% | 43.73% | 46.88% | 47.90% | 5.00% |
| Interest Coverage | 2.58 | 2.99 | 2.51 | 2.37 | 2.34 |
| Asset Turnover | 0.22 | 0.24 | 0.22 | 0.20 | 0.19 |
| Fixed Asset Turnover | 0.36 | 0.34 | 0.29 | 0.27 | 0.00 |
| Dividend Yield | 2.97% | 2.59% | 2.97% | 2.56% | 2.29% |
Evolution of Financial Ratios
Return on Equity (ROE) slightly declined from 15.8% in 2021 to 9.4% in 2025, indicating reduced profitability. The Current Ratio fell from a strong 1.72 in 2021 to 0.91 in 2025, signaling weaker liquidity. Debt-to-Equity Ratio improved significantly, dropping from 1.71 in 2021 to 0.22 in 2025, reflecting much lower leverage.
Are the Financial Ratios Favorable?
In 2025, profitability shows mixed signals: net margin is favorable at 11.2%, but ROE and ROIC fall below the weighted average cost of capital (8.5%), which is neutral. Liquidity is weak with a current ratio below 1, though the quick ratio is neutral at 0.91. Leverage ratios are favorable, with low debt-to-assets (5%) and debt-to-equity (0.22). Market multiples like P/E (23.8) and P/B (2.24) are neutral. Overall, the ratios are slightly unfavorable.
Shareholder Return Policy
CenterPoint Energy maintains a dividend payout ratio around 50-58%, with a 2025 dividend per share of $0.88 and a yield near 2.3%. The dividend is supported by net income but not fully covered by free cash flow, indicating reliance on other sources or capital management.
The company also runs share buybacks, complementing dividends to return capital. However, negative free cash flow and coverage ratios below one highlight risks in sustaining distributions without stronger cash flow. This policy balances shareholder returns with cautious long-term value creation.
Score analysis
The radar chart below presents key financial metric scores for CenterPoint Energy, Inc., illustrating its current valuation and financial performance:
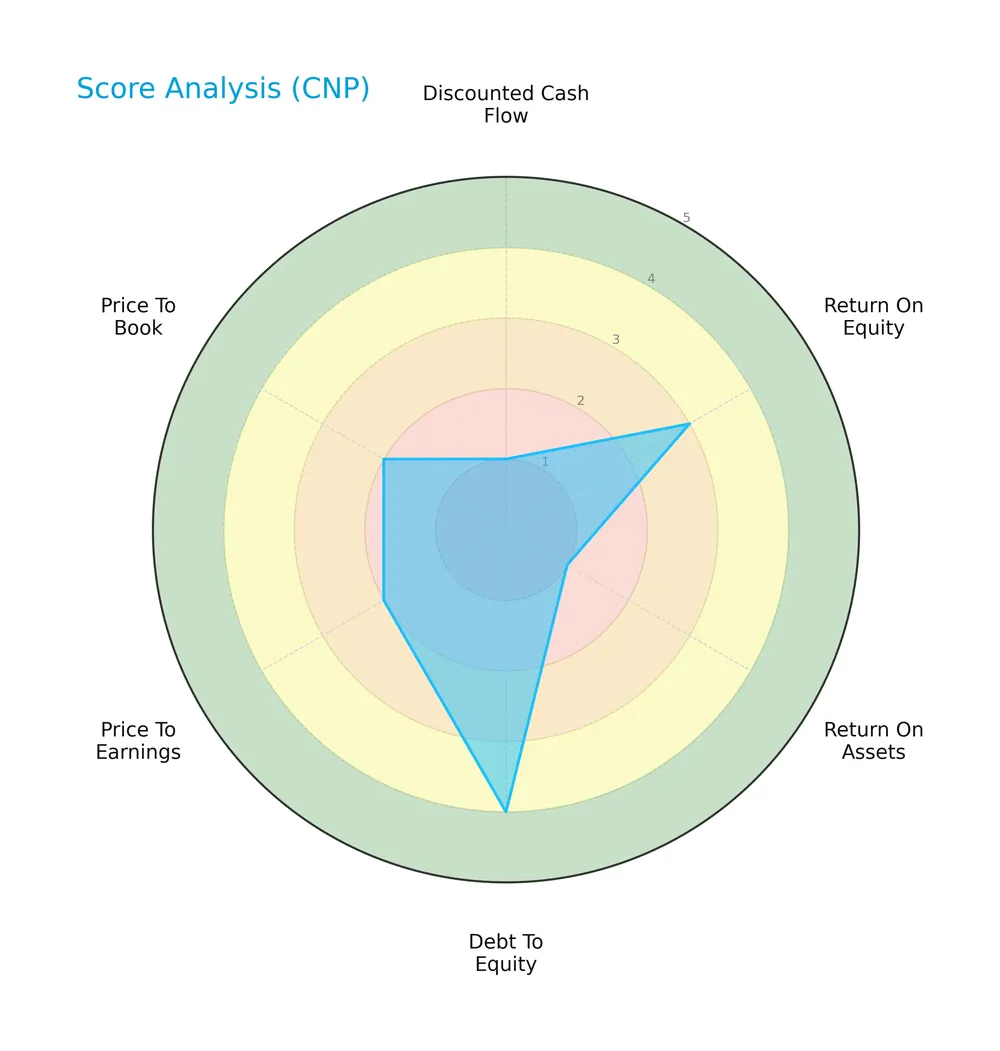
CenterPoint Energy scores very unfavorably on discounted cash flow (1) and return on assets (1), indicating weak profitability and cash flow generation. Return on equity is moderate (3), while debt-to-equity is favorable (4), reflecting manageable leverage. Valuation multiples P/E (2) and P/B (2) are unfavorable, suggesting the stock may be undervalued or underperforming.
Analysis of the company’s bankruptcy risk
CenterPoint Energy’s Altman Z-Score places it firmly in the distress zone, signaling a high likelihood of financial distress and potential bankruptcy risk:

Is the company in good financial health?
The Piotroski Score diagram highlights CenterPoint Energy’s financial strength at an average level:

With a score of 4, the company displays moderate financial health but lacks the robustness typically associated with strong or very strong firms, suggesting room for improvement in profitability and efficiency metrics.
Competitive Landscape & Sector Positioning
This sector analysis examines CenterPoint Energy, Inc.’s strategic positioning, revenue segments, and key products. I will assess whether CenterPoint Energy holds a competitive advantage over its main competitors.
Strategic Positioning
CenterPoint Energy concentrates on two core segments: Electric Transmission & Distribution and Natural Gas. It operates primarily in the US with a stable geographic footprint and a balanced revenue mix—4.9B in electric and 4.5B in gas for 2025—reflecting a diversified utility portfolio.
Revenue by Segment
This pie chart illustrates CenterPoint Energy’s revenue distribution by segment for the fiscal year 2025, highlighting the contribution of Natural Gas and Electric Transmission & Distribution.
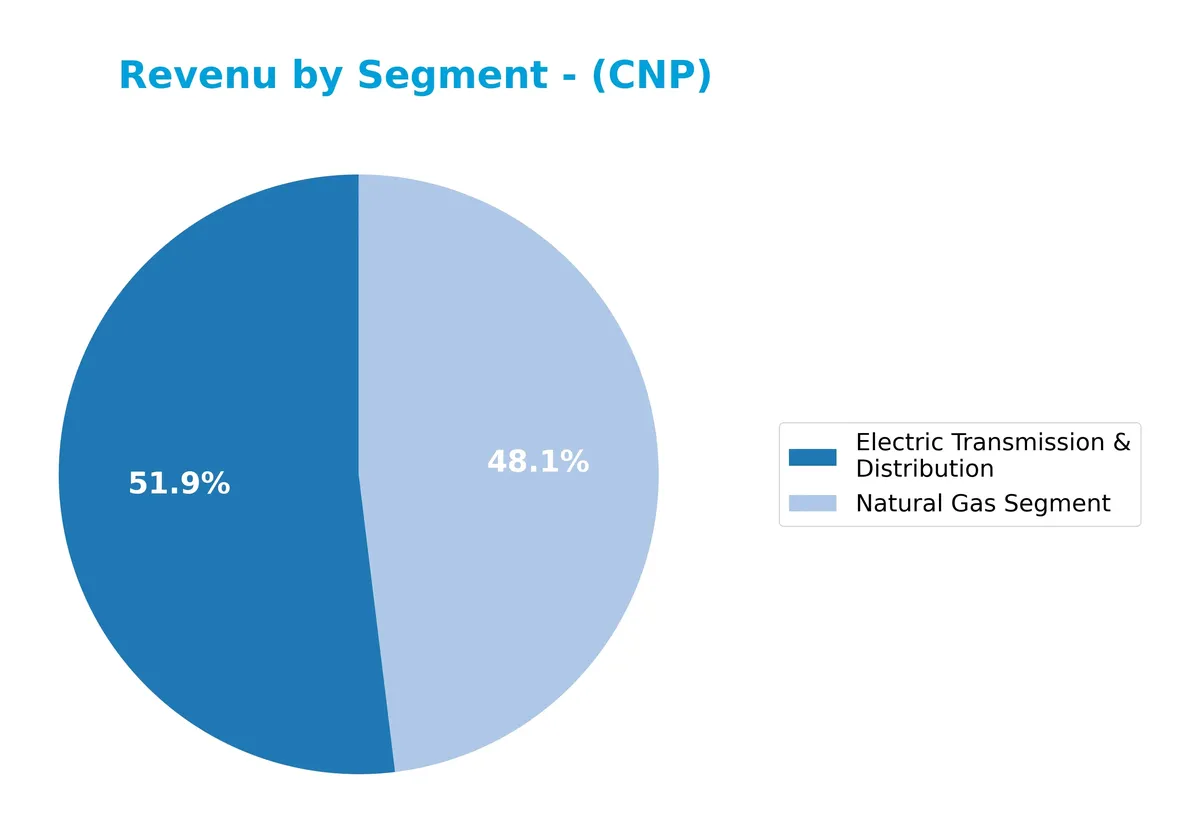
CenterPoint Energy’s Electric Transmission & Distribution segment leads revenue with $4.87B in 2025, growing steadily since 2011. The Natural Gas segment follows at $4.50B, showing a recent rebound after fluctuating. Growth in both segments reflects a balanced portfolio, though Electric Transmission increasingly drives the top line. The 2025 acceleration signals continued utility demand, but investors should watch for regulatory risks affecting capital returns.
Key Products & Brands
CenterPoint Energy’s business centers on two main segments with distinct utility services and customer reach:
| Product | Description |
|---|---|
| Electric Transmission & Distribution | Provides electric transmission and distribution services, owns generation assets, and participates in wholesale power markets. |
| Natural Gas Segment | Offers natural gas distribution, home appliance repair, home repair protection plans, and intrastate gas transportation and storage. |
CenterPoint Energy operates primarily through Electric Transmission & Distribution and Natural Gas segments. Both segments serve millions of customers with regulated utility services and value-added residential offerings across multiple states.
Main Competitors
CenterPoint Energy, Inc. competes within a field of 34 companies, with the table below listing the top 10 leaders by market capitalization:
| Competitor | Market Cap. |
|---|---|
| GE Vernova Inc. | 184B |
| NextEra Energy, Inc. | 169B |
| Constellation Energy Corporation | 114B |
| The Southern Company | 96B |
| Duke Energy Corporation | 91B |
| American Electric Power Company, Inc. | 62B |
| Sempra | 59B |
| Vistra Corp. | 56B |
| Dominion Energy, Inc. | 51B |
| Exelon Corporation | 44B |
CenterPoint Energy ranks 24th among 34 competitors, with a market cap equal to 15.23% of the sector leader, GE Vernova Inc. The company sits below both the average top 10 market cap (92.6B) and the sector median (29.6B). Its market capitalization trails the next higher competitor by approximately 9.42%, indicating a moderate gap to bridge within the industry hierarchy.
Comparisons with competitors
Check out how we compare the company to its competitors:
Aucun article trouvé pour ces critères.
Does CenterPoint Energy have a competitive advantage?
CenterPoint Energy shows a slightly unfavorable competitive advantage, as it currently destroys value with ROIC below WACC. However, its profitability is on a growing trend, indicating improving operational efficiency.
Looking ahead, the company’s extensive infrastructure and dual focus on electric and natural gas segments position it to capitalize on emerging energy markets and new service opportunities across multiple states.
SWOT Analysis
This analysis highlights CenterPoint Energy’s key strategic factors to guide informed investment decisions.
Strengths
- Stable electric and natural gas segments
- Large customer base of 2.7M
- Low debt-to-equity ratio of 0.22
Weaknesses
- ROIC below WACC, destroying value
- Low current ratio at 0.91 signals liquidity risk
- Declining net income and margin over period
Opportunities
- Growing ROIC trend suggests improving efficiency
- Expansion in gas home repair services
- Regulatory support for utilities modernization
Threats
- Regulatory and pricing pressures
- Fluctuating commodity prices
- Competition from renewable energy sources
CenterPoint Energy’s strengths in scale and stable core operations support resilience. However, value destruction and liquidity concerns require strategic focus. Growth hinges on operational improvements and seizing modernization opportunities amid sector headwinds.
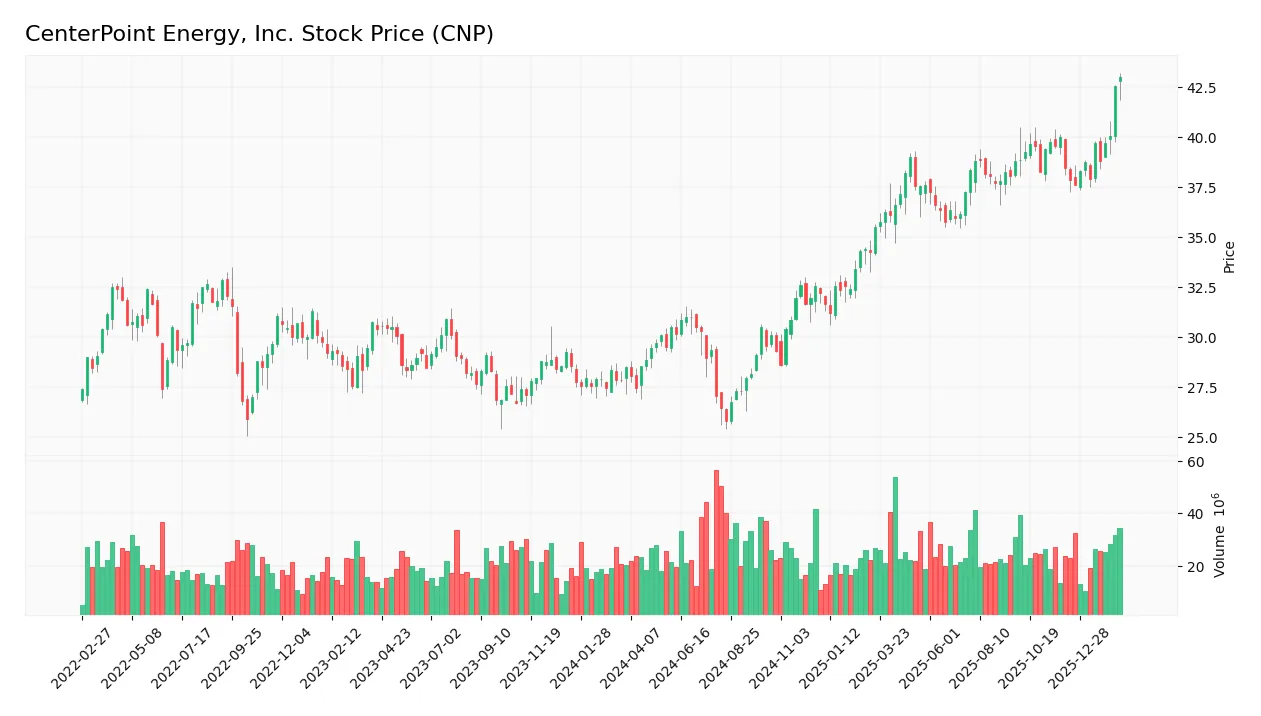
Stock Price Action Analysis
The weekly stock chart of CenterPoint Energy, Inc. (CNP) highlights a significant price increase and evolving momentum over the last 100 weeks:
Trend Analysis
Over the past 100 weeks, CNP’s stock price rose by 50.93%, signaling a bullish trend with clear acceleration. The price fluctuated between a low of 25.79 and a high of 43.0, exhibiting notable volatility with a 4.39 standard deviation. Recent momentum remains positive with an 11.89% gain since December 2025.
Volume Analysis
Trading volume totals nearly 3B shares, with buyers accounting for 56.1%, indicating buyer-driven activity. Volume shows an increasing trend, reflecting growing investor interest and participation. In the recent period, buyers remain slightly dominant at 57.8%, supporting sustained demand during the last three months.
Target Prices
Analysts set a clear target consensus for CenterPoint Energy, Inc., reflecting moderate upside potential.
| Target Low | Target High | Consensus |
|---|---|---|
| 37 | 47 | 41.5 |
The target range indicates expectations of a 10% to 20% price increase from current levels, signaling cautious optimism among analysts.

Don’t Let Luck Decide Your Entry Point
Optimize your entry points with our advanced ProRealTime indicators. You’ll get efficient buy signals with precise price targets for maximum performance. Start outperforming now!
Analyst & Consumer Opinions
This section examines CenterPoint Energy, Inc.’s analyst ratings alongside consumer feedback to gauge market sentiment and satisfaction.
Stock Grades
The latest analyst ratings for CenterPoint Energy, Inc. reveal a stable outlook with some recent upgrades and consistent holds:
| Grading Company | Action | New Grade | Date |
|---|---|---|---|
| Wells Fargo | Maintain | Overweight | 2026-01-20 |
| Barclays | Maintain | Equal Weight | 2026-01-15 |
| BMO Capital | Upgrade | Outperform | 2026-01-13 |
| UBS | Maintain | Buy | 2025-12-17 |
| Keybanc | Upgrade | Overweight | 2025-12-12 |
| JP Morgan | Maintain | Neutral | 2025-12-11 |
| Scotiabank | Maintain | Sector Outperform | 2025-10-24 |
| Morgan Stanley | Maintain | Equal Weight | 2025-10-21 |
| Barclays | Maintain | Equal Weight | 2025-10-21 |
| UBS | Maintain | Buy | 2025-10-10 |
Recent activity shows a cautious but positive tilt, with a few upgrades from neutral or equal weight to outperform and overweight. Most firms maintain stable ratings, reflecting steady confidence without aggressive shifts.
Consumer Opinions
CenterPoint Energy, Inc. sparks mixed emotions among its customers, revealing both loyalty and frustration.
| Positive Reviews | Negative Reviews |
|---|---|
| Reliable energy supply with minimal outages | Customer service can be slow to respond |
| Competitive pricing compared to peers | Billing errors reported frequently |
| Clear and informative outage notifications | Limited online account management options |
Overall, consumers appreciate CenterPoint’s dependable energy delivery and competitive rates. However, recurring complaints about customer service delays and billing issues suggest areas needing urgent improvement.
Risk Analysis
Below is a concise overview of the key risks facing CenterPoint Energy, Inc., assessing their likelihood and potential impact:
| Category | Description | Probability | Impact |
|---|---|---|---|
| Financial Health | Altman Z-score at 0.64 signals high bankruptcy risk. | High | Severe |
| Liquidity | Current ratio of 0.91 indicates potential short-term strain. | Moderate | Moderate |
| Profitability | ROIC (4.01%) below WACC (8.46%) shows value destruction. | Moderate | High |
| Operational | Low asset turnover (0.19) suggests inefficient asset use. | Moderate | Moderate |
| Market Volatility | Beta of 0.59 implies lower sensitivity but limits upside. | Low | Low |
| Dividend Stability | Dividend yield of 2.29% is favorable but depends on cash flow. | Moderate | Moderate |
The most alarming risk is financial distress, highlighted by the Altman Z-score deep in the distress zone, signaling potential solvency issues. Coupled with a current ratio below 1, liquidity may constrain operations under stress. Additionally, the company’s ROIC underperformance relative to WACC signals capital allocation challenges that could erode shareholder value. Investors should weigh these risks carefully against utility sector benchmarks.
Should You Buy CenterPoint Energy, Inc.?
CenterPoint Energy appears to show improving operational efficiency with growing profitability despite a slightly unfavorable moat signaling value destruction. Its leverage profile seems manageable, yet financial health scores suggest caution. Overall, the company could be seen as a C+ rating profile.
Strength & Efficiency Pillars
CenterPoint Energy, Inc. posts a favorable net margin of 11.24%, demonstrating operational profitability. The EBIT margin stands strong at 22.55%, underpinning efficient core operations. However, the company’s return on invested capital (ROIC) at 4.01% trails its weighted average cost of capital (WACC) of 8.46%, indicating value destruction rather than creation. Despite this, the firm maintains a moderate return on equity (ROE) of 9.43%, reflecting some shareholder value generation. Overall, operational efficiency is solid, but capital allocation remains a concern.
Weaknesses and Drawbacks
The company is in financial distress with an Altman Z-Score of 0.64, signaling a high bankruptcy risk. This solvency threat overshadows profitability. The current ratio at 0.91 warns of liquidity pressure, risking short-term obligations. Valuation metrics are neutral but lean toward risk, with a P/E of 23.8 and a P/B of 2.24, suggesting moderate premium pricing. Asset turnover is weak at 0.19, limiting growth capacity. These red flags demand cautious risk management.
Our Final Verdict about CenterPoint Energy, Inc.
Despite operational profitability, CenterPoint Energy’s distressed financial health, evidenced by a Z-Score below 1.8, renders its profile highly speculative. The solvency risk outweighs positive margins and a bullish market trend. This company may appear too risky for conservative capital and requires close monitoring. Investors should weigh the potential returns against significant financial vulnerabilities before considering exposure.
Disclaimer: This content is for informational purposes only and does not constitute financial, investment, or other professional advice. Investing in financial markets involves a significant risk of loss, and past performance is not indicative of future results.
Additional Resources
- CenterPoint Energy, Inc. $CNP Shares Bought by Tredje AP fonden – MarketBeat (Feb 21, 2026)
- Houston, We Have A Winner In CenterPoint Energy Stock (NYSE:CNP) – Seeking Alpha (Feb 21, 2026)
- CenterPoint Energy Inc – Q4 2025 Results Highlight Improved Revenue & Earnings – AlphaStreet News (Feb 19, 2026)
- CenterPoint Energy Inc Q4 Income Advances – Nasdaq (Feb 19, 2026)
- CenterPoint Energy Inc (CNP) Q4 2025 Earnings Call Highlights: S – GuruFocus (Feb 19, 2026)
For more information about CenterPoint Energy, Inc., please visit the official website: centerpointenergy.com