Home > Analyses > Healthcare > Centene Corporation
Centene Corporation transforms healthcare access for millions of under-insured and uninsured Americans. It commands the managed care industry with comprehensive government-backed health plans covering Medicaid, Medicare, and specialized services. Renowned for innovation in coordinated care and expansive service offerings, Centene sets standards in quality and market influence. As the healthcare landscape evolves, I ask: do Centene’s fundamentals still support its current valuation and growth ambitions?

Table of contents
Business Model & Company Overview
Centene Corporation, founded in 1984 and headquartered in St. Louis, Missouri, stands as a leading multinational healthcare enterprise. It delivers a comprehensive ecosystem of health plans and services tailored to under-insured and uninsured populations in the US. Its core mission integrates government-subsidized programs with specialty services, creating a seamless network of primary and specialty care, pharmacy benefits, and social support.
Centene’s revenue engine balances managed care health plans and specialty services, generating recurring income from government programs and commercial clients. Its footprint spans the Americas with expanding influence in correctional and military health sectors. This diversified model builds a durable economic moat, positioning Centene to shape the future of accessible healthcare delivery.
Financial Performance & Fundamental Metrics
I analyze Centene Corporation’s income statement, key financial ratios, and dividend payout policy to assess its core financial health and shareholder value.
Income Statement
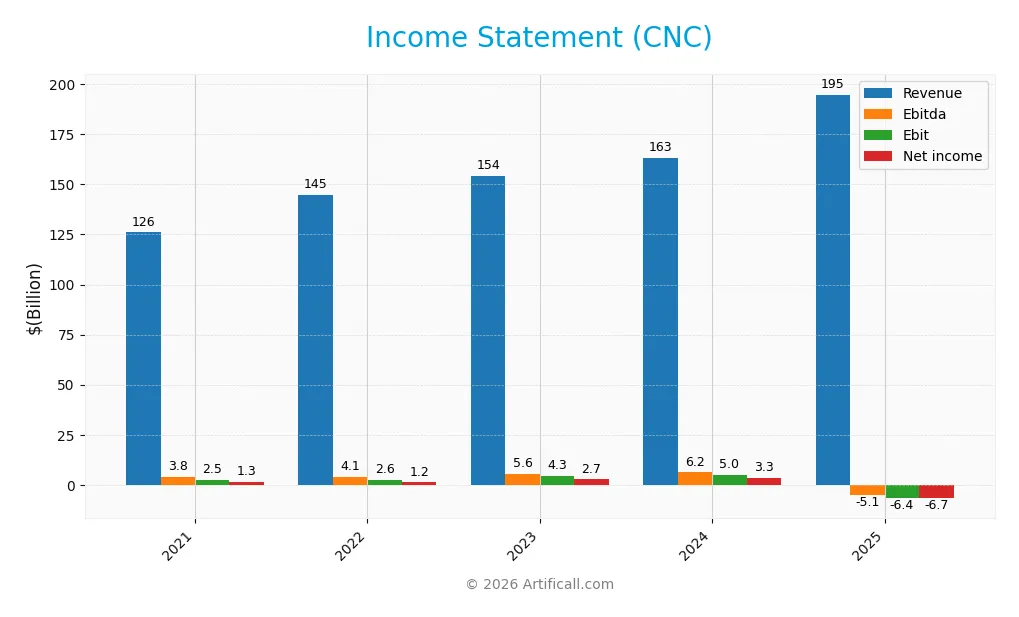
The table below summarizes Centene Corporation’s key income statement figures for fiscal years 2021 through 2025, reflecting trends in revenue, profitability, and earnings per share.
| 2021 | 2022 | 2023 | 2024 | 2025 | |
|---|---|---|---|---|---|
| Revenue | 126B | 145B | 154B | 163B | 195B |
| Cost of Revenue | 112B | 128B | 137B | 146B | 171B |
| Operating Expenses | 12.4B | 15.3B | 14.4B | 13.7B | 31.5B |
| Gross Profit | 14.2B | 16.7B | 17.3B | 16.8B | 23.8B |
| EBITDA | 3.8B | 4.1B | 5.6B | 6.2B | -5.1B |
| EBIT | 2.5B | 2.6B | 4.3B | 4.9B | -6.4B |
| Interest Expense | 665M | 665M | 725M | 702M | 678M |
| Net Income | 1.3B | 1.2B | 2.7B | 3.3B | -6.7B |
| EPS | 2.31 | 2.09 | 4.97 | 6.33 | -13.61 |
| Filing Date | 2022-02-22 | 2023-02-21 | 2024-02-20 | 2025-02-18 | 2026-02-17 |
Income Statement Evolution
Centene’s revenue expanded robustly by 19.4% in 2025, continuing a strong 54.6% growth since 2021. However, net income deteriorated sharply, swinging from a 3.3B profit in 2024 to a 6.7B loss in 2025. Gross margin remained stable near 12.2%, but operating and net margins collapsed, reflecting rising expenses outpacing revenue gains.
Is the Income Statement Favorable?
The 2025 income statement shows unfavorable fundamentals. Despite a favorable revenue surge, EBITDA and EBIT turned negative, driven by rising operating and other expenses. Interest costs remained low relative to revenue, a positive aspect. Yet, net margin slid to -3.4%, with EPS plunging to -13.61, signaling significant profitability challenges ahead.
Financial Ratios
The table below presents key financial ratios for Centene Corporation (CNC) over the last five fiscal years, providing insight into its profitability, liquidity, leverage, and efficiency:
| Ratios | 2021 | 2022 | 2023 | 2024 | 2025 |
|---|---|---|---|---|---|
| Net Margin | 1.07% | 0.83% | 1.75% | 2.03% | -3.43% |
| ROE | 5.03% | 5.00% | 10.46% | 12.51% | -33.44% |
| ROIC | 2.48% | 1.66% | 4.56% | 5.07% | -18.85% |
| P/E | 35.65 | 39.24 | 14.92 | 9.56 | -3.03 |
| P/B | 1.79 | 1.96 | 1.56 | 1.20 | 1.01 |
| Current Ratio | 1.11 | 1.06 | 1.11 | 1.11 | 1.10 |
| Quick Ratio | 1.11 | 1.06 | 1.11 | 1.11 | 1.10 |
| D/E | 0.85 | 0.89 | 0.73 | 0.74 | 0.87 |
| Debt-to-Assets | 28.9% | 27.8% | 22.3% | 23.6% | 22.7% |
| Interest Coverage | 2.68 | 1.98 | 4.04 | 4.52 | -11.24 |
| Asset Turnover | 1.61 | 1.88 | 1.82 | 1.98 | 2.54 |
| Fixed Asset Turnover | 18.11 | 28.99 | 63.77 | 67.22 | 95.62 |
| Dividend Yield | 0% | 0% | 0% | 0% | 0% |
Evolution of Financial Ratios
From 2021 to 2025, Centene Corporation’s Return on Equity (ROE) declined sharply, turning negative at -33.44% in 2025. The Current Ratio remained stable around 1.1, indicating consistent liquidity. The Debt-to-Equity Ratio fluctuated mildly, ending at 0.87 in 2025, reflecting moderate leverage. Profitability deteriorated notably, with net margins shifting from positive to -3.43% in 2025.
Are the Financial Ratios Fovorable?
In 2025, Centene’s profitability metrics, including ROE and net margin, were unfavorable. Liquidity ratios showed mixed signals: the Current Ratio was neutral while the Quick Ratio was favorable at 1.1. Leverage was moderate with a Debt-to-Equity of 0.87 and a favorable Debt-to-Assets ratio of 22.67%. Asset turnover ratios were strong, but interest coverage was deeply negative, highlighting financial stress. Overall, the ratios are slightly favorable.
Shareholder Return Policy
Centene Corporation (CNC) does not pay dividends, reflecting its negative net income in 2025 and a strategic focus on reinvestment. The company maintains share buybacks, supporting shareholder value through capital return despite zero dividend yield and payout ratio.
This approach aligns with a growth phase prioritizing cash flow generation and operational recovery. While buybacks provide some shareholder returns, the lack of dividends and recent losses suggest caution. The policy supports long-term value creation but depends heavily on improving profitability and cash flow stability.
Score analysis
The radar chart below illustrates Centene Corporation’s key financial scores across multiple valuation and performance metrics:
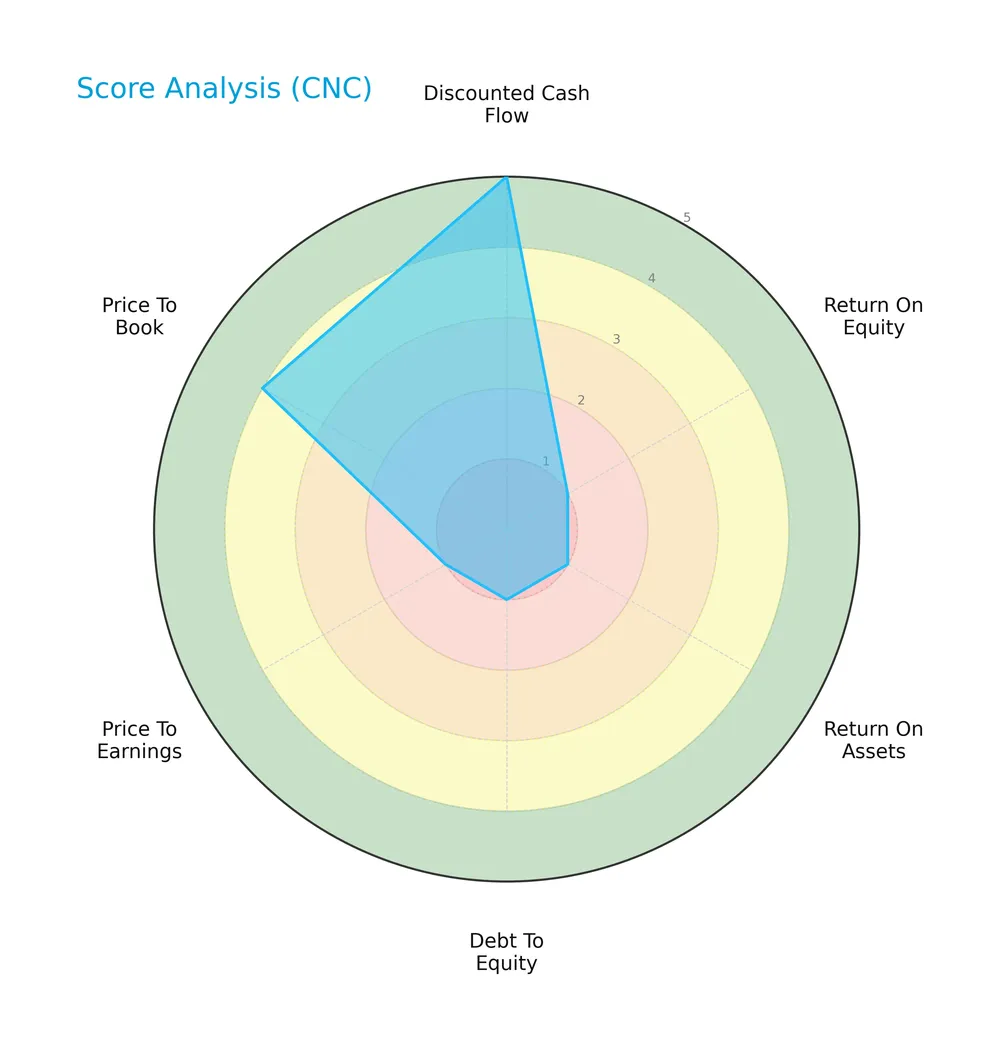
Centene scores very favorably on discounted cash flow (5) and price-to-book (4). However, it shows significant weakness in return on equity, return on assets, debt-to-equity, and price-to-earnings, all scoring at 1, indicating operational and valuation challenges.
Analysis of the company’s bankruptcy risk
Centene’s Altman Z-Score places it in the grey zone, signaling a moderate risk of financial distress and potential bankruptcy:

Is the company in good financial health?
The Piotroski Score diagram provides insight into Centene’s financial condition based on profitability, leverage, and efficiency:

With a score of 6, Centene reflects average financial health. This suggests some strengths but also room for improvement before it can be considered financially robust.
Competitive Landscape & Sector Positioning
This sector analysis explores Centene Corporation’s strategic positioning, revenue streams, and key products within healthcare. I will assess whether Centene holds a competitive advantage over its main rivals in this complex market.
Strategic Positioning
Centene concentrates heavily on Medicaid, generating $148B in 2025, complemented by $42B from commercial plans and $5B from specialty services. Its focus on government-subsidized healthcare and diverse service offerings creates a specialized portfolio within the US market.
Revenue by Segment
This pie chart illustrates Centene Corporation’s revenue breakdown by segment for the fiscal year 2025, highlighting the distribution among Medicaid, Commercial, and Other Operating segments.
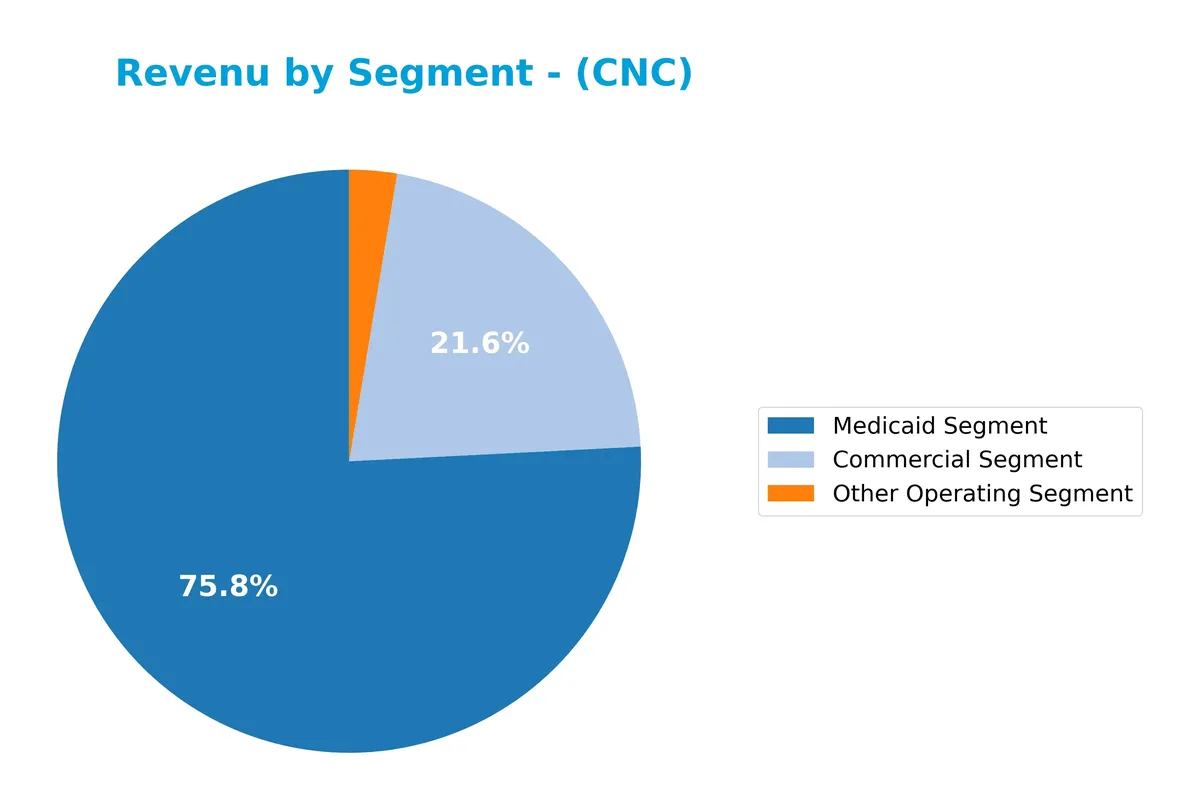
In 2025, Medicaid drives Centene’s revenue with $148B, reflecting its dominant role in the business. The Commercial segment contributes a significant $42B, showing solid growth from prior years. The Other Operating segment accounts for $5.1B, indicating steady but smaller scale operations. This concentration in Medicaid signals reliance on government programs, which may pose regulatory risks despite recent revenue acceleration.
Key Products & Brands
Centene Corporation’s main products and services cover diverse healthcare programs and plans, detailed as follows:
| Product | Description |
|---|---|
| Medicaid Segment | Health plan coverage for under-insured through government-subsidized Medicaid and related programs. |
| Commercial Segment | Individual, small group, and large group commercial healthcare products for employers and members. |
| Other Operating Segment | Specialty Services including pharmacy benefits management, nurse advice lines, vision, dental, and staffing services. |
| Health Care, Premium | Includes primary and specialty physician care, hospital care, emergency services, and behavioral health. |
| Service | Ancillary services supporting healthcare plans, such as care coordination, telehealth, and prescription management. |
Centene’s portfolio spans government-subsidized Medicaid plans and a broad commercial segment. Its specialty services support correctional and military health systems, emphasizing integrated healthcare delivery.
Main Competitors
There are 7 competitors in total, with the table below listing the top 7 leaders by market capitalization:
| Competitor | Market Cap. |
|---|---|
| UnitedHealth Group Incorporated | 305B |
| CVS Health Corporation | 102B |
| Elevance Health Inc. | 79B |
| Cigna Corporation | 75B |
| Humana Inc. | 32B |
| Centene Corporation | 21B |
| Molina Healthcare, Inc. | 9.7B |
Centene Corporation ranks 6th among its competitors, holding 6.65% of the market cap of the leader, UnitedHealth Group. It sits below both the average market cap of the top 10 (89B) and the sector median (74.6B). The company maintains a 57% market cap gap to its nearest competitor above, Humana Inc.
Comparisons with competitors
Check out how we compare the company to its competitors:
Does Centene Corporation have a competitive advantage?
Centene Corporation currently lacks a competitive advantage, as it consistently destroys value with a ROIC well below its WACC and a sharply declining profitability trend. Its negative EBIT and net margins highlight operational challenges despite revenue growth.
Looking ahead, Centene’s broad healthcare coverage and Specialty Services segment position it to explore new markets and expand offerings, including telehealth and pharmacy benefits management. These opportunities could influence its future competitive standing if effectively leveraged.
SWOT Analysis
This SWOT analysis highlights Centene Corporation’s key internal and external factors shaping its strategic outlook.
Strengths
- strong revenue growth of 19.4% in 2025
- diversified government-sponsored healthcare programs
- favorable debt-to-assets ratio at 22.7%
Weaknesses
- negative net margin at -3.4%
- declining ROIC indicating value destruction
- unfavorable profitability ratios including ROE at -33.4%
Opportunities
- expansion in Medicaid and Medicare markets
- increasing demand for integrated healthcare services
- potential to improve operational efficiency
Threats
- regulatory changes in healthcare policies
- rising operational expenses outpacing revenue growth
- intense competition in managed care sector
Centene faces serious profitability challenges despite robust revenue growth and a solid market position. The company must prioritize operational improvements and cost control to convert growth into sustainable profits.
Stock Price Action Analysis
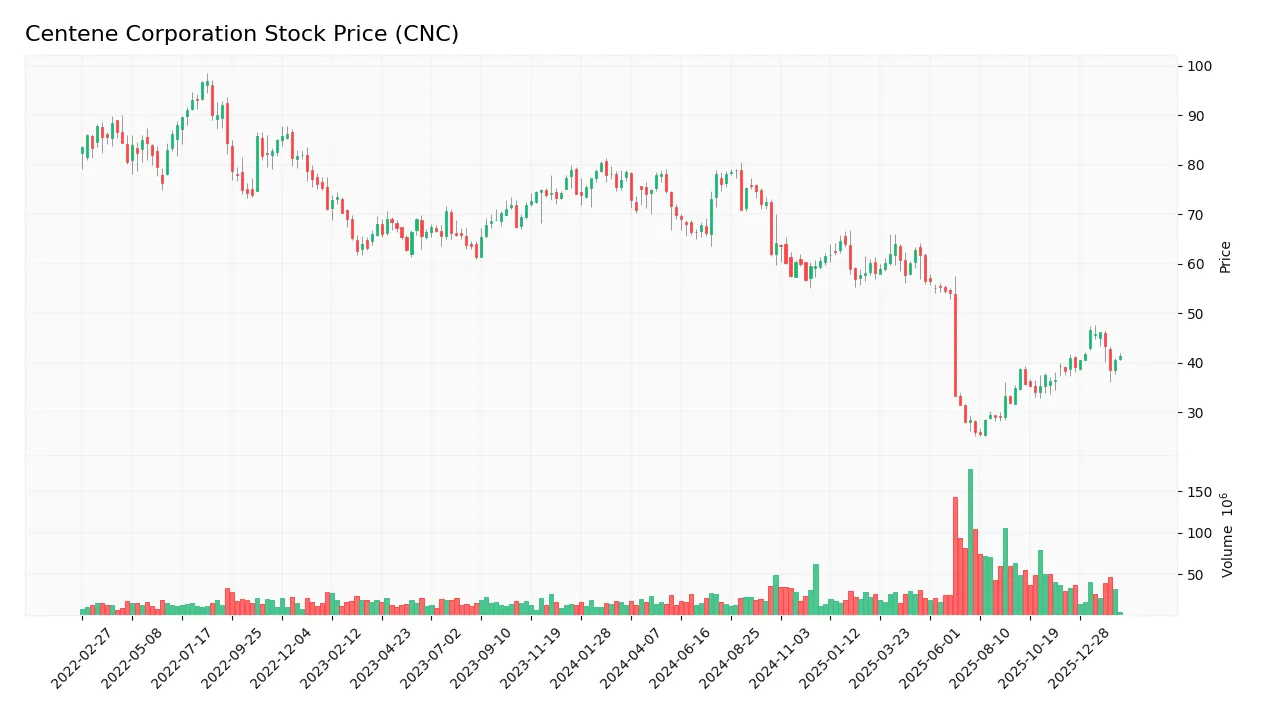
The weekly stock chart displays Centene Corporation’s price movements over the last 12 months, highlighting key fluctuations and recent momentum:
Trend Analysis
Over the past 12 months, Centene’s stock price declined by 47.46%, marking a clear bearish trend. Volatility remains high with a standard deviation of 15.74%. The stock hit a high of 78.83 and a low of 25.59, with accelerating downward momentum throughout the period.
Volume Analysis
Trading volume has increased, with total volume reaching 3.7B shares. Buyer volume slightly exceeds seller volume at 50.36%, indicating balanced but cautious participation. Over the recent three months, seller volume slightly dominates at 52.56%, reflecting neutral buyer behavior and moderate market hesitancy.
Target Prices
Analysts present a clear target price consensus for Centene Corporation, reflecting moderate upside potential.
| Target Low | Target High | Consensus |
|---|---|---|
| 38 | 59 | 45 |
The target range signals cautious optimism, with expectations centered around a 45 price level, suggesting steady growth potential.

Don’t Let Luck Decide Your Entry Point
Optimize your entry points with our advanced ProRealTime indicators. You’ll get efficient buy signals with precise price targets for maximum performance. Start outperforming now!
Analyst & Consumer Opinions
This section examines Centene Corporation’s recent analyst ratings alongside consumer feedback to provide a balanced view.
Stock Grades
Here is the latest summary of Centene Corporation’s stock grades from leading financial institutions:
| Grading Company | Action | New Grade | Date |
|---|---|---|---|
| Cantor Fitzgerald | Maintain | Neutral | 2026-02-09 |
| Wells Fargo | Maintain | Equal Weight | 2026-01-07 |
| Barclays | Upgrade | Overweight | 2026-01-05 |
| Bernstein | Maintain | Outperform | 2025-11-21 |
| Wells Fargo | Maintain | Equal Weight | 2025-11-12 |
| JP Morgan | Maintain | Neutral | 2025-11-04 |
| Barclays | Maintain | Equal Weight | 2025-11-04 |
| Goldman Sachs | Maintain | Sell | 2025-10-31 |
| TD Cowen | Maintain | Hold | 2025-10-31 |
| Cantor Fitzgerald | Maintain | Neutral | 2025-10-30 |
The grades mostly cluster around neutral and equal weight, reflecting cautious optimism. Barclays’ recent upgrade to overweight stands out against Goldman Sachs’ sell rating, indicating mixed analyst sentiment overall.
Consumer Opinions
Centene Corporation draws a mixed but insightful range of consumer sentiments that reveal the company’s operational impact.
| Positive Reviews | Negative Reviews |
|---|---|
| “Excellent customer service and quick claim processing.” | “Confusing billing statements and unexpected charges.” |
| “Wide network coverage with helpful healthcare options.” | “Long wait times on customer support calls.” |
| “Affordable plans that meet family needs.” | “Limited transparency on policy changes.” |
Overall, consumers praise Centene for its broad coverage and affordability. However, billing clarity and customer support responsiveness remain notable pain points.
Risk Analysis
Below is a summary table of key risks facing Centene Corporation (CNC) based on recent financial and operational data:
| Category | Description | Probability | Impact |
|---|---|---|---|
| Profitability Risk | Negative net margin (-3.43%) and ROE (-33.44%) signal ongoing earnings loss. | High | High |
| Financial Distress | Altman Z-score of 2.69 places CNC in the grey zone, indicating moderate distress risk. | Medium | Medium |
| Leverage Risk | Debt-to-equity ratio and interest coverage are weak, raising solvency concerns. | Medium | High |
| Market Volatility | Beta of 0.488 shows lower sensitivity to market swings but limits upside potential. | Low | Medium |
| Liquidity Risk | Current ratio at 1.1 is just above the threshold, posing a mild liquidity risk. | Medium | Medium |
| Dividend Policy | No dividend yield reduces income appeal for certain investors. | High | Low |
Profitability challenges and weak interest coverage represent the most critical risks. Centene struggles with sustained losses despite favorable capital costs (WACC 4.59%). The grey zone Altman Z-score and below-average Piotroski score (6) confirm financial fragility. Investors must monitor earnings recovery and debt servicing closely.
Should You Buy Centene Corporation?
Centene’s analytical profile appears to be characterized by deteriorating profitability and a very unfavorable moat, suggesting value destruction. Despite a manageable leverage profile and a cautious grey zone Altman Z-Score, its overall rating of C+ reflects significant operational challenges.
Strength & Efficiency Pillars
Centene Corporation’s operational efficiency is challenged, reflected in a negative net margin of -3.43% and a return on invested capital (ROIC) of -18.85%. Its weighted average cost of capital (WACC) stands at a favorable 4.59%, but with ROIC well below WACC, the company is currently destroying value rather than creating it. Despite this, Centene benefits from a robust asset turnover ratio of 2.54, indicating effective asset utilization. However, profitability and capital returns remain significant concerns for long-term value creation.
Weaknesses and Drawbacks
Centene sits in the Altman Z-Score grey zone with a value of 2.69, signaling moderate bankruptcy risk that investors should monitor closely. The company’s return on equity is deeply negative at -33.44%, and EBIT margin is unfavorable at -3.29%, underscoring persistent profitability issues. Additionally, an unfavorable interest coverage ratio of -9.46 raises concerns about debt servicing capacity. While the price-to-book ratio of 1.01 is fair, the negative price-to-earnings ratio reflects losses, complicating valuation and increasing market uncertainty.
Our Final Verdict about Centene Corporation
Centene’s profile appears fundamentally weak, given its consistent value destruction and moderate solvency risks indicated by its Altman Z-Score in the grey zone. Despite some operational strengths like asset turnover, the bearish overall trend and recent neutral buyer dominance suggest caution. The company might appear speculative for conservative investors but could interest those seeking turnaround opportunities with a high tolerance for risk.
Disclaimer: This content is for informational purposes only and does not constitute financial, investment, or other professional advice. Investing in financial markets involves a significant risk of loss, and past performance is not indicative of future results.
Additional Resources
- Superior HealthPlan Publishes 2025 Community Investment Report – Centene Corporation (Feb 17, 2026)
- Deutsche Bank Raises Centene (CNC) PT to $39 While Maintaining Hold Rating – Bitget (Feb 18, 2026)
- Centene Corporation $CNC Stock Holdings Increased by Pallas Capital Advisors LLC – MarketBeat (Feb 17, 2026)
- Centene Corporation (CNC) Stock Report: Navigating Healthcare with a 23.10% Revenue Growth Boost – DirectorsTalk Interviews (Feb 16, 2026)
- Centene Pulls 2025 Guidance as Marketplace Growth Falters – MSN (Feb 16, 2026)
For more information about Centene Corporation, please visit the official website: centene.com