Home > Analyses > Healthcare > Cencora, Inc.
Cencora, Inc. orchestrates the flow of critical pharmaceuticals that shape patient care across the globe. As a powerhouse in medical distribution, it commands an extensive network delivering generics, injectables, vaccines, and specialty products. Renowned for innovation and operational scale, Cencora supports hospitals, pharmacies, and biotech firms with logistics, analytics, and clinical services. The question now is whether its robust market position and expanding services continue to justify its premium valuation and growth prospects.

Table of contents
Business Model & Company Overview
Cencora, Inc., founded in 1871 and headquartered in Conshohocken, PA, commands a leading role in the medical distribution sector. It operates a vast ecosystem connecting pharmaceutical sourcing, distribution, and healthcare services across acute care hospitals, retail pharmacies, and specialty providers. Its integrated approach spans generic drugs, vaccines, clinical support, and consulting, creating a seamless network in healthcare supply.
Cencora’s revenue engine balances product distribution with value-added services like pharmacy management and data analytics. Its global footprint covers the Americas, Europe, and Asia, offering specialty logistics and commercialization support. This diversified model builds a powerful economic moat through scale, service integration, and critical industry partnerships shaping the future of healthcare supply chains.
Financial Performance & Fundamental Metrics
I analyze Cencora, Inc.’s income statement, key financial ratios, and dividend payout policy to reveal its operational efficiency and shareholder value creation.
Income Statement
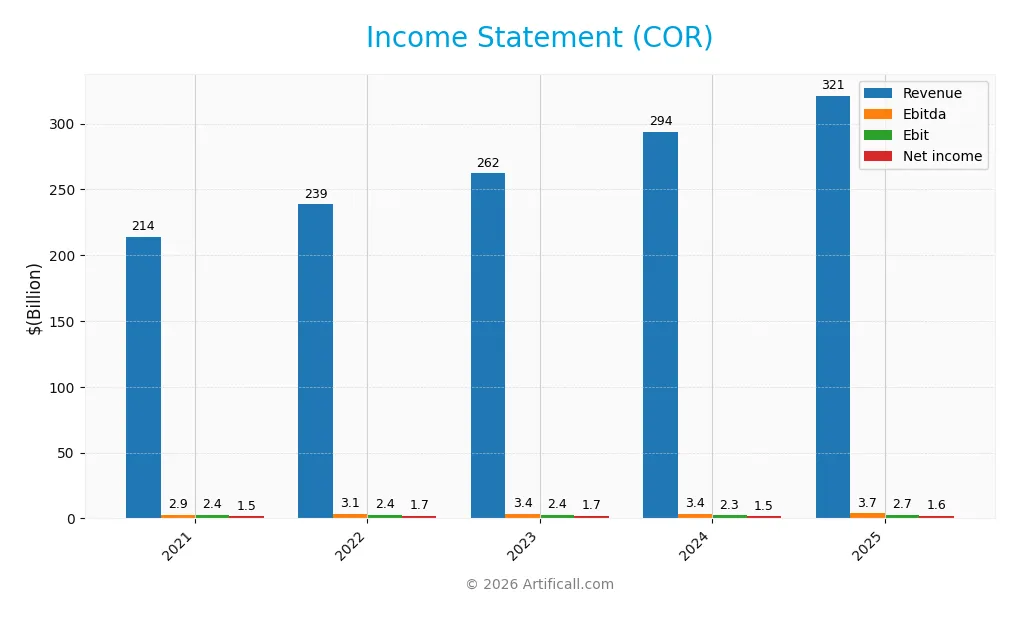
The table below summarizes Cencora, Inc.’s key income statement figures for fiscal years 2021 through 2025, showing revenue, expenses, profits, and earnings per share.
| 2021 | 2022 | 2023 | 2024 | 2025 | |
|---|---|---|---|---|---|
| Revenue | 214B | 239B | 262B | 294B | 321B |
| Cost of Revenue | 208B | 231B | 254B | 285B | 311B |
| Operating Expenses | 3.6B | 4.8B | 5.3B | 5.7B | 6.5B |
| Gross Profit | 6.3B | 7.6B | 7.8B | 8.7B | 10.1B |
| EBITDA | 2.9B | 3.1B | 3.4B | 3.4B | 3.7B |
| EBIT | 2.4B | 2.4B | 2.4B | 2.3B | 2.7B |
| Interest Expense | 183M | 232M | 276M | 249M | 420M |
| Net Income | 1.5B | 1.7B | 1.7B | 1.5B | 1.6B |
| EPS | 7.48 | 8.15 | 8.62 | 7.60 | 8.02 |
| Filing Date | 2021-11-23 | 2022-11-22 | 2023-11-21 | 2024-11-26 | 2025-11-25 |
Income Statement Evolution
From 2021 to 2025, COR’s revenue grew 50.16%, showing consistent top-line expansion. Net income increased marginally by 0.92%, indicating limited bottom-line growth despite higher sales. Gross margin held steady at 3.16%, while EBIT margin remained neutral at 0.83%, reflecting stable profitability ratios amid rising operating expenses.
Is the Income Statement Favorable?
In 2025, COR achieved 9.31% revenue growth and 16.55% gross profit growth, both favorable signs. EBIT grew 18.89%, supporting operational strength. However, net margin declined 5.79%, signaling margin pressure. EPS rose 5.71%, reflecting improved shareholder returns. Interest expense at 0.13% of revenue is favorable. Overall, fundamentals appear generally favorable with some margin challenges.
Financial Ratios
The table below presents key financial ratios for Cencora, Inc. over the last five fiscal years, illustrating profitability, liquidity, leverage, and valuation metrics:
| Ratios | 2021 | 2022 | 2023 | 2024 | 2025 |
|---|---|---|---|---|---|
| Net Margin | 0.72% | 0.71% | 0.67% | 0.51% | 0.48% |
| ROE | 6.89 | -5.86 | 3.34 | 2.34 | 1.03 |
| ROIC | 11.4% | 14.8% | 13.7% | 17.2% | 13.4% |
| P/E | 16.0 | 16.6 | 21.1 | 29.6 | 39.0 |
| P/B | 110.1 | -97.4 | 70.5 | 69.2 | 40.2 |
| Current Ratio | 0.94 | 0.91 | 0.88 | 0.88 | 0.90 |
| Quick Ratio | 0.57 | 0.55 | 0.52 | 0.53 | 0.55 |
| D/E | 29.9 | -19.7 | 9.17 | 6.79 | 5.08 |
| Debt-to-Assets | 11.7% | 10.1% | 7.7% | 6.5% | 10.0% |
| Interest Coverage | 14.7 | 11.9 | 8.88 | 12.2 | 8.69 |
| Asset Turnover | 3.73 | 4.22 | 4.19 | 4.38 | 4.20 |
| Fixed Asset Turnover | 98.9 | 111.8 | 122.8 | 134.8 | 126.6 |
| Dividend Yield | 1.49% | 1.39% | 1.08% | 0.93% | 0.72% |
Evolution of Financial Ratios
Return on Equity (ROE) surged significantly to 103% in 2025, indicating a sharp rise in profitability. However, the Current Ratio remained below 1, signaling ongoing liquidity concerns. The Debt-to-Equity Ratio decreased from extremely high values but stayed elevated at 5.08, reflecting persistent financial leverage. Profit margins showed minor fluctuations with a slight downward trend.
Are the Financial Ratios Favorable?
In 2025, profitability ratios like ROE and Return on Invested Capital (13.4%) outperform the Weighted Average Cost of Capital (6.7%), affirming strong capital efficiency. Liquidity ratios, including Current (0.9) and Quick (0.55), remain below industry norms, posing risk. Leverage is high with a Debt-to-Equity of 5.08, despite a favorable Debt-to-Assets ratio of 10%. Market multiples such as P/E (39) and P/B (40) appear stretched. Overall, the ratios present a neutral profile with balanced positives and negatives.
Shareholder Return Policy
Cencora, Inc. maintains a consistent dividend payout ratio near 28%, with dividend per share rising steadily from $1.78 in 2021 to $2.25 in 2025. The annual dividend yield ranges from 0.7% to 1.5%, supported by free cash flow coverage above 80%, indicating sustainable distributions.
The company supplements dividends with share buybacks, balancing cash returns to shareholders. This disciplined approach, combining moderate payout ratios and buybacks, appears aligned with sustainable long-term value creation without overextending cash resources.
Score analysis
The following radar chart displays key financial scores assessing Cencora, Inc.’s valuation, profitability, and leverage:
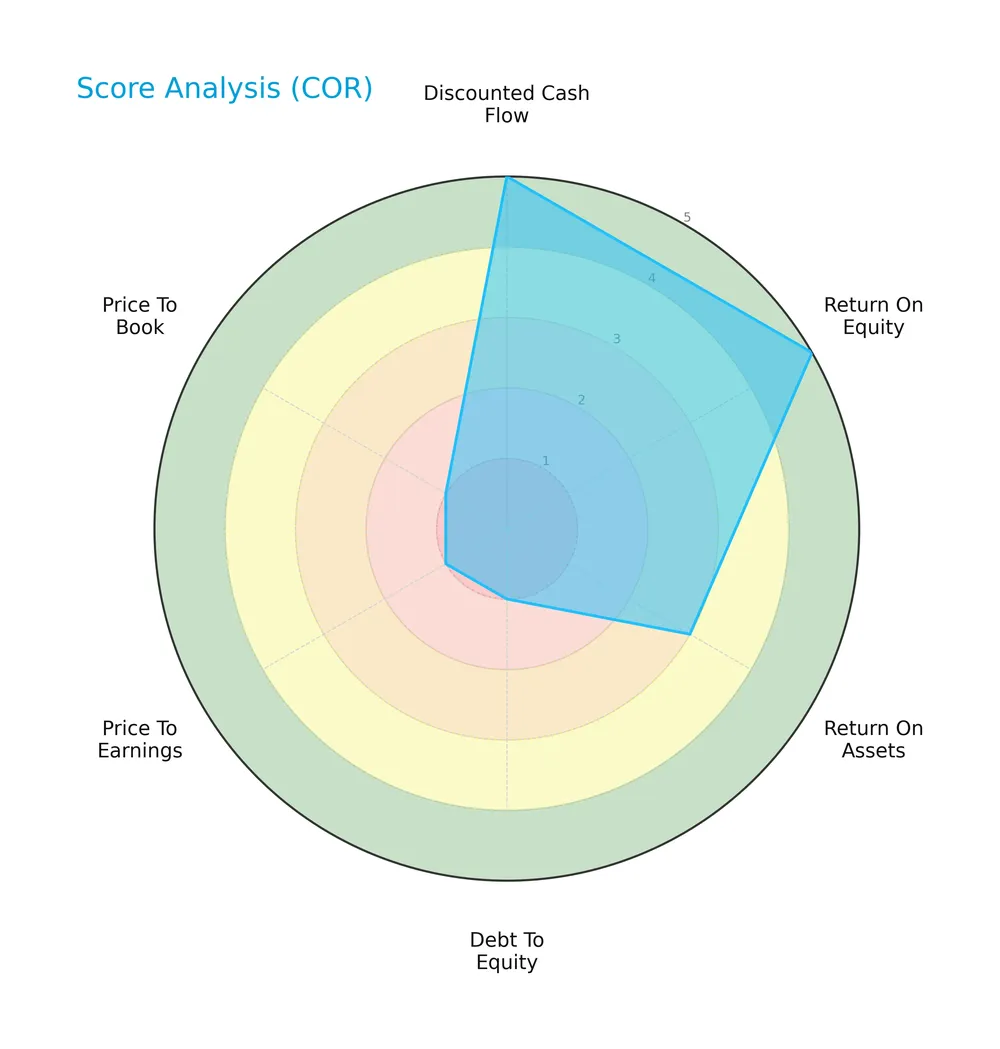
Cencora scores very favorably on discounted cash flow and return on equity, indicating strong profitability and valuation appeal. Return on assets is moderate. However, debt-to-equity, price-to-earnings, and price-to-book scores are very unfavorable, signaling potential concerns in leverage and market pricing.
Analysis of the company’s bankruptcy risk
Cencora’s Altman Z-Score places it firmly in the safe zone, suggesting a low risk of bankruptcy and strong financial stability:

Is the company in good financial health?
The Piotroski Score diagram illustrates Cencora’s financial health based on nine key accounting criteria:

With a Piotroski score of 5, Cencora shows average financial strength. This middling score reflects a balanced but not robust financial condition, indicating moderate operational and profitability performance.
Competitive Landscape & Sector Positioning
This sector analysis examines Cencora, Inc.’s strategic positioning, revenue segments, key products, and main competitors. I will assess whether Cencora holds a competitive advantage within the healthcare distribution industry.
Strategic Positioning
Cencora, Inc. concentrates heavily on pharmaceutical distribution, generating over 90% of revenue from U.S. Healthcare Solutions. It maintains geographic diversification with significant international healthcare services, balancing domestic scale with global reach across multiple pharmaceutical and healthcare product lines.
Revenue by Segment
This pie chart illustrates Cencora, Inc.’s revenue breakdown by segment for fiscal year 2021, highlighting the dominant sources of sales within the period.
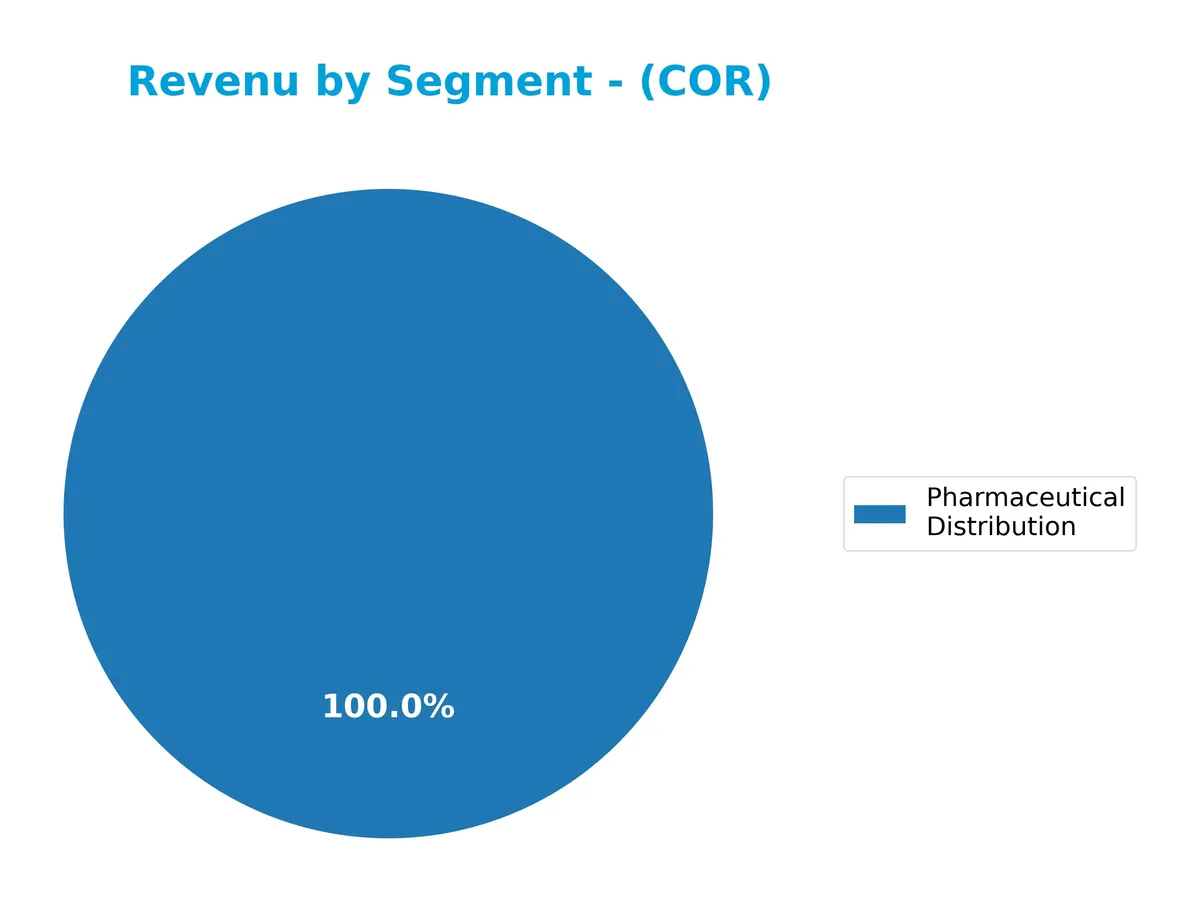
Pharmaceutical Distribution overwhelmingly drives Cencora’s business, generating $198B in 2021. Other segments contribute significantly less, with no detailed breakdown that year. Historically, these secondary segments showed modest growth but remain small compared to the core distribution arm. The concentration risk is notable, as the latest data reveals limited diversification beyond the pharmaceutical distribution segment, underscoring dependence on this primary revenue stream.
Key Products & Brands
Cencora’s key products and brands span pharmaceutical distribution, animal health, and global commercialization services:
| Product | Description |
|---|---|
| Pharmaceutical Distribution | Distribution of generic and injectable pharmaceuticals, OTC healthcare products, vaccines, and related services to hospitals, pharmacies, clinics, and other healthcare providers. |
| Global Commercialization Services | Services supporting pharmaceutical manufacturers, including clinical trial support, commercialization, product post-approval, and data analytics. |
| MWI Animal Health | Distribution of pharmaceuticals, vaccines, diagnostics, and other products for companion and production animals. |
| Other Segments | Includes pharmacy management and consulting services, supply management software, packaging solutions, sales force services, and specialty logistics. |
Cencora’s product portfolio is heavily weighted toward pharmaceutical distribution, generating the vast majority of revenue. Complementary services and animal health expand its healthcare ecosystem.
Main Competitors
There are 4 main competitors in the Healthcare Medical – Distribution sector; the table lists the top 4 leaders by market capitalization:
| Competitor | Market Cap. |
|---|---|
| McKesson Corporation | 103B |
| Cencora, Inc. | 66B |
| Cardinal Health, Inc. | 49B |
| Henry Schein, Inc. | 9.4B |
Cencora ranks 2nd among its competitors, holding 66.55% of the market cap of the leader, McKesson. It stands above both the average market cap of the top 10 (57B) and the median sector benchmark (57B). The company leads Cardinal Health by 50.26%, showing a significant gap over its closest rival below.
Comparisons with competitors
Check out how we compare the company to its competitors:
Does Cencora have a competitive advantage?
Cencora demonstrates a sustainable competitive advantage, creating value with a robust ROIC exceeding WACC by 6.7%, alongside a strong upward ROIC trend. This indicates efficient capital use and growing profitability.
Looking ahead, Cencora’s diverse distribution network and expansion in international and U.S. healthcare segments position it well to capture new market opportunities and innovate in pharmaceutical supply and services.
SWOT Analysis
This analysis highlights Cencora’s internal capabilities and external market factors to guide strategic decisions.
Strengths
- strong ROIC above WACC indicating value creation
- diverse product portfolio across healthcare segments
- robust revenue growth of 50% over 5 years
Weaknesses
- low current and quick ratios signal liquidity concerns
- high debt-to-equity ratio risks financial flexibility
- expensive valuation multiples (PE and PB)
Opportunities
- expanding international healthcare solutions segment
- increasing demand for specialty pharmaceuticals
- leveraging data analytics for competitive advantage
Threats
- pricing pressure in pharmaceutical distribution
- regulatory risks in healthcare industry
- competition from integrated healthcare providers
Cencora exhibits a solid competitive moat with increasing profitability but faces liquidity and valuation risks. Strategic focus should balance growth initiatives with prudent financial management to mitigate these vulnerabilities.
Stock Price Action Analysis
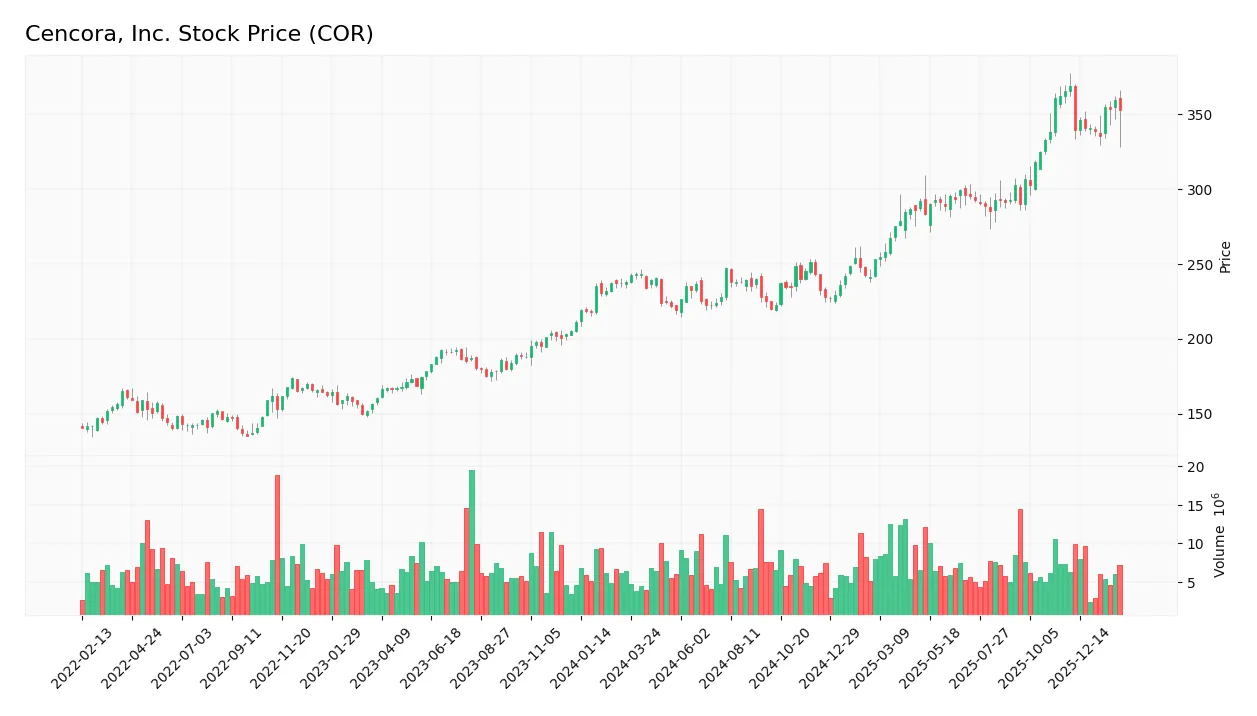
The following weekly chart illustrates Cencora, Inc.’s stock price movement over the last 12 months, highlighting key highs and lows:
Trend Analysis
Over the past year, COR’s stock gained 48.13%, confirming a bullish trend despite decelerating momentum. The price ranged between 218.89 and 368.93, with a high volatility level (std. dev. 43.27). However, recent months show a mild reversal, down 3.49% with a negative slope of -0.37.
Volume Analysis
Total trading volume increased, with buyers controlling 55.22% overall, signaling strong demand. However, in the recent three months, seller volume slightly surpassed buyers (53.13%), indicating a short-term seller dominance and cautious investor sentiment.
Target Prices
Analysts present a solid target consensus reflecting confidence in Cencora, Inc.’s growth prospects.
| Target Low | Target High | Consensus |
|---|---|---|
| 340 | 440 | 398 |
The target range spans from 340 to 440, indicating moderate upside potential. The consensus at 398 suggests analysts expect steady appreciation.

Don’t Let Luck Decide Your Entry Point
Optimize your entry points with our advanced ProRealTime indicators. You’ll get efficient buy signals with precise price targets for maximum performance. Start outperforming now!
Analyst & Consumer Opinions
This section examines analyst ratings and consumer feedback to provide a comprehensive view of Cencora, Inc.’s market perception.
Stock Grades
Here is the latest overview of stock grades from well-known financial institutions for Cencora, Inc.:
| Grading Company | Action | New Grade | Date |
|---|---|---|---|
| Evercore ISI Group | Maintain | Outperform | 2026-02-05 |
| Morgan Stanley | Upgrade | Overweight | 2026-01-29 |
| Jefferies | Upgrade | Buy | 2026-01-22 |
| B of A Securities | Maintain | Neutral | 2026-01-05 |
| Wells Fargo | Maintain | Overweight | 2025-11-11 |
| JP Morgan | Maintain | Overweight | 2025-11-11 |
| TD Cowen | Maintain | Buy | 2025-11-10 |
| UBS | Maintain | Buy | 2025-11-07 |
| Baird | Maintain | Outperform | 2025-11-06 |
| Mizuho | Maintain | Outperform | 2025-11-06 |
The overall trend shows strong confidence in the stock, with multiple upgrades and several firms maintaining Buy or Outperform ratings. Neutral ratings remain limited, highlighting a generally positive market sentiment.
Consumer Opinions
Consumers show a mixed but generally favorable sentiment toward Cencora, Inc., highlighting key operational strengths alongside areas needing improvement.
| Positive Reviews | Negative Reviews |
|---|---|
| “Reliable product quality with consistent delivery.” | “Customer service response times are slow.” |
| “Competitive pricing compared to peers in the sector.” | “Website interface can be confusing to navigate.” |
| “Strong commitment to sustainable practices.” | “Occasional delays in order fulfillment.” |
Overall, customers appreciate Cencora’s product reliability and cost competitiveness. However, recurring issues with customer support and order processing temper the enthusiasm. Addressing these could enhance consumer loyalty significantly.
Risk Analysis
Below is a summary table of key risks facing Cencora, Inc., categorized by likelihood and potential impact:
| Category | Description | Probability | Impact |
|---|---|---|---|
| Valuation Risk | High P/E (39) and P/B (40) ratios suggest overvaluation risk in current price | High | High |
| Liquidity Risk | Current ratio (0.9) and quick ratio (0.55) below 1 indicate tight liquidity | Medium | Medium |
| Leverage Risk | Debt-to-equity ratio above 5 signals heavy reliance on debt financing | Medium | High |
| Profitability Risk | Net margin extremely low at 0.48% despite strong ROE and ROIC | Medium | Medium |
| Market Risk | Beta of 0.68 suggests lower volatility but also sensitivity to sector trends | Low | Medium |
Most concerning is Cencora’s stretched valuation amid a mixed financial profile. The company’s liquidity ratios fall below industry safety norms, raising red flags for short-term financial flexibility. Heavy debt levels amplify risk, especially if market conditions tighten or interest rates rise. However, its Altman Z-score near 4.87 places it securely in the “safe zone” for bankruptcy risk. Investors should watch valuation pressures and liquidity constraints closely.
Should You Buy Cencora, Inc.?
Cencora, Inc. appears to be generating robust value creation with a very favorable moat supported by growing ROIC exceeding WACC. Despite a challenging leverage profile and mixed valuation metrics, its overall rating suggests a moderately attractive investment case in 2026.
Strength & Efficiency Pillars
Cencora, Inc. demonstrates solid profitability with a return on equity of 103.06% and a return on invested capital (ROIC) of 13.41%, comfortably exceeding its weighted average cost of capital (WACC) at 6.73%. This confirms the company as a clear value creator. Its Altman Z-Score of 4.87 places it well within the safe zone, highlighting strong financial health. The Piotroski score of 5 indicates average but stable fundamentals, supported by favorable operating metrics like an interest coverage ratio of 6.38 and a robust asset turnover of 4.2.
Weaknesses and Drawbacks
Despite fundamental strengths, valuation metrics raise caution. The price-to-earnings ratio stands at a lofty 38.98, suggesting a premium valuation that may limit upside. The price-to-book ratio is an extreme 40.17, further emphasizing market exuberance. Leverage is a significant concern with a debt-to-equity ratio of 5.08 and weak liquidity ratios—current ratio at 0.9 and quick ratio at 0.55—both below the prudent threshold. Recent market behavior shows slight seller dominance with buyers at 46.87%, signaling short-term pressure.
Our Verdict about Cencora, Inc.
Cencora’s long-term fundamentals are favorable, anchored by value creation and financial safety. However, the recent slight seller dominance and stretched valuation metrics suggest the stock might appear overextended near term. Despite the bullish overall trend, a cautious, wait-and-see approach may provide a better entry point for long-term investors seeking exposure in this sector.
Disclaimer: This content is for informational purposes only and does not constitute financial, investment, or other professional advice. Investing in financial markets involves a significant risk of loss, and past performance is not indicative of future results.
Additional Resources
- Cencora, Inc. (COR) Shares Slide as Revenue Miss Offsets Raised Operating Guidance – AlphaStreet (Feb 05, 2026)
- Decoding Cencora Inc (COR): A Strategic SWOT Insight – GuruFocus (Feb 05, 2026)
- COR Q4 Deep Dive: Specialty Expansion and OneOncology Drive Strategic Shifts – Finviz (Feb 05, 2026)
- Cencora (COR) Margin Stays Near 0.5% As High P/E Tests Bullish Growth Narratives – simplywall.st (Feb 05, 2026)
- Analysts lift ratings and price targets as Cencora, Inc. (COR)’s growth story gains momentum – MSN (Feb 02, 2026)
For more information about Cencora, Inc., please visit the official website: cencora.com