Home > Analyses > Technology > Celestica Inc.
Celestica Inc. powers the unseen backbone of modern technology through its advanced hardware and supply chain solutions. Its leadership in manufacturing complex electronics and systems integration fuels industries from aerospace to cloud computing. Renowned for innovation and precision, Celestica delivers critical components that shape global connectivity and infrastructure. As market dynamics evolve, I examine whether Celestica’s robust platform still supports its lofty valuation and growth ambitions.

Table of contents
Business Model & Company Overview
Celestica Inc., founded in 1994 and headquartered in Toronto, Canada, stands as a leading provider in the hardware, equipment, and parts sector. The company’s core mission unites advanced technology solutions with connectivity and cloud services into a seamless ecosystem. It supports diverse industries including aerospace, defense, healthtech, and energy, delivering complex manufacturing and supply chain capabilities that drive innovation across global markets.
Celestica’s revenue engine balances hardware manufacturing with extensive supply chain and after-market services. Its offerings span from design and engineering to logistics and repair, catering to clients in the Americas, Europe, and Asia. This diversified approach underpins its durable competitive advantage. With a broad product portfolio and global reach, Celestica commands a robust economic moat, shaping the future of hardware platform solutions worldwide.
Financial Performance & Fundamental Metrics
I will analyze Celestica Inc.’s income statement, key financial ratios, and dividend payout policy to assess its underlying financial health and shareholder returns.
Income Statement
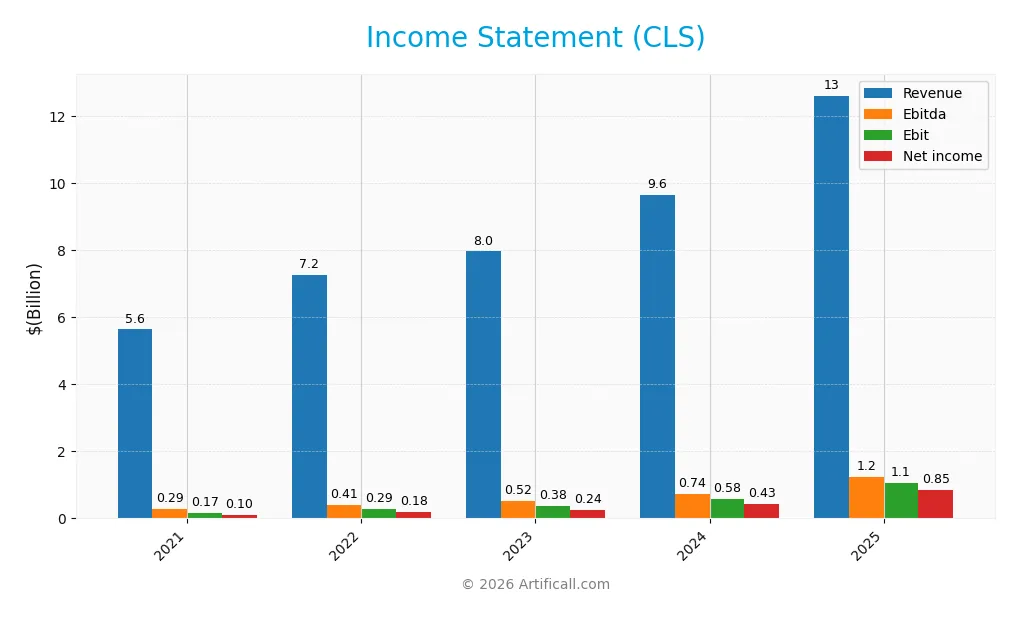
This table presents Celestica Inc.’s annual income statement from 2021 to 2025, highlighting key profitability and expense metrics in USD.
| 2021 | 2022 | 2023 | 2024 | 2025 | |
|---|---|---|---|---|---|
| Revenue | 5.63B | 7.25B | 7.96B | 9.65B | 12.61B |
| Cost of Revenue | 5.15B | 6.60B | 7.21B | 8.61B | 11.13B |
| Operating Expenses | 319M | 360M | 416M | 434M | 385M |
| Gross Profit | 487M | 650M | 754M | 1.03B | 1.47B |
| EBITDA | 294M | 407M | 516M | 736M | 1.23B |
| EBIT | 168M | 291M | 385M | 584M | 1.05B |
| Interest Expense | 31M | 52M | 79M | 52M | 54M |
| Net Income | 104M | 180M | 244M | 428M | 847M |
| EPS | 0.82 | 1.18 | 2.04 | 3.62 | 7.35 |
| Filing Date | 2022-03-14 | 2023-03-13 | 2024-03-11 | 2025-03-03 | 2026-02-27 |
Income Statement Evolution
Celestica’s revenue surged 124% from 2021 to 2025, reaching $12.6B in 2025. Net income expanded over sevenfold in the same period, hitting $847M. Margins show improvement: gross margin held steady at 11.7%, while net margin rose to 6.7%, reflecting better cost control despite rising expenses. Earnings per share nearly octupled.
Is the Income Statement Favorable?
In 2025, Celestica posted strong fundamentals: revenue grew 31% year-over-year, gross profit jumped 43%, and EBIT soared 80%. Operating expenses rose proportionally, preserving margin stability. Interest expense remained low at 0.42% of revenue, supporting net margin expansion to 6.7%. Overall, the income statement exhibits robust growth with favorable margin trends and efficient capital use.
Financial Ratios
The following table summarizes Celestica Inc.’s key financial ratios for the fiscal years 2021 through 2025, illustrating profitability, liquidity, leverage, and valuation metrics:
| Ratios | 2021 | 2022 | 2023 | 2024 | 2025 |
|---|---|---|---|---|---|
| Net Margin | 1.8% | 2.5% | 3.1% | 4.4% | 6.7% |
| ROE | 7.1% | 10.7% | 13.8% | 22.6% | 38.3% |
| ROIC | 5.2% | 8.3% | 9.9% | 16.1% | 28.0% |
| P/E | 13.6 | 7.7 | 14.4 | 25.5 | 40.2 |
| P/B | 1.0 | 0.8 | 2.0 | 5.7 | 15.4 |
| Current Ratio | 1.52 | 1.42 | 1.40 | 1.49 | 1.44 |
| Quick Ratio | 0.77 | 0.65 | 0.75 | 0.91 | 0.88 |
| D/E | 0.55 | 0.47 | 0.44 | 0.42 | 0.35 |
| Debt-to-Assets | 17.2% | 14.0% | 13.3% | 13.3% | 10.8% |
| Interest Coverage | 5.3x | 5.6x | 4.3x | 11.5x | 20.3x |
| Asset Turnover | 1.21 | 1.29 | 1.35 | 1.61 | 1.75 |
| Fixed Asset Turnover | 12.5 | 14.2 | 12.6 | 14.6 | 17.8 |
| Dividend Yield | 0% | 0% | 0% | 0% | 0% |
Evolution of Financial Ratios
From 2021 to 2025, Celestica Inc.’s Return on Equity (ROE) surged from 7.1% to 38.3%, indicating a marked improvement in profitability. The Current Ratio remained relatively stable, fluctuating between 1.4 and 1.52, reflecting consistent liquidity. Meanwhile, the Debt-to-Equity Ratio steadily declined from 0.55 to 0.35, signaling reduced financial leverage and improved capital structure.
Are the Financial Ratios Favorable?
In 2025, Celestica demonstrates strong profitability with a ROE of 38.3% and ROIC of 28%, both favorable against industry norms. Liquidity ratios like the Current Ratio (1.44) and Quick Ratio (0.88) are neutral, suggesting adequate short-term financial health. Debt ratios, including Debt-to-Equity (0.35) and Debt-to-Assets (10.8%), are favorable, indicating prudent leverage. However, valuation metrics such as P/E (40.2) and P/B (15.4) appear elevated, posing caution. Overall, the financial ratios present a slightly favorable profile with some valuation risks.
Shareholder Return Policy
Celestica Inc. does not pay dividends, reflecting a reinvestment strategy likely aimed at supporting growth or operational improvements. The company does not currently engage in share buybacks, maintaining a conservative capital allocation approach amid modest profitability.
This policy aligns with sustaining long-term shareholder value by prioritizing internal investments over cash distributions. However, investors should monitor free cash flow trends to assess if future returns could include dividends or buybacks as financial flexibility improves.
Score analysis
The following radar chart presents Celestica Inc.’s key financial scores across valuation, profitability, and leverage metrics:
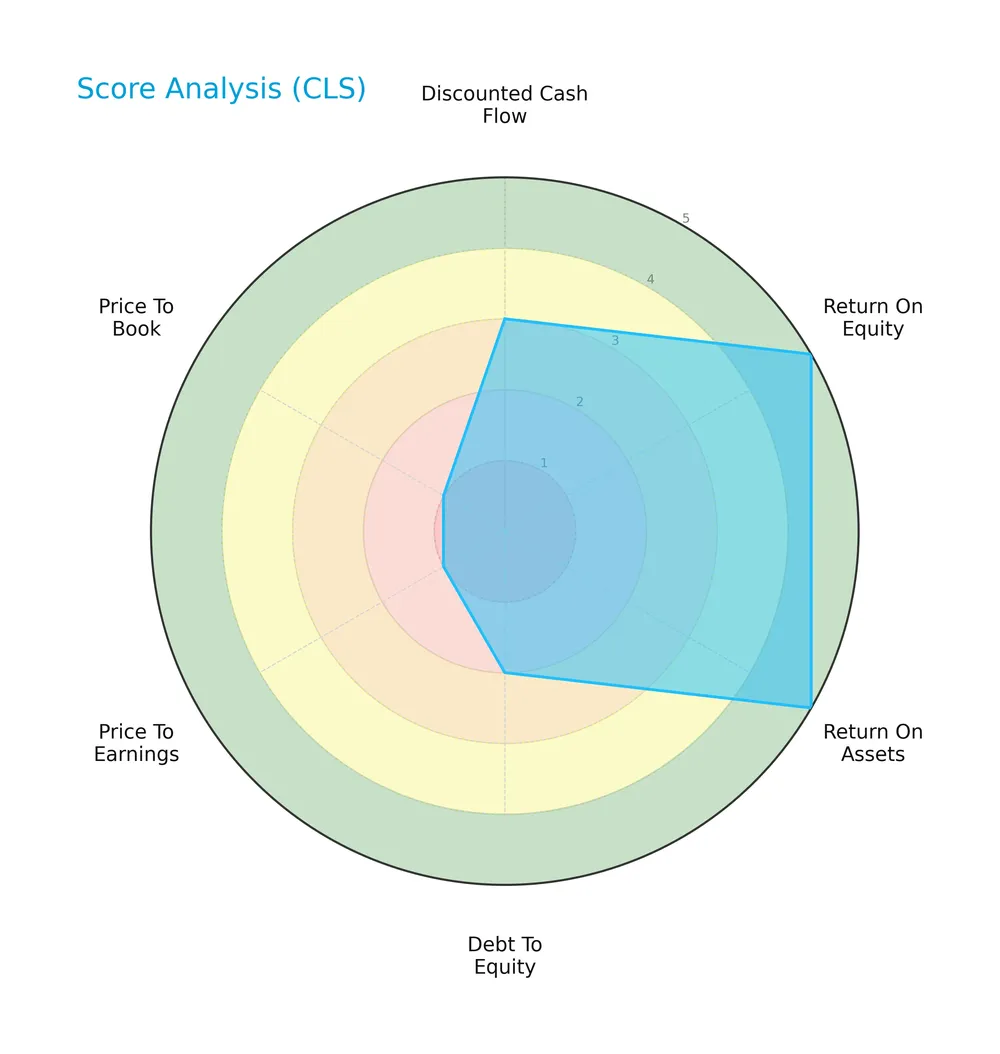
Celestica shows strong profitability with top scores of 5 in ROE and ROA. Its discounted cash flow score is moderate at 3. However, leverage and valuation scores lag, with debt-to-equity at 2, PE at 2, and PB at 1, signaling valuation concerns.
Analysis of the company’s bankruptcy risk
Celestica’s Altman Z-Score places it decisively in the safe zone, indicating very low bankruptcy risk:

Is the company in good financial health?
The Piotroski Score diagram below illustrates Celestica’s financial strength based on nine key criteria:

With a Piotroski Score of 7 classified as strong, Celestica demonstrates solid financial health, reflecting effective profitability, liquidity, and operational efficiency.
Competitive Landscape & Sector Positioning
This sector analysis examines Celestica Inc.’s strategic positioning, revenue streams, key products, and main competitors. I will assess whether Celestica holds a sustainable competitive advantage within the technology hardware segment.
Strategic Positioning
Celestica Inc. operates a diversified product portfolio through two segments: Advanced Technology Solutions and Connectivity & Cloud Solutions. It serves multiple industries across North America, Europe, and Asia, reflecting a broad geographic and sectoral exposure within hardware and supply chain services.
Revenue by Segment
This pie chart illustrates Celestica Inc.’s revenue distribution by segment for fiscal year 2025, highlighting the company’s primary business drivers over the period.
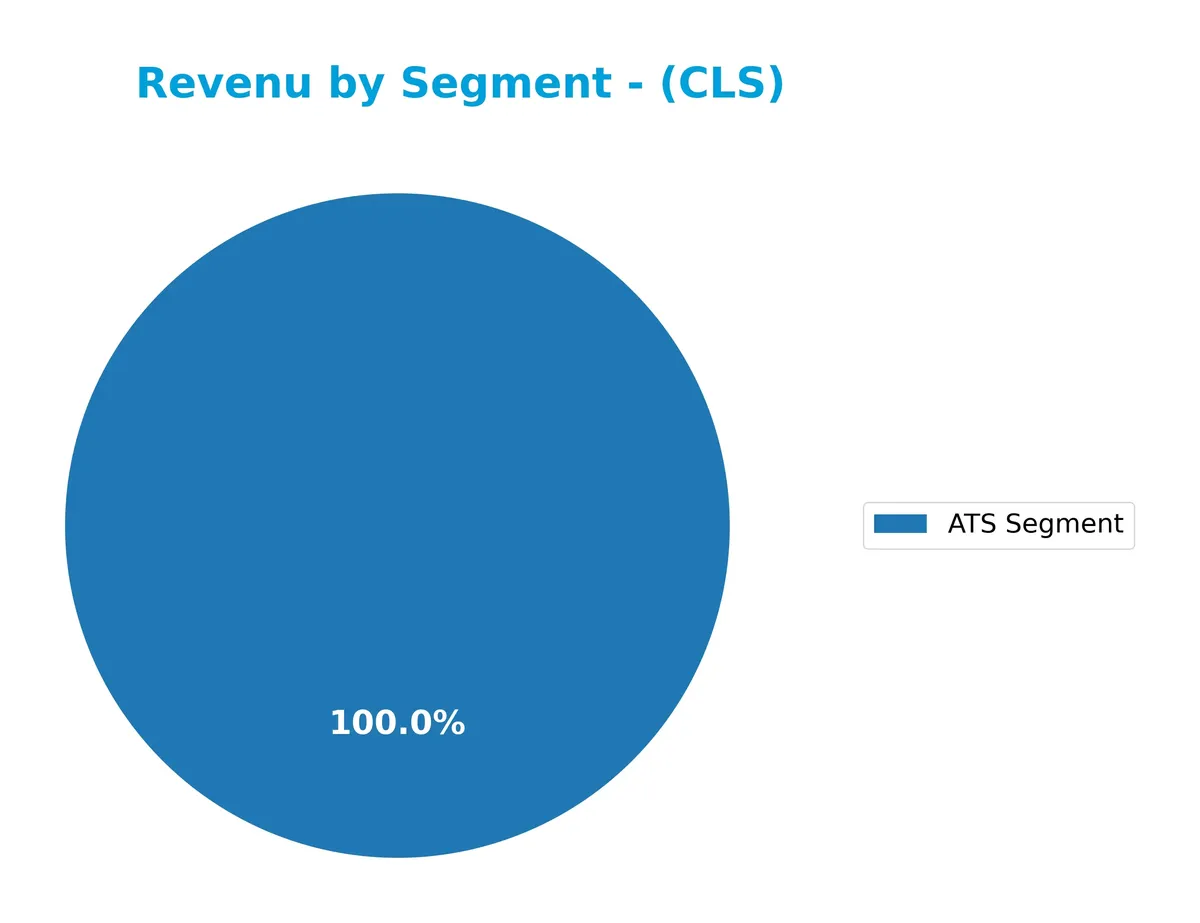
Celestica’s revenue concentrates entirely in the ATS Segment, generating 3.2B in 2025, up slightly from 3.16B in 2024. This steady growth underscores the segment’s dominance and the company’s reliance on it. Investors should note the high concentration risk, as no other segments contribute meaningfully to revenue, limiting diversification and exposing Celestica to sector-specific cycles.
Key Products & Brands
Celestica’s key products and brands span advanced technology and connectivity solutions in hardware manufacturing and supply chain services:
| Product | Description |
|---|---|
| Advanced Technology Solutions (ATS) | Includes design, engineering, manufacturing, testing, and assembly of complex electronic and mechanical components and systems. |
| Connectivity & Cloud Solutions | Provides enterprise data communications products such as routers, switches, servers, storage, and cloud infrastructure components. |
| Supply Chain Services | Encompasses component sourcing, logistics, order fulfillment, asset management, and after-market repair and return services. |
| Electronic Components | Offers capacitors, microprocessors, resistors, memory modules, power inverters, energy storage products, and smart meters. |
| Industry Applications | Serves aerospace and defense, industrial, energy, healthtech, capital equipment, original equipment manufacturers, and cloud service providers. |
Celestica generates over $3.2B in ATS revenue, showing strong focus on advanced manufacturing and supply chain integration across diverse high-tech industries.
Main Competitors
The sector includes 20 competitors, with the table listing the top 10 leaders by market capitalization:
| Competitor | Market Cap. |
|---|---|
| Amphenol Corporation | 171B |
| Corning Incorporated | 77.7B |
| TE Connectivity Ltd. | 68.6B |
| Sandisk Corporation | 40.0B |
| Garmin Ltd. | 38.9B |
| Keysight Technologies, Inc. | 35.5B |
| Celestica Inc. | 34.0B |
| Coherent, Inc. | 28.7B |
| Jabil Inc. | 25.7B |
| Teledyne Technologies Incorporated | 24.4B |
Celestica ranks 7th among its peers with a market cap at 18.7% of the leader, Amphenol Corporation. It stands below the average top 10 market cap of 54.4B but above the sector median of 21.6B. The company leads its nearest competitor by 11.14%, showing a moderate gap in scale.
Comparisons with competitors
Check out how we compare the company to its competitors:
Does Celestica have a competitive advantage?
Celestica displays a clear competitive advantage, evidenced by a very favorable economic moat. Its ROIC surpasses WACC by over 17.5%, signaling strong value creation and efficient capital use.
Looking ahead, Celestica’s diverse hardware and supply chain solutions position it well to capture growth in cloud, aerospace, and healthtech markets. Expansion in advanced technology and connectivity segments offers promising future opportunities.
SWOT Analysis
This SWOT analysis highlights Celestica Inc.’s strategic positioning and financial health to guide investment decisions.
Strengths
- strong ROIC well above WACC
- robust revenue and net income growth
- diversified technology and supply chain services
Weaknesses
- high valuation multiples (PE, PB)
- moderate liquidity ratios
- no dividend yield
Opportunities
- expanding cloud and connectivity markets
- increasing demand for advanced manufacturing
- potential for margin improvement
Threats
- intense competition in hardware sector
- supply chain disruptions
- macroeconomic volatility affecting tech spending
Celestica’s strong profitability and growth momentum underpin a sustainable competitive advantage. However, elevated valuation and liquidity caution require disciplined capital allocation. The company should leverage growth in cloud and industrial tech while mitigating supply chain and market risks.
Stock Price Action Analysis
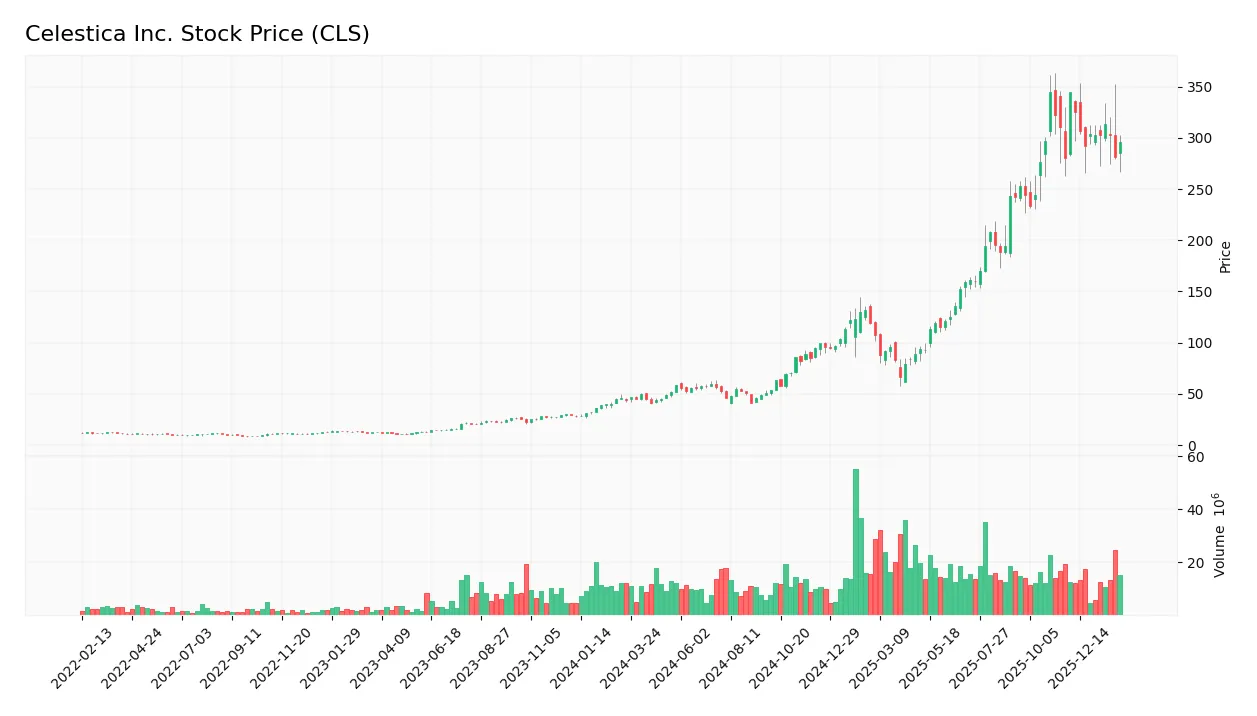
The weekly stock chart of Celestica Inc. (CLS) reveals significant price movements and volatility over the analyzed periods:
Trend Analysis
Over the past 12 months, CLS stock gained 462.12%, indicating a strong bullish trend despite a deceleration phase. The price ranged from a low of 40.73 to a high of 344.48 with a high volatility level (std. dev. 95.7). Recent three-month data show a -9.42% decline with a mild negative slope (-1.83), signaling a short-term bearish trend.
Volume Analysis
Trading volume for CLS is increasing overall, with buyers accounting for 63.21% of total activity historically. However, in the last three months, seller volume dominated at 72.22%, reflecting a seller-driven market. This shift suggests weakening investor confidence and rising market caution during the recent period.
Target Prices
Analysts present a clear target consensus for Celestica Inc., indicating moderate upside potential.
| Target Low | Target High | Consensus |
|---|---|---|
| 300 | 440 | 365.6 |
The range reflects analyst expectations between 300 and 440, with a consensus price near 366, suggesting cautious optimism about Celestica’s near-term prospects.

Don’t Let Luck Decide Your Entry Point
Optimize your entry points with our advanced ProRealTime indicators. You’ll get efficient buy signals with precise price targets for maximum performance. Start outperforming now!
Analyst & Consumer Opinions
This section examines Celestica Inc.’s recent analyst grades and consumer feedback to provide a comprehensive market perspective.
Stock Grades
Here are the latest verified stock grades from leading financial institutions for Celestica Inc.:
| Grading Company | Action | New Grade | Date |
|---|---|---|---|
| Citigroup | Maintain | Buy | 2026-01-30 |
| Barclays | Maintain | Overweight | 2026-01-30 |
| Goldman Sachs | Maintain | Buy | 2025-12-01 |
| Barclays | Maintain | Overweight | 2025-11-14 |
| Citigroup | Upgrade | Buy | 2025-11-10 |
| Stifel | Maintain | Buy | 2025-10-29 |
| Barclays | Maintain | Overweight | 2025-10-29 |
| UBS | Maintain | Neutral | 2025-10-29 |
| Goldman Sachs | Maintain | Buy | 2025-10-29 |
| TD Securities | Maintain | Hold | 2025-10-29 |
The consensus reflects a generally positive outlook with a majority of buy and overweight ratings. Grade stability suggests confidence in Celestica’s current positioning, though a few hold and neutral grades signal cautious views.
Consumer Opinions
Celestica Inc. draws mixed reactions from its customers, reflecting both its operational strengths and areas needing improvement.
| Positive Reviews | Negative Reviews |
|---|---|
| Reliable supply chain management | Occasional delays in product delivery |
| Strong technical support and service | Customer service response times can lag |
| High-quality manufacturing standards | Pricing is perceived as slightly above average |
| Flexible customization options | Limited transparency on order status updates |
Overall, consumers praise Celestica’s quality and technical support, but recurring complaints about delivery delays and customer service responsiveness suggest room for operational refinement.
Risk Analysis
Below is a summary table outlining key risks Celestica Inc. faces, highlighting their likelihood and potential impact:
| Category | Description | Probability | Impact |
|---|---|---|---|
| Valuation Risk | High P/E (40.24) and P/B (15.41) ratios suggest overvaluation | High | High |
| Market Volatility | Beta of 1.505 indicates above-average stock price swings | High | Medium |
| Liquidity Risk | Quick ratio at 0.88 signals potential short-term liquidity constraints | Medium | Medium |
| Debt Risk | Despite low debt levels, unfavorable debt-to-equity score (2) signals caution | Medium | Medium |
| Dividend Policy | No dividend yield may deter income-focused investors | High | Low |
| Industry Cyclicality | Exposure to hardware and supply chain sectors prone to cycles | Medium | High |
Celestica’s most significant risks stem from its stretched valuation multiples and elevated stock volatility. The firm’s P/E and P/B ratios far exceed technology sector averages, raising concerns about pricing sustainability. Meanwhile, a beta above 1.5 reflects sensitivity to market swings, amplifying downside risks during downturns. Liquidity metrics are moderate but warrant monitoring. The company remains financially stable with a strong Altman Z-score (6.33) and solid Piotroski score (7), reducing bankruptcy concerns. However, investors must weigh valuation and market risks carefully in their portfolio decisions.
Should You Buy Celestica Inc.?
Celestica Inc. appears to be building strong value creation with a durable competitive moat and improving operational efficiency. Despite some concerns over valuation metrics, its manageable leverage profile supports a very favorable B+ rating, suggesting a balanced investment profile.
Strength & Efficiency Pillars
Celestica Inc. delivers robust operational efficiency with a net margin of 6.72% and a strong return on equity of 38.29%. The company’s return on invested capital (ROIC) stands at 28.0%, significantly exceeding its weighted average cost of capital (WACC) at 10.49%. This clear value creation underscores Celestica’s sustainable competitive advantage. Its growing ROIC trend confirms improving profitability, supported by efficient asset turnover metrics, signaling effective capital allocation and solid operational management.
Weaknesses and Drawbacks
Celestica’s valuation metrics raise caution. The price-to-earnings ratio at 40.24 and price-to-book ratio at 15.41 indicate a stretched premium valuation relative to industry norms. While leverage ratios appear favorable with a debt-to-equity of 0.35, the company lacks dividend yield, which may deter income-focused investors. Recent market behavior shows seller dominance with buyer volume at only 27.78%, reflecting short-term selling pressure that could limit near-term upside despite long-term fundamentals.
Our Final Verdict about Celestica Inc.
Celestica’s fundamental profile appears attractive for long-term exposure, supported by strong profitability and clear value creation. However, despite the bullish long-term trend, recent seller dominance suggests investors might adopt a wait-and-see stance for a more favorable entry point. The premium valuation demands caution, but the company’s operational strength and financial health provide a solid foundation for potential growth.
Disclaimer: This content is for informational purposes only and does not constitute financial, investment, or other professional advice. Investing in financial markets involves a significant risk of loss, and past performance is not indicative of future results.
Additional Resources
- Citigroup Inc. Lowers Holdings in Celestica, Inc. $CLS – MarketBeat (Feb 28, 2026)
- Decoding Celestica Inc (CLS): A Strategic SWOT Insight – GuruFocus (Feb 28, 2026)
- Why Is Celestica (CLS) Down 7% Since Last Earnings Report? – Yahoo Finance (Feb 27, 2026)
- CELESTICA INC SEC 10-K Report – TradingView (Feb 27, 2026)
- Celestica (CLS) is an Incredible Growth Stock: 3 Reasons Why – Yahoo Finance (Feb 23, 2026)
For more information about Celestica Inc., please visit the official website: celestica.com