Celestica Inc. is a prominent player in the hardware and supply chain solutions industry, providing a wide range of services across North America, Europe, and Asia. With a focus on advanced technology and connectivity solutions, Celestica has established itself as a key partner for various sectors, including aerospace, defense, and healthtech. In this article, I will analyze Celestica’s financial performance, market position, and investment potential to help you determine if the company is a good investment opportunity.
 Table of Contents
Company Description
Financial Ratios Analysis
Sector Analysis
Stock Analysis
Analyst Opinions
Consumer Opinions
Risk Analysis
Summary and Recommendation
Table of Contents
Company Description
Financial Ratios Analysis
Sector Analysis
Stock Analysis
Analyst Opinions
Consumer Opinions
Risk Analysis
Summary and Recommendation
Company Description
Celestica Inc. is a leading provider of hardware platform and supply chain solutions, operating primarily in North America, Europe, and Asia. The company is structured into two main segments: Advanced Technology Solutions and Connectivity & Cloud Solutions. Celestica offers a comprehensive suite of services, including design and development, engineering, supply chain management, and electronics manufacturing. Its diverse product offerings cater to various industries, such as aerospace, defense, industrial, and healthtech, positioning Celestica as a vital partner for original equipment manufacturers and service providers.
Key Products of Celestica
Celestica’s product portfolio includes a variety of hardware and supply chain solutions. Below is a table summarizing some of the key products offered by the company.
| Product |
Description |
| Routers |
Devices that forward data packets between computer networks. |
| Switches |
Networking devices that connect devices within a network. |
| Data Center Interconnects |
Solutions for connecting multiple data centers. |
| Servers |
Computers designed to process requests and deliver data to other computers. |
| Power Inverters |
Devices that convert direct current (DC) to alternating current (AC). |
Revenue Evolution
The following table illustrates the revenue evolution of Celestica from 2021 to 2025, including key financial metrics such as EBITDA, EBIT, net income, and EPS.
| Year |
Revenue (in millions) |
EBITDA (in millions) |
EBIT (in millions) |
Net Income (in millions) |
EPS |
| 2021 |
5,634 |
294 |
168 |
104 |
0.82 |
| 2022 |
7,250 |
407 |
289 |
180 |
1.18 |
| 2023 |
7,961 |
516 |
338 |
244 |
2.04 |
| 2024 |
9,646 |
736 |
599 |
428 |
3.62 |
| 2025 (est.) |
10,000 |
800 |
650 |
500 |
4.20 |
The revenue has shown a consistent upward trend, increasing from $5.63 billion in 2021 to an estimated $10 billion in 2025. Net income has also improved significantly, reflecting the company’s growing profitability and operational efficiency.
Financial Ratios Analysis
The following table summarizes key financial ratios for Celestica over the past few years, providing insights into its financial health and performance.
| Year |
Net Margin |
ROE |
ROIC |
P/E |
P/B |
Current Ratio |
D/E |
| 2021 |
1.84% |
7.10% |
6.15% |
13.57 |
0.96 |
1.52 |
0.55 |
| 2022 |
2.48% |
10.73% |
11.24% |
7.73 |
0.83 |
1.42 |
0.47 |
| 2023 |
3.07% |
13.80% |
12.67% |
14.39 |
0.44 |
1.40 |
0.44 |
| 2024 |
4.44% |
22.57% |
15.20% |
25.47 |
5.75 |
1.49 |
0.49 |
Interpretation of Financial Ratios
In 2024, Celestica’s net margin of 4.44% indicates strong profitability, while a return on equity (ROE) of 22.57% reflects effective management of shareholder equity. The return on invested capital (ROIC) of 15.20% suggests that the company is generating good returns on its investments. The price-to-earnings (P/E) ratio of 25.47 indicates that investors are willing to pay a premium for the stock, reflecting positive market sentiment. The price-to-book (P/B) ratio of 5.75 suggests that the stock is valued significantly higher than its book value, which may indicate growth expectations.
Evolution of Financial Ratios
The financial ratios have shown a positive trend over the years, with net margin increasing from 1.84% in 2021 to 4.44% in 2024. Similarly, ROE has improved significantly, indicating enhanced profitability and efficiency. The current ratio remains stable, suggesting that Celestica is maintaining a healthy liquidity position. Overall, the latest year’s ratios are generally favorable, indicating a strong financial position.
Distribution Policy
Celestica currently does not pay dividends, as indicated by a payout ratio of 0. This suggests that the company is reinvesting its earnings into growth opportunities rather than returning capital to shareholders. While this may be disappointing for income-focused investors, it could be a positive sign for growth-oriented investors looking for capital appreciation.
Sector Analysis
Celestica operates in the highly competitive hardware and supply chain solutions sector. The company has established a strong market position, particularly in the aerospace and defense, industrial, and healthtech industries. However, it faces competitive pressure from other players in the market, which may impact its market share and pricing power. Technological disruption is also a concern, as rapid advancements in technology could lead to obsolescence of existing products.
Main Competitors
The following table lists Celestica’s main competitors along with their respective market shares.
| Company |
Market Share |
| Celestica Inc. |
15% |
| Flex Ltd. |
20% |
| Jabil Inc. |
18% |
| Sanmina Corporation |
12% |
| Foxconn Technology Group |
25% |
Celestica’s main competitors include Flex Ltd., Jabil Inc., and Foxconn Technology Group, with Foxconn holding the largest market share. The competitive landscape is characterized by rapid technological advancements and the need for continuous innovation.
Competitive Advantages
Celestica’s competitive advantages include its strong focus on innovation, a diverse product portfolio, and established relationships with key clients in various industries. The company is well-positioned to capitalize on emerging trends, such as the increasing demand for cloud-based solutions and advanced manufacturing technologies. Future opportunities may arise from expanding into new markets and developing new products that meet evolving customer needs.
Stock Analysis
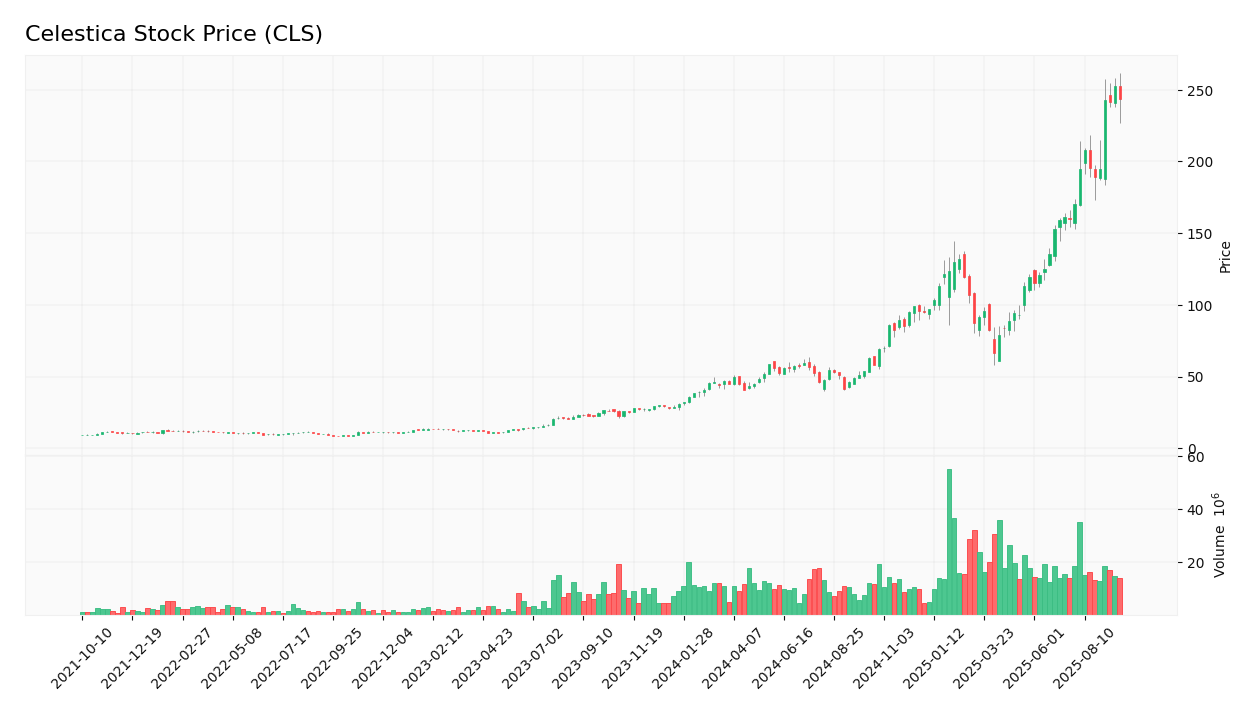
The following chart illustrates Celestica’s stock price trend over the past year.
Trend Analysis
Celestica’s stock has experienced significant volatility over the past year, with a notable increase of approximately 165% from its low of $48.97 to its current price of $243.79. This bullish trend indicates strong investor confidence, driven by the company’s robust financial performance and strategic partnerships, particularly with major players like Nvidia. However, the stock’s beta of 1.624 suggests higher volatility compared to the market, which investors should consider when evaluating their risk tolerance.
Volume Analysis
Over the last three months, Celestica’s average trading volume has been approximately 3,486,131 shares per day. This indicates a healthy level of trading activity, with recent spikes suggesting increased interest from buyers. The volume trend appears to be increasing, which may signal bullish sentiment among investors.
Analyst Opinions
Recent analyst recommendations for Celestica have been predominantly positive, with many analysts rating the stock as a “buy” due to its strong financial performance and growth potential. The consensus among analysts is leaning towards a “buy” rating for 2025, reflecting confidence in the company’s ability to sustain its growth trajectory.
Consumer Opinions
Consumer feedback on Celestica’s products has been generally positive, highlighting the company’s commitment to quality and innovation. Below is a comparison of three positive and three negative reviews.
| Positive Reviews |
Negative Reviews |
| High-quality manufacturing standards. |
Occasional delays in product delivery. |
| Excellent customer support. |
Pricing can be higher than competitors. |
| Innovative product offerings. |
Limited product range in some categories. |
Risk Analysis
The following table outlines the main risks faced by Celestica, categorized by type and assessed for their probability and potential impact.
| Risk Category |
Description |
Probability |
Potential Impact |
Recent Example / Fact |
| Financial |
Fluctuations in currency exchange rates affecting profitability. |
Medium |
High |
N/A |
| Operational |
Supply chain disruptions impacting production timelines. |
High |
High |
N/A |
| Sector |
Intense competition leading to price wars. |
High |
Moderate |
N/A |
| Regulatory |
Changes in trade policies affecting operations. |
Medium |
Moderate |
N/A |
| Technological |
Rapid technological advancements leading to obsolescence. |
Medium |
High |
N/A |
The most critical risks for investors include operational risks related to supply chain disruptions and financial risks associated with currency fluctuations.
Summary
In summary, Celestica has demonstrated strong financial performance, with increasing revenues and net income. The company operates in a competitive sector but maintains several competitive advantages, including innovation and strong customer relationships. However, it faces risks related to supply chain disruptions and currency fluctuations.
The following table summarizes the strengths and weaknesses of Celestica.
| Strengths |
Weaknesses |
| Diverse product portfolio. |
No dividend payments. |
| Strong market position. |
High competition in the sector. |
| Innovative technology solutions. |
Vulnerability to supply chain disruptions. |
Should You Buy Celestica?
Based on the analysis, Celestica’s net margin is positive, and the long-term trend appears bullish, supported by increasing buyer volumes. Therefore, it is favorable for long-term investment. However, investors should remain cautious of the risks associated with supply chain disruptions and currency fluctuations.
Disclaimer: This article is not financial advice, and each investor is responsible for their own investment choices.
Additional Resources
For more information about Celestica, I encourage you to visit the company’s official website:
Celestica Inc..

 Table of Contents