Home > Analyses > Technology > CDW Corporation
CDW Corporation powers the backbone of modern business technology, seamlessly connecting enterprises to the tools they need every day. As a top player in IT solutions, CDW leads with a diverse portfolio spanning hardware, software, and integrated cloud services. Renowned for blending innovation with reliability, it fuels digital transformation across government, healthcare, and corporate sectors. The pressing question now is whether CDW’s solid fundamentals justify its current valuation and growth prospects in a rapidly evolving tech landscape.

Table of contents
Business Model & Company Overview
CDW Corporation, founded in 1984 and headquartered in Vernon Hills, Illinois, stands as a leader in information technology services. It delivers a cohesive ecosystem of IT solutions spanning hardware, software, and integrated services. Serving diverse sectors, including government, education, and healthcare, CDW operates through Corporate, Small Business, and Public segments, ensuring tailored solutions across scales.
The company’s revenue engine balances discrete hardware sales—ranging from notebooks to enterprise storage—with software offerings like security and virtualization suites. Its advisory, implementation, and managed services complement these, creating recurring streams. CDW’s strategic footprint covers the US, UK, and Canada, solidifying its competitive advantage through deep customer integration and broad market coverage. This positions CDW as a pivotal driver shaping the future of IT infrastructure.
Financial Performance & Fundamental Metrics
I analyze CDW Corporation’s income statement, key financial ratios, and dividend payout policy to assess its profitability, efficiency, and shareholder returns.
Income Statement
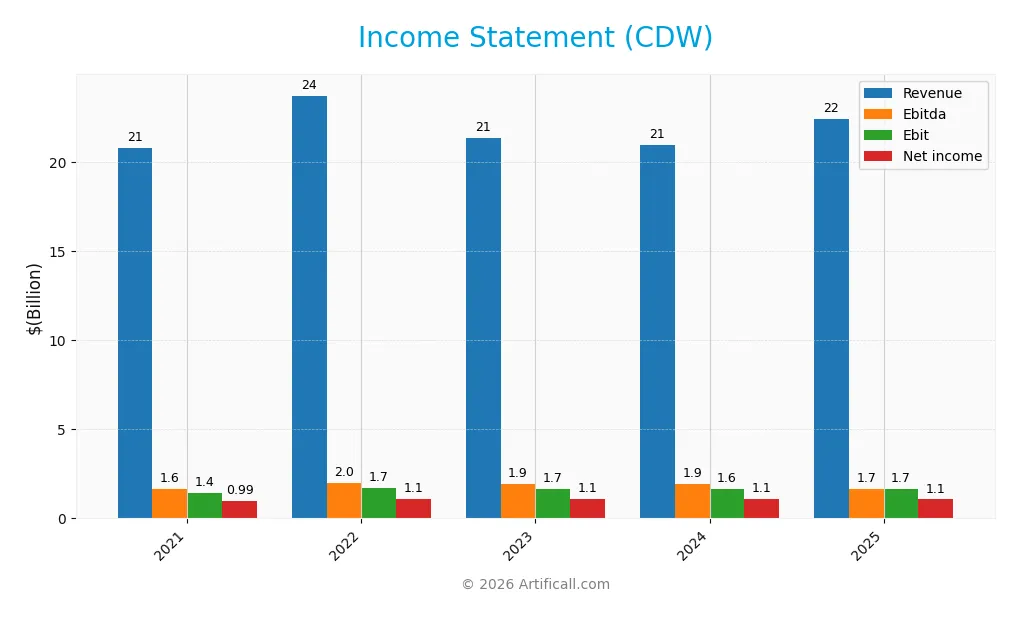
The table below summarizes CDW Corporation’s key income statement figures for fiscal years 2021 through 2025, highlighting revenue, expenses, and profitability metrics.
| 2021 | 2022 | 2023 | 2024 | 2025 | |
|---|---|---|---|---|---|
| Revenue | 20.8B | 23.7B | 21.4B | 21.0B | 22.4B |
| Cost of Revenue | 17.3B | 19.1B | 16.7B | 16.4B | 17.6B |
| Operating Expenses | 2.1B | 3.0B | 3.0B | 3.0B | 3.2B |
| Gross Profit | 3.6B | 4.7B | 4.7B | 4.6B | 4.9B |
| EBITDA | 1.6B | 2.0B | 1.9B | 1.9B | 1.7B |
| EBIT | 1.4B | 1.7B | 1.7B | 1.6B | 1.7B |
| Interest Expense | 151M | 236M | 227M | 215M | 227M |
| Net Income | 989M | 1.1B | 1.1B | 1.1B | 1.1B |
| EPS | 7.14 | 8.24 | 8.20 | 8.06 | 8.13 |
| Filing Date | 2022-02-28 | 2023-02-24 | 2024-02-26 | 2025-02-21 | 2026-02-20 |
Income Statement Evolution
CDW’s revenue grew modestly by 6.8% from 2024 to 2025, continuing a neutral growth trend over five years. Gross profit increased by 5.9%, supporting a stable gross margin near 21.7%. However, operating expenses rose proportionally, limiting EBIT growth to just 0.35%, with net margin contracting slightly, reflecting margin pressures despite higher top-line figures.
Is the Income Statement Favorable?
In 2025, CDW reported a net income of 1.07B with a net margin of 4.76%, indicating stable profitability. Interest expenses remained low at about 1% of revenue, favorably supporting earnings. Yet, the slight net margin decline and operating expense growth suggest cost control challenges. Overall, fundamentals appear neutral, with strengths tempered by margin pressures and modest profit growth.
Financial Ratios
The table below presents key financial ratios for CDW Corporation over recent fiscal years, illustrating profitability, liquidity, leverage, and market valuation metrics:
| Ratios | 2021 | 2022 | 2023 | 2024 | 2025 |
|---|---|---|---|---|---|
| Net Margin | 4.75% | 4.69% | 5.17% | 5.13% | 4.76% |
| ROE | 140.09% | 69.51% | 54.07% | 45.81% | 40.93% |
| ROIC | 12.69% | 15.77% | 15.14% | 13.13% | 12.17% |
| P/E | 28.69 | 21.66 | 27.71 | 21.61 | 16.77 |
| P/B | 40.19 | 15.06 | 14.98 | 9.90 | 6.86 |
| Current Ratio | 1.27 | 1.33 | 1.23 | 1.35 | 1.18 |
| Quick Ratio | 1.09 | 1.17 | 1.11 | 1.24 | 1.10 |
| D/E | 10.42 | 3.80 | 2.84 | 2.55 | 2.42 |
| Debt-to-Assets | 55.71% | 46.44% | 43.73% | 40.82% | 39.29% |
| Interest Coverage | 9.40 | 7.36 | 7.42 | 7.70 | 7.28 |
| Asset Turnover | 1.58 | 1.81 | 1.61 | 1.43 | 1.40 |
| Fixed Asset Turnover | 59.25 | 70.26 | 65.91 | 67.26 | 72.76 |
| Dividend Yield | 0.83% | 1.17% | 1.05% | 1.43% | 1.84% |
Evolution of Financial Ratios
Over the period, CDW’s Return on Equity (ROE) showed strong improvement, peaking above 40% in 2025. The Current Ratio remained relatively stable around 1.2, indicating consistent liquidity. However, the Debt-to-Equity ratio declined from an elevated level above 10 in 2021 to 2.42 in 2025, reflecting a significant deleveraging trend. Profitability margins experienced slight fluctuations but stayed within a narrow range.
Are the Financial Ratios Favorable?
In 2025, CDW’s profitability ratios were mixed: ROE and Return on Invested Capital (ROIC) were favorable, while its net profit margin was unfavorable. Liquidity ratios were neutral to favorable, with a current ratio near 1.18 and a quick ratio above 1. The leverage remains a concern, as the debt-to-equity ratio is still unfavorable at 2.42. Market valuation metrics such as price-to-book ratio are unfavorable, but price-to-earnings is neutral. Overall, the financial ratios skew slightly favorable with balanced risks.
Shareholder Return Policy
CDW Corporation maintains a steady dividend payout ratio near 30%, with dividend per share rising from $1.70 in 2021 to $2.51 in 2025. The annual dividend yield hovers around 1.8%, supported by robust free cash flow coverage and complemented by ongoing share buybacks.
This distribution approach balances income to shareholders with capital retention. The consistent payout and buyback activity, backed by free cash flow, suggest a sustainable policy aligned with long-term value creation, though leverage levels warrant monitoring for financial flexibility risks.
Score analysis
Here is a summary of CDW Corporation’s key financial scores based on valuation, profitability, and leverage metrics:
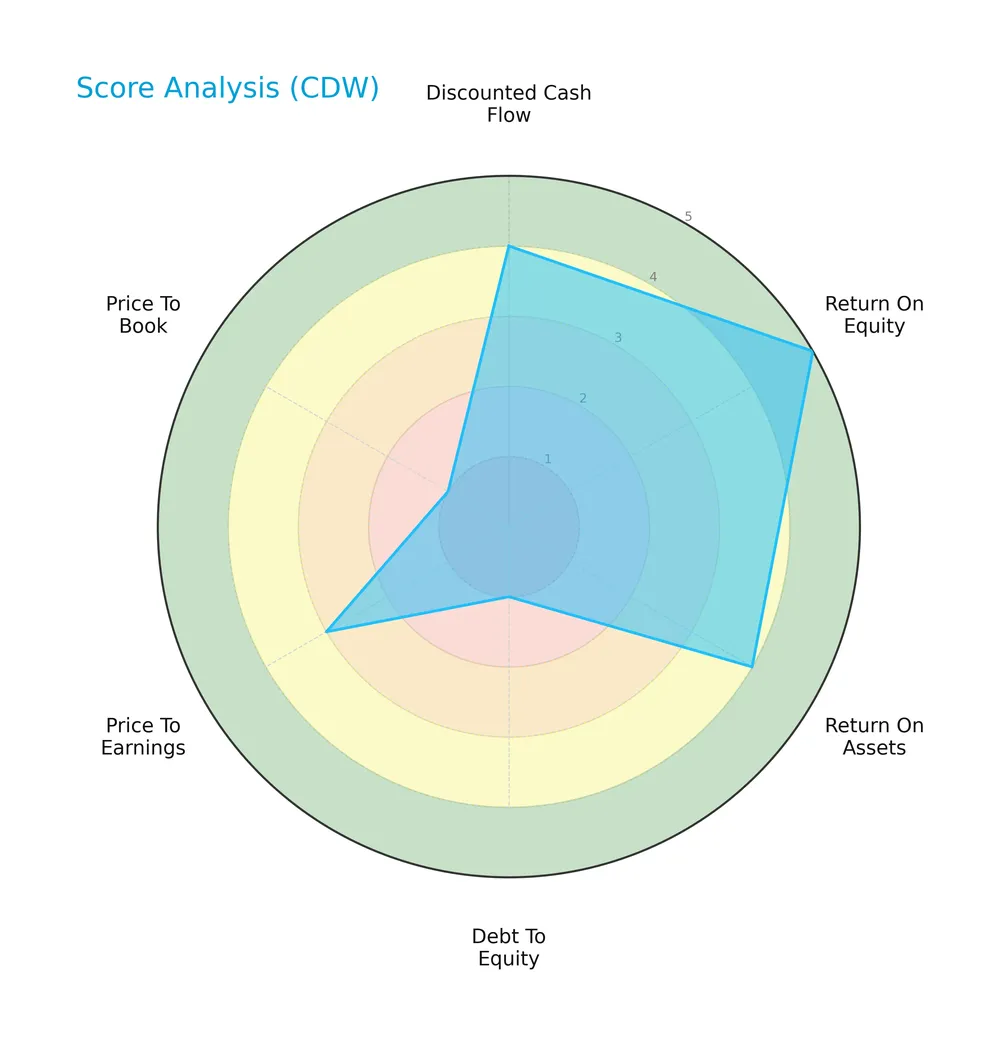
CDW’s discounted cash flow and profitability scores are favorable to very favorable, indicating solid earnings efficiency. However, debt-to-equity and price-to-book scores are very unfavorable, pointing to leverage risks and potential valuation concerns. The overall score sits at a moderate level.
Analysis of the company’s bankruptcy risk
CDW’s Altman Z-Score places it in the grey zone, signaling a moderate risk of financial distress:

Is the company in good financial health?
The Piotroski Score diagram illustrates CDW’s financial strength based on profitability, leverage, and efficiency factors:
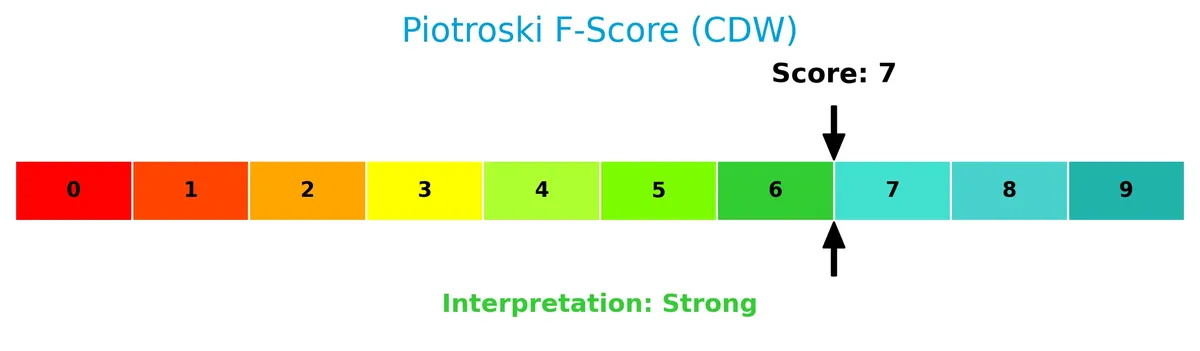
With a strong score of 7, CDW demonstrates solid financial health, reflecting effective management and operational stability despite some leverage concerns.
Competitive Landscape & Sector Positioning
This analysis examines CDW Corporation’s strategic positioning, revenue streams, key products, and main competitors. I will assess whether CDW holds a competitive advantage in the information technology services sector.
Strategic Positioning
CDW maintains a concentrated geographic focus, primarily serving the US with over 85% of 2025 revenues, supplemented by Canada and the UK. Its product mix is hardware-heavy, generating $16B in 2025, complemented by growing software ($4.2B) and services ($2B), reflecting integrated IT solutions across multiple customer segments.
Revenue by Segment
The pie chart illustrates CDW Corporation’s revenue distribution by segment for the fiscal year 2025, highlighting how hardware, software products, and services contribute to total sales.
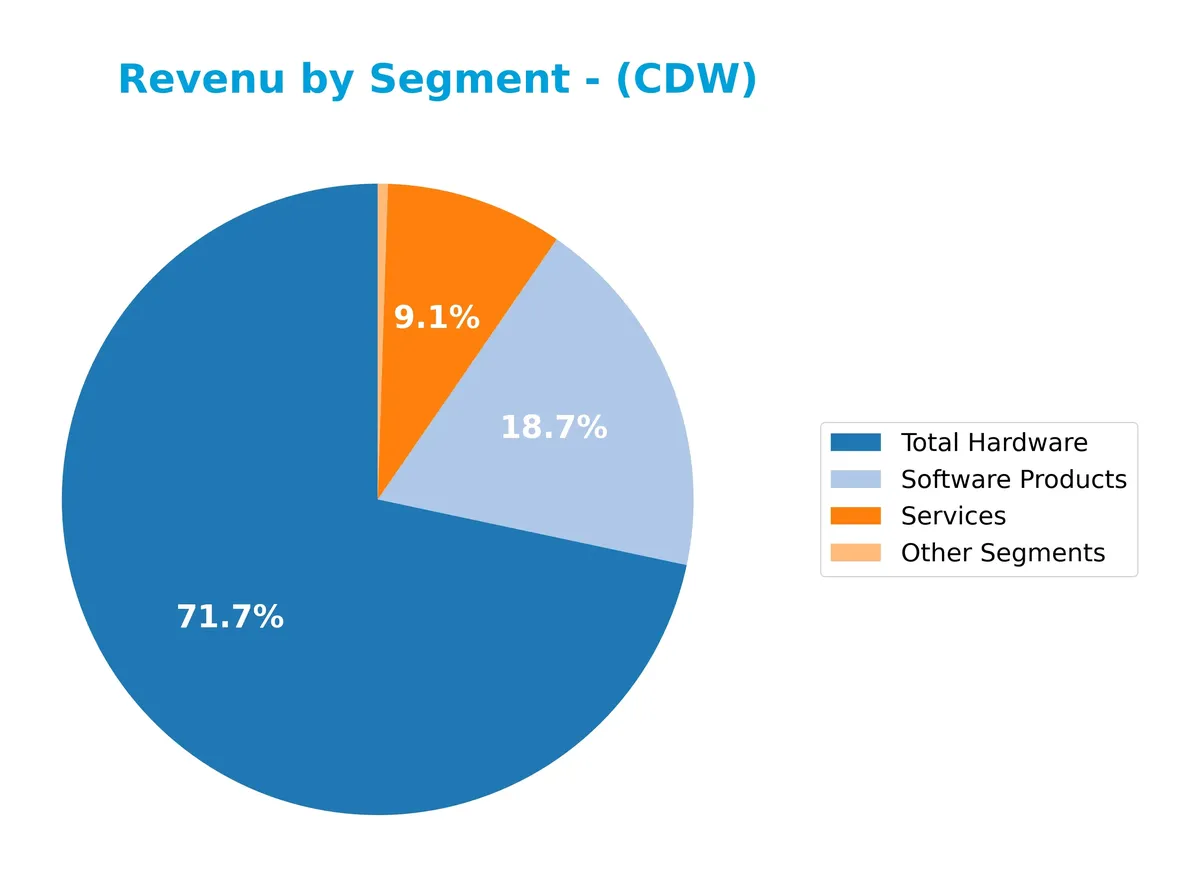
In 2025, Total Hardware dominates CDW’s revenue with $16.1B, reflecting its core business strength despite a slight decline from 2022’s peak. Software Products and Services follow with $4.2B and $2.0B, respectively, showing steady growth and diversification. Other Segments remain minor at $115M. The trend suggests hardware still drives revenue, but software and services steadily accelerate, reducing concentration risk.
Key Products & Brands
The table below details CDW Corporation’s main product categories and their descriptions:
| Product | Description |
|---|---|
| Total Hardware | Includes notebooks, mobile devices, desktops, network communications, video monitors, and storage. |
| Software Products | Covers application suites, security, virtualization, operating systems, and network management. |
| Services | Encompasses advisory, design, software development, implementation, managed, professional, and repair services. |
| Other Products and Services | Miscellaneous IT-related products and services beyond the core hardware, software, and service offerings. |
CDW’s revenue derives predominantly from hardware sales, supplemented by software products and a growing services segment. This diversified IT solutions portfolio caters across corporate, government, education, and healthcare sectors.
Main Competitors
There are 16 competitors in total, with the table below showing the top 10 leaders by market capitalization:
| Competitor | Market Cap. |
|---|---|
| International Business Machines Corporation | 272B |
| Accenture plc | 162B |
| Cognizant Technology Solutions Corporation | 40B |
| Fiserv, Inc. | 36B |
| Fidelity National Information Services, Inc. | 34B |
| Wipro Limited | 30B |
| Leidos Holdings, Inc. | 23B |
| Gartner, Inc. | 18B |
| CDW Corporation | 17B |
| Jack Henry & Associates, Inc. | 13B |
CDW Corporation ranks 9th among its peers, holding about 6% of the market cap of the leader, IBM. It trades below both the average market cap of the top 10 competitors (65B) and the median sector market cap (18B). CDW’s market cap is 12% less than its nearest competitor above, Gartner, highlighting a moderate gap in scale.
Comparisons with competitors
Check out how we compare the company to its competitors:
Does CDW have a competitive advantage?
CDW demonstrates a competitive advantage, creating value with a ROIC 5.18% above its WACC, indicating efficient capital use despite a declining profitability trend. Its 21.7% gross margin compares favorably within the IT services sector.
Looking ahead, CDW’s diversified IT solutions across hardware, software, and cloud services position it well for growth. Expansion in non-US markets and increased demand for hybrid and security solutions offer promising future opportunities.
SWOT Analysis
This SWOT analysis highlights CDW Corporation’s key internal and external factors shaping its competitive position.
Strengths
- strong ROE at 40.9%
- favorable ROIC above WACC
- diversified IT solutions across multiple segments
Weaknesses
- declining ROIC trend
- high debt-to-equity ratio 2.42
- net margin under 5%, signaling tight profitability
Opportunities
- expanding cloud and hybrid IT demand
- growth in non-US markets
- rising need for cybersecurity solutions
Threats
- intense competition in IT services
- margin pressure from rising opex
- economic slowdown affecting corporate IT spending
CDW’s strengths in capital efficiency and diversified solutions build a solid foundation. However, profitability pressures and leverage warrant caution. The firm must capitalize on cloud and security trends while managing margin risks to sustain growth.
Stock Price Action Analysis
The weekly stock price chart for CDW Corporation highlights its performance and key price levels over the last 12 months:
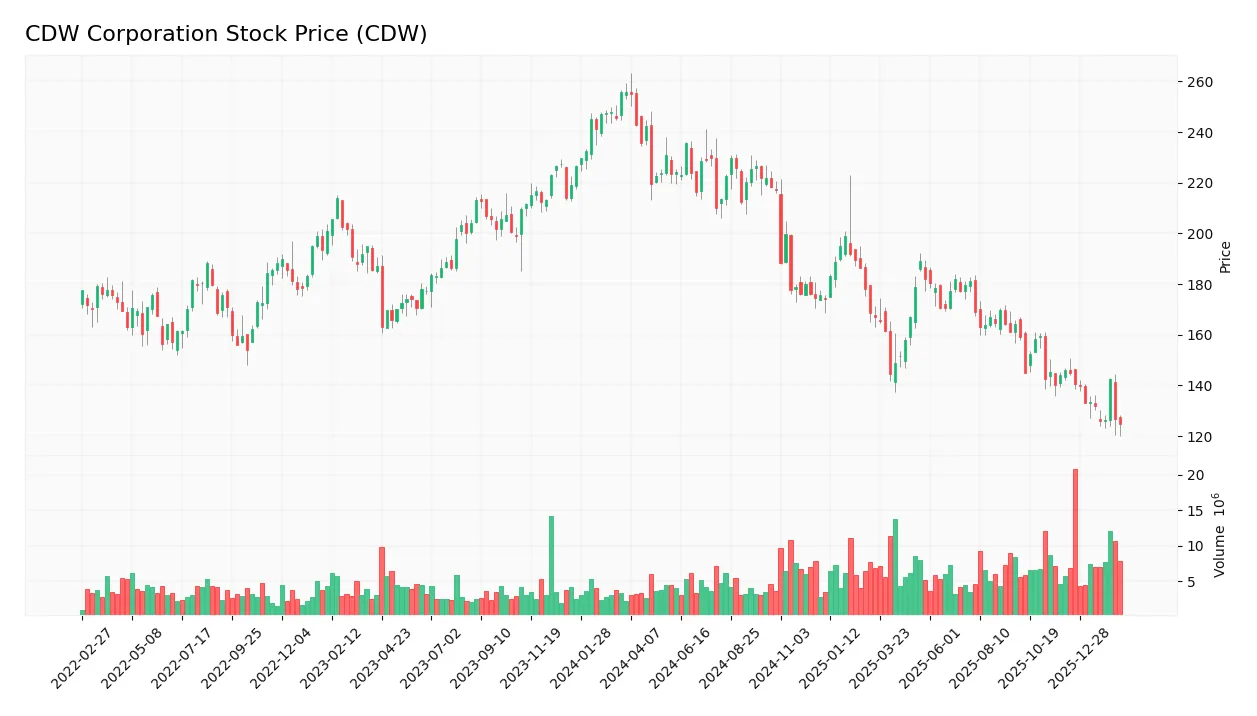
Trend Analysis
Over the past year, CDW’s stock price dropped sharply by 51.27%, signaling a clear bearish trend. The price fell from a high of 255.78 to a low of 124.64. Volatility is elevated with a standard deviation of 33.51. The downtrend shows deceleration, indicating some loss of selling momentum.
Volume Analysis
In the last three months, trading volume increased, but sellers dominated with 68.9M shares sold versus 32.96M bought, representing only 32.36% buyer participation. This seller-driven activity points to cautious or negative investor sentiment and persistent selling pressure.
Target Prices
Analysts present a solid target consensus for CDW Corporation, reflecting confident market expectations.
| Target Low | Target High | Consensus |
|---|---|---|
| 141 | 185 | 162.4 |
The target range suggests upside potential from current levels, with a consensus price indicating moderate growth confidence among analysts.

Don’t Let Luck Decide Your Entry Point
Optimize your entry points with our advanced ProRealTime indicators. You’ll get efficient buy signals with precise price targets for maximum performance. Start outperforming now!
Analyst & Consumer Opinions
This section examines CDW Corporation’s recent analyst ratings alongside key consumer feedback and satisfaction metrics.
Stock Grades
Here are the latest verified stock grades for CDW Corporation from leading financial institutions:
| Grading Company | Action | New Grade | Date |
|---|---|---|---|
| Barclays | Maintain | Equal Weight | 2026-02-05 |
| Morgan Stanley | Maintain | Equal Weight | 2026-02-05 |
| Citigroup | Maintain | Neutral | 2026-02-05 |
| UBS | Maintain | Buy | 2026-02-05 |
| JP Morgan | Maintain | Neutral | 2026-02-05 |
| Morgan Stanley | Downgrade | Equal Weight | 2026-01-20 |
| Citigroup | Maintain | Neutral | 2026-01-20 |
| Morgan Stanley | Maintain | Overweight | 2025-12-17 |
| Raymond James | Upgrade | Strong Buy | 2025-11-25 |
| Barclays | Maintain | Equal Weight | 2025-11-05 |
The consensus reflects a moderate bullish stance, with the majority rating CDW as Buy or Equal Weight. Recent downgrades from Overweight to Equal Weight by Morgan Stanley indicate some caution.
Consumer Opinions
Consumer sentiment around CDW Corporation reflects a balance between strong service reliability and occasional concerns over pricing.
| Positive Reviews | Negative Reviews |
|---|---|
| “CDW delivers excellent customer support and quick responses.” | “Pricing feels higher compared to competitors.” |
| “Their product selection is vast and well-curated.” | “Occasional delays in shipping during peak periods.” |
| “The technical expertise of their staff is impressive.” | “Some software packages come with confusing licensing.” |
Overall, consumers praise CDW for its knowledgeable staff and broad product range. However, pricing and occasional fulfillment delays emerge as common pain points.
Risk Analysis
Below is a summary table highlighting key risks facing CDW Corporation, assessing their likelihood and potential impact on the business:
| Category | Description | Probability | Impact |
|---|---|---|---|
| Financial Leverage | High debt-to-equity ratio (2.42) increases financial risk | High | High |
| Profitability | Low net margin (4.76%) limits earnings buffer | Medium | Medium |
| Valuation | Elevated price-to-book ratio (6.86) suggests overvaluation | Medium | Medium |
| Liquidity | Current ratio of 1.18 indicates moderate liquidity | Low | Low |
| Bankruptcy Risk | Altman Z-Score in grey zone (2.56) signals moderate distress | Medium | High |
| Market Volatility | Beta near 1.05 shows sensitivity to market swings | Medium | Medium |
I regard CDW’s elevated financial leverage as the most pressing risk. Historically in IT services, companies with high debt ratios face amplified earnings volatility during economic slowdowns. The grey zone Altman Z-Score reinforces a moderate risk of financial distress. Meanwhile, net margin pressure constrains reinvestment capacity. These factors warrant caution despite favorable returns on equity and invested capital.
Should You Buy CDW Corporation?
CDW Corporation appears to be a moderately profitable company with a slightly favorable moat supported by value creation exceeding its cost of capital. Despite a challenging leverage profile, its overall rating of B+ suggests a very favorable investment case tempered by financial risks.
Strength & Efficiency Pillars
CDW Corporation demonstrates solid operational efficiency with a return on equity of 40.93% and a return on invested capital (ROIC) of 12.17%. The company’s weighted average cost of capital (WACC) stands at 6.99%, confirming CDW as a value creator since ROIC exceeds WACC by over 5 percentage points. Gross margin holds favorably at 21.73%, while interest coverage of 7.28x indicates manageable debt servicing. These metrics reflect an efficient capital allocation and operational resilience despite a slight decline in ROIC trend.
Weaknesses and Drawbacks
CDW’s Altman Z-Score of 2.56 places it in the grey zone, signaling moderate financial distress risk and warranting caution. The debt-to-equity ratio is alarmingly high at 2.42, undermining balance sheet stability. Price-to-book at 6.86 suggests an expensive valuation, while the current ratio of 1.18 and net margin of 4.76% are only marginally adequate. Recent market action reveals seller dominance with only 32.36% buyer volume, adding short-term pressure and heightening volatility risk.
Our Final Verdict about CDW Corporation
Despite CDW’s operational strengths and value-creating profile, the grey zone Altman Z-Score and leverage risks make the investment profile moderately speculative. The bearish stock trend and recent seller dominance suggest that investors might consider a wait-and-see approach before committing capital. The company may appear attractive for long-term exposure but requires careful monitoring of solvency and market dynamics.
Disclaimer: This content is for informational purposes only and does not constitute financial, investment, or other professional advice. Investing in financial markets involves a significant risk of loss, and past performance is not indicative of future results.
Additional Resources
- CDW Corp SEC 10-K Report – TradingView (Feb 20, 2026)
- Decoding CDW Corp (CDW): A Strategic SWOT Insight – GuruFocus (Feb 21, 2026)
- CDW to Participate in the Morgan Stanley Technology, Media & Telecom Conference – Yahoo Finance (Feb 18, 2026)
- CDW to Participate in the Morgan Stanley Technology, Media & Telecom Conference – Business Wire (Feb 18, 2026)
- CDW Stock: Analyst Estimates & Ratings – Barchart.com (Feb 18, 2026)
For more information about CDW Corporation, please visit the official website: cdw.com