Home > Analyses > Real Estate > CBRE Group, Inc.
CBRE Group, Inc. transforms the way businesses occupy and invest in commercial real estate worldwide. As the largest global real estate services firm, it commands the market with cutting-edge advisory, workplace solutions, and investment management. Its reputation for innovation and comprehensive offerings drives efficiency for owners and occupiers alike. The critical question now is whether CBRE’s enduring industry dominance and strategic execution justify its current valuation and future growth prospects.

Table of contents
Business Model & Company Overview
CBRE Group, Inc. stands as a global leader in commercial real estate services, founded in 1906 and headquartered in Dallas, Texas. It delivers a comprehensive ecosystem through three core segments: Advisory Services, Global Workplace Solutions, and Real Estate Investments. This integrated model serves owners, investors, and occupiers worldwide, blending strategic advice with hands-on management and investment expertise.
The company’s revenue engine balances advisory fees, facilities management, and investment management, creating multiple recurring income streams. CBRE operates extensively across the Americas, Europe, and Asia, leveraging its global footprint to capture diverse market opportunities. Its economic moat derives from deep industry expertise, scale, and trusted client relationships that shape the future of real estate services.
Financial Performance & Fundamental Metrics
I analyze CBRE Group, Inc.’s income statement, key financial ratios, and dividend payout policy to assess its profitability, efficiency, and shareholder returns.
Income Statement
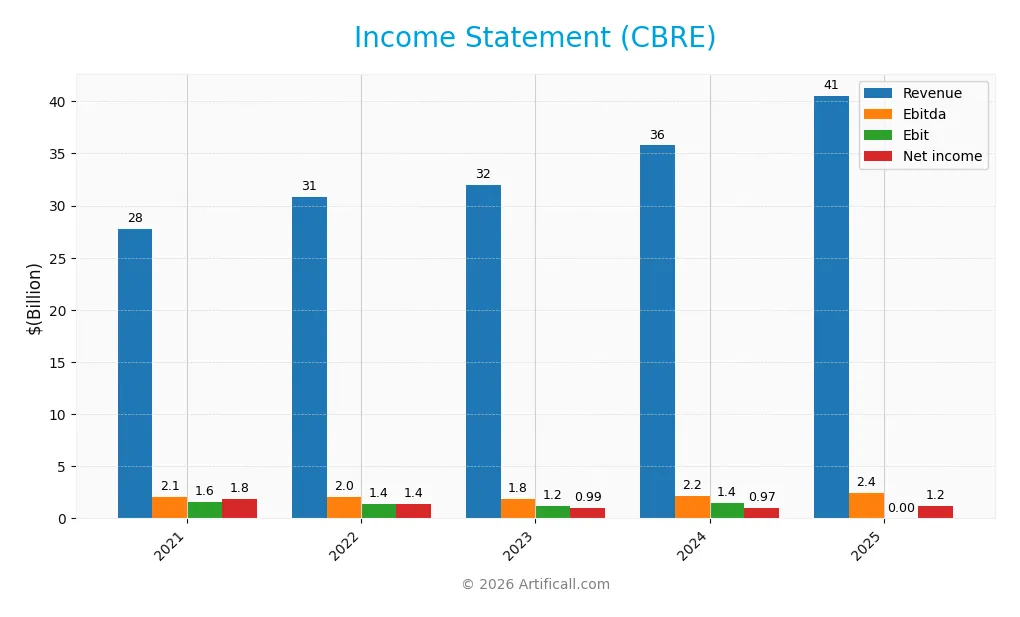
This table summarizes CBRE Group, Inc.’s key income statement figures for fiscal years 2021 through 2025, highlighting revenue, expenses, and earnings metrics.
| 2021 | 2022 | 2023 | 2024 | 2025 | |
|---|---|---|---|---|---|
| Revenue | 27.7B | 30.8B | 31.9B | 35.8B | 40.6B |
| Cost of Revenue | 21.6B | 24.2B | 25.7B | 28.7B | 33.0B |
| Operating Expenses | 4.53B | 5.11B | 5.18B | 5.61B | 6.27B |
| Gross Profit | 6.17B | 6.62B | 6.30B | 7.02B | 7.57B |
| EBITDA | 2.09B | 2.03B | 1.83B | 2.15B | 2.42B |
| EBIT | 1.57B | 1.42B | 1.18B | 1.45B | N/A |
| Interest Expense | 50M | 69M | 149M | 215M | 216M |
| Net Income | 1.84B | 1.41B | 986M | 968M | 1.16B |
| EPS | 5.48 | 4.36 | 3.20 | 3.16 | 3.85 |
| Filing Date | 2022-03-01 | 2023-02-27 | 2024-02-20 | 2025-02-14 | 2026-02-12 |
Income Statement Evolution
CBRE’s revenue grew steadily by 46% from 2021 to 2025, with a notable 13% rise in 2025 alone. Gross profit expanded by 8% in the last year, maintaining an 18.7% gross margin that remained neutral. However, net income declined 37% over the period, with net margin shrinking by 57%, despite a recent 5% margin improvement.
Is the Income Statement Favorable?
In 2025, CBRE reported $40.6B revenue and $1.16B net income, yielding a 2.85% net margin, considered neutral. Operating income declined sharply, reflected in a 0% EBIT margin, an unfavorable sign. Interest expenses remained low at 0.53% of revenue, which is favorable. Overall, the fundamentals show mixed signals but lean toward a favorable income profile.
Financial Ratios
The following table presents key financial ratios for CBRE Group, Inc. over the fiscal years 2021 to 2025, providing insight into profitability, liquidity, leverage, and valuation:
| Ratios | 2021 | 2022 | 2023 | 2024 | 2025 |
|---|---|---|---|---|---|
| Net Margin | 6.6% | 4.6% | 3.1% | 2.7% | 2.9% |
| ROE | 21.5% | 17.9% | 11.9% | 11.5% | N/A |
| ROIC | 8.2% | 9.5% | 5.9% | 7.4% | N/A |
| P/E | 19.8 | 17.7 | 29.1 | 41.5 | 0 |
| P/B | 4.3 | 3.2 | 3.5 | 4.8 | 0 |
| Current Ratio | 1.20 | 1.03 | 1.17 | 1.07 | 0 |
| Quick Ratio | 1.20 | 1.03 | 1.17 | 1.07 | 0 |
| D/E | 0.49 | 0.44 | 0.58 | 0.68 | 0 |
| Debt-to-Assets | 19.0% | 17.0% | 21.4% | 23.4% | 0 |
| Interest Coverage | 32.5 | 21.9 | 7.5 | 6.6 | 8.1 |
| Asset Turnover | 1.26 | 1.50 | 1.42 | 1.47 | 0 |
| Fixed Asset Turnover | 14.9 | 16.5 | 16.5 | 16.9 | 0 |
| Dividend Yield | 0% | 0% | 0% | 0% | 0% |
Evolution of Financial Ratios
From 2021 to 2025, CBRE’s Return on Equity (ROE) showed a marked decline, hitting 0% in 2025. The Current Ratio fell from a healthy 1.20 in 2021 to zero in 2025, indicating deteriorating liquidity. Debt-to-Equity fluctuated but ultimately was reported as favorable despite missing data in 2025. Profitability margins steadily declined, with net margin dropping from 6.62% in 2021 to 2.85% in 2025.
Are the Financial Ratios Favorable?
In 2025, CBRE’s profitability ratios, including ROE and net margin, were unfavorable, signaling weak returns for equity holders. Liquidity ratios like Current and Quick Ratios were unavailable or unfavorable, suggesting potential short-term solvency risks. However, leverage ratios such as Debt-to-Equity and Debt-to-Assets were favorable, reflecting prudent capital structure management. Market valuation metrics were limited but showed some favorable signs. Overall, the ratio profile is predominantly unfavorable.
Shareholder Return Policy
CBRE Group, Inc. does not pay dividends, reflecting a strategic focus on reinvestment and growth. The absence of dividend payouts aligns with the company’s emphasis on capital expenditure and operational cash flow coverage, supporting ongoing expansion initiatives.
The company also does not report share buyback programs, suggesting retention of cash for internal uses. This prudent capital allocation approach appears consistent with sustainable long-term value creation for shareholders.
Score analysis
The radar chart below summarizes CBRE Group, Inc.’s key financial scores across valuation, profitability, and leverage metrics:
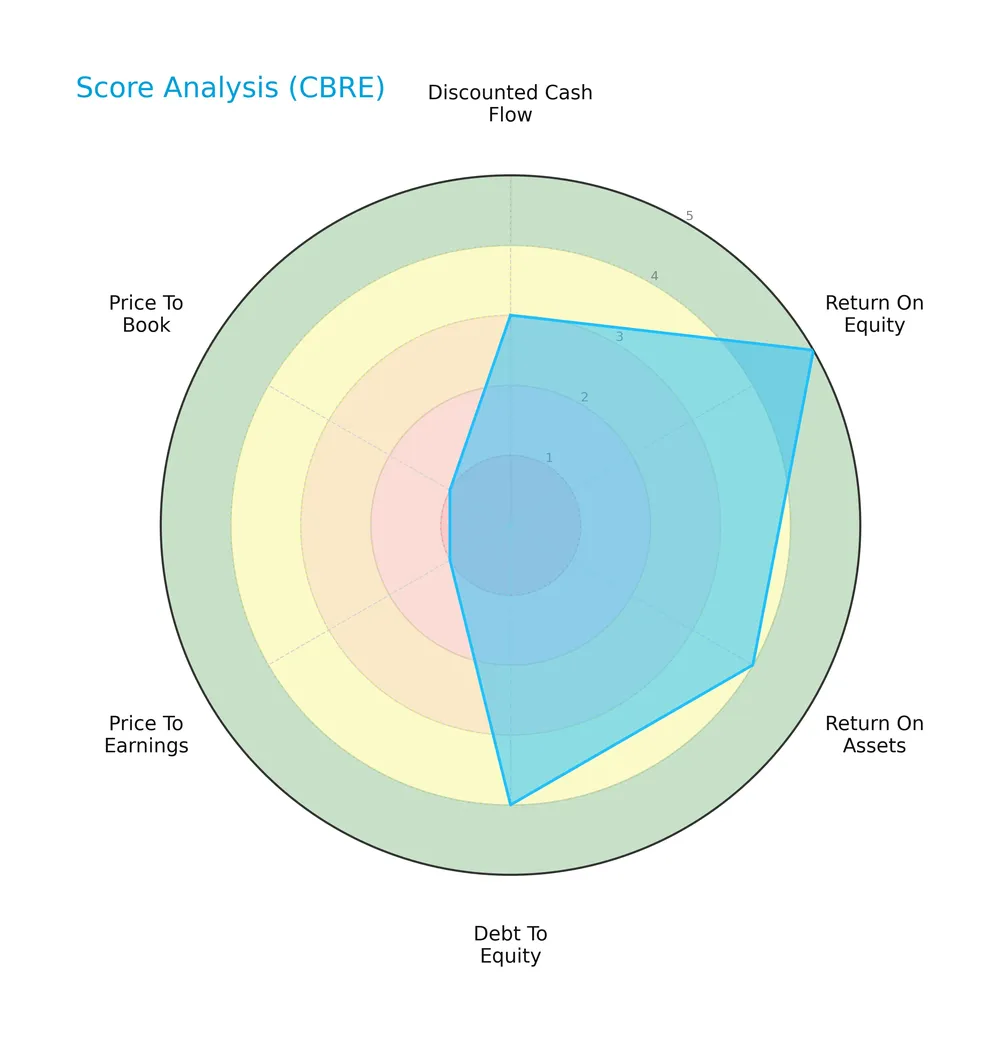
CBRE shows strong profitability with a 5 in return on equity and 4 in return on assets and debt-to-equity. Valuation scores are weak, with price-to-earnings and price-to-book scores at 1, indicating potential market undervaluation or investor caution.
Analysis of the company’s bankruptcy risk
CBRE’s Altman Z-Score places it in the grey zone, suggesting a moderate risk of financial distress and potential bankruptcy:

Is the company in good financial health?
The Piotroski Score diagram illustrates CBRE’s financial health based on profitability, leverage, liquidity, and efficiency:

With a Piotroski Score of 6, CBRE demonstrates average financial strength. This score indicates reasonable health but leaves room for improvement compared to stronger peers.
Competitive Landscape & Sector Positioning
This sector analysis examines CBRE Group, Inc.’s strategic positioning, revenue by segment, key products, and main competitors. I will assess whether CBRE holds a competitive advantage over its industry peers.
Strategic Positioning
CBRE Group, Inc. maintains a diversified product portfolio across three segments: Advisory Services (9.6B), Global Workplace Solutions (25.1B), and Real Estate Investments (1.0B) in 2024. Geographically, it generates significant revenue in the US (20.2B), UK (5.0B), and other countries (10.6B), reflecting broad global exposure.
Revenue by Segment
The pie chart illustrates CBRE Group’s revenue distribution across three main segments for the fiscal year 2024, highlighting their relative contribution to total sales.
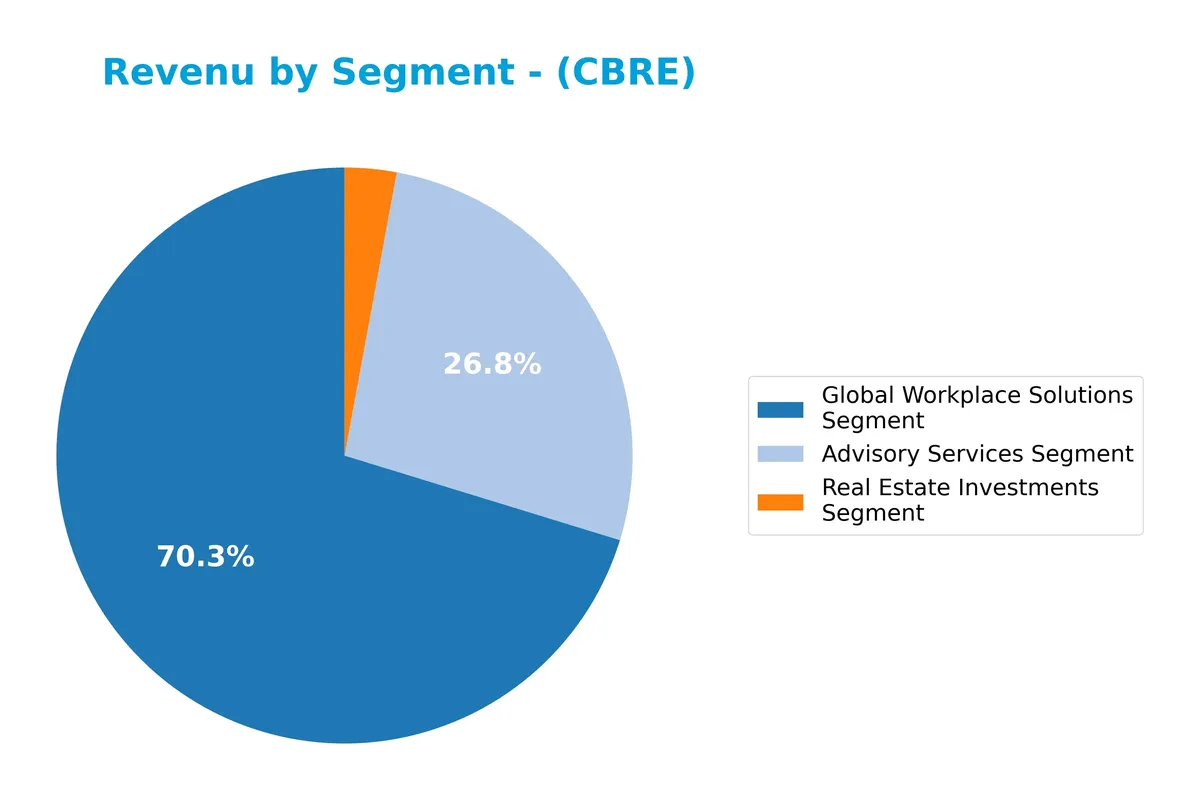
In 2024, Global Workplace Solutions leads with $25.1B, showing steady growth from $22.5B in 2023. Advisory Services follows at $9.6B, accelerating from $8.5B last year. Real Estate Investments remains smallest but stable at $1.0B. The firm’s revenue increasingly concentrates in its two larger segments, signaling robust demand for workplace and advisory services amid evolving real estate markets.
Key Products & Brands
CBRE Group, Inc. operates through three main business segments offering a range of real estate services and investment solutions:
| Product | Description |
|---|---|
| Advisory Services Segment | Provides leasing, property sales, mortgage services, property/project management, valuation, and consulting services globally. |
| Global Workplace Solutions Segment | Offers facilities management, project management, and transaction management services to clients worldwide. |
| Real Estate Investments Segment | Delivers investment management, development services, and flexible-space solutions under brands like CBRE Investment Management and Trammell Crow Company. |
CBRE’s diversified portfolio spans strategic advisory, extensive workplace solutions, and investment management, positioning it as a leader in commercial real estate services globally.
Main Competitors
The sector includes 2 competitors, with the table showing the top 2 leaders by market capitalization:
| Competitor | Market Cap. |
|---|---|
| CBRE Group, Inc. | 47.7B |
| CoStar Group, Inc. | 27.8B |
CBRE Group, Inc. ranks first among its competitors with a market cap 85.07% of the sector leader’s scale. It stands above both the average top 10 market cap (37.8B) and the sector median (37.8B). The company holds a 45.67% market cap lead over its closest rival, CoStar Group, highlighting a significant competitive gap.
Comparisons with competitors
Check out how we compare the company to its competitors:
Does CBRE have a competitive advantage?
CBRE operates as a global leader in commercial real estate services with a diversified business model across advisory, workplace solutions, and investments. The company benefits from a broad geographic footprint, strong client relationships, and scale, but lacks publicly available data on ROIC versus WACC to confirm a clear moat.
Looking ahead, CBRE’s expansion in flexible-space solutions and investment management offers growth potential in evolving real estate markets. Continued revenue growth and geographic diversification position the company to capitalize on new opportunities despite a declining ROIC trend over the last five years.
SWOT Analysis
This SWOT analysis highlights CBRE Group, Inc.’s key internal and external factors impacting its strategic positioning.
Strengths
- global market leader in commercial real estate services
- diversified revenue streams across segments
- strong presence in US and international markets
Weaknesses
- declining ROIC trend signals weakening capital efficiency
- unfavorable EBIT margin and low profitability
- liquidity ratios and interest coverage are weak
Opportunities
- expanding global real estate demand
- growth in flexible-space solutions
- increasing strategic advisory needs amid market complexity
Threats
- economic slowdown impacting real estate investments
- rising interest rates increasing financing costs
- intense competition from niche and integrated service providers
CBRE’s strengths in market leadership and diversification support growth, but profitability and capital efficiency challenges require strategic focus. The company must leverage market opportunities while mitigating macroeconomic and competitive risks.
Stock Price Action Analysis
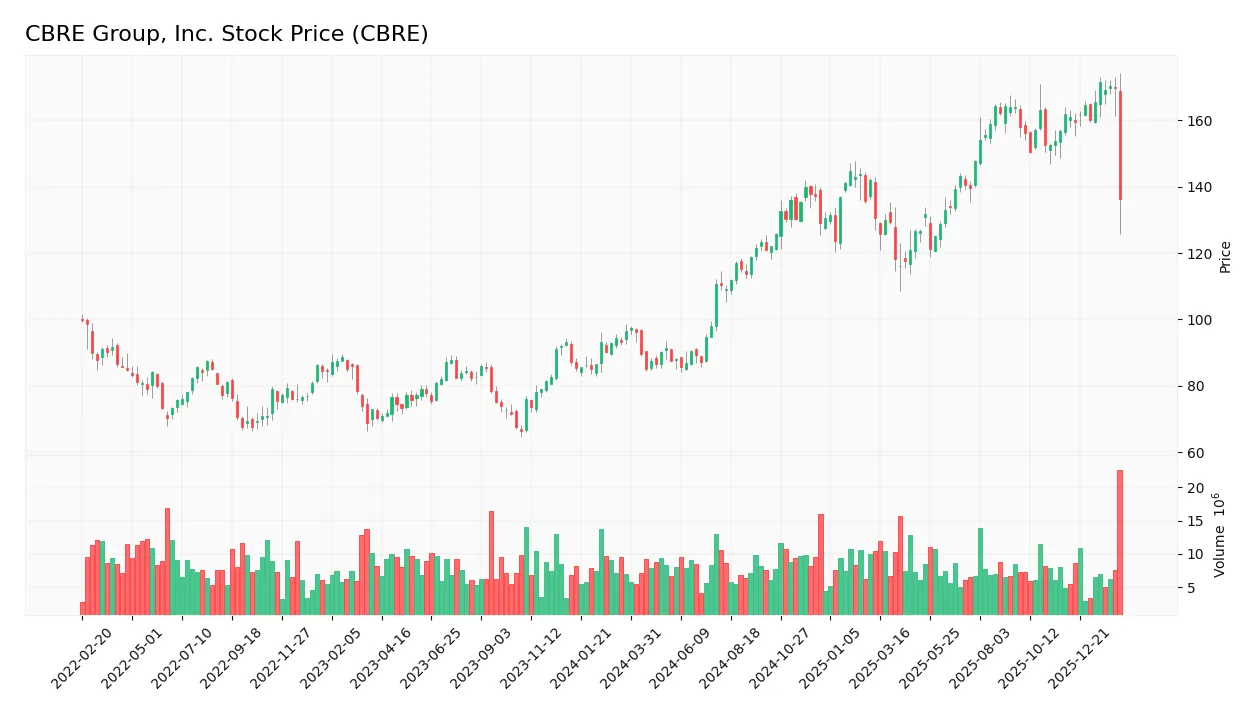
The weekly stock chart for CBRE Group, Inc. reveals price movements and trends over the past 12 months:
Trend Analysis
Over the past 12 months, CBRE’s stock price increased by 41.09%, indicating a bullish trend. The price showed deceleration in upward momentum. The highest price reached 171.59, the lowest 84.9, and volatility was high with a 24.77 standard deviation.
Volume Analysis
Over the last three months, trading volume decreased. Selling activity slightly dominated with 52.44M shares sold versus 38.26M bought, signaling cautious investor sentiment and lower market participation. Buyer dominance fell to 42.18%, reflecting mild bearish pressure.
Target Prices
Analysts set a confident target consensus for CBRE Group, Inc., reflecting steady optimism.
| Target Low | Target High | Consensus |
|---|---|---|
| 175 | 192 | 183 |
The target range suggests moderate upside potential. Overall, analysts expect CBRE to perform well, supported by its strong market position.

Don’t Let Luck Decide Your Entry Point
Optimize your entry points with our advanced ProRealTime indicators. You’ll get efficient buy signals with precise price targets for maximum performance. Start outperforming now!
Analyst & Consumer Opinions
This section examines CBRE Group, Inc.’s recent analyst ratings alongside consumer feedback and market sentiment trends.
Stock Grades
The latest verified analyst ratings for CBRE Group, Inc. show a consistent pattern of positive outlooks from major firms:
| Grading Company | Action | New Grade | Date |
|---|---|---|---|
| Barclays | Maintain | Overweight | 2026-01-13 |
| Keefe, Bruyette & Woods | Maintain | Outperform | 2026-01-08 |
| Keefe, Bruyette & Woods | Upgrade | Outperform | 2025-12-15 |
| UBS | Maintain | Neutral | 2025-10-24 |
| UBS | Maintain | Neutral | 2025-10-10 |
| Keefe, Bruyette & Woods | Maintain | Market Perform | 2025-10-09 |
| Morgan Stanley | Maintain | Overweight | 2025-10-07 |
| JP Morgan | Maintain | Overweight | 2025-08-26 |
| Evercore ISI Group | Maintain | Outperform | 2025-08-25 |
| Evercore ISI Group | Maintain | Outperform | 2025-07-30 |
Analyst sentiment for CBRE remains broadly favorable, with multiple upgrades and sustained overweight and outperform ratings. The consensus leans clearly toward a “Buy,” reflecting confidence despite some neutral positions.
Consumer Opinions
CBRE Group, Inc. enjoys a generally favorable reputation among its clients, with praise centered on professionalism and market expertise.
| Positive Reviews | Negative Reviews |
|---|---|
| “CBRE’s local market knowledge is unmatched.” | “Response times can be slow during peak periods.” |
| “Their agents are highly professional and reliable.” | “Some fees seem higher than competitors.” |
| “Excellent negotiation skills that secure great deals.” | “Occasional miscommunication on contract details.” |
Overall, clients consistently highlight CBRE’s deep market insight and professionalism. However, concerns about response times and fee structures suggest areas for operational improvement.
Risk Analysis
Below is a summary table highlighting CBRE Group, Inc.’s key risks with their likelihood and potential impact:
| Category | Description | Probability | Impact |
|---|---|---|---|
| Market Risk | Exposure to real estate cycles and economic downturns affecting property demand and valuations. | High | High |
| Liquidity Risk | Unfavorable current and quick ratios indicate potential short-term liquidity constraints. | Medium | Medium |
| Profitability Risk | Low net margin (2.85%) and zero ROE/ROIC signal weak earnings relative to capital invested. | High | High |
| Leverage Risk | Favorable debt-to-equity ratio suggests controlled leverage but interest coverage concerns exist. | Medium | Medium |
| Valuation Risk | Zero or very unfavorable P/E and P/B ratios highlight market skepticism on valuation. | High | Medium |
| Bankruptcy Risk | Altman Z-Score in the grey zone (2.63) implies moderate financial distress risk. | Medium | High |
| Operational Risk | Large volumes and sector volatility could impact execution and margins under market stress. | Medium | Medium |
The most critical risks are CBRE’s weak profitability and valuation metrics amid a volatile real estate market. Its Altman Z-Score signals moderate bankruptcy risk, demanding close monitoring. Liquidity ratios also raise red flags in a rising interest rate environment. These factors combined heighten investment risk despite a solid market position.
Should You Buy CBRE Group, Inc.?
CBRE appears to be a moderately profitable company with signs of operational efficiency but a declining return on invested capital suggests an eroding competitive moat. Despite manageable leverage, valuation metrics could be seen as unfavorable, yielding an overall B+ rating.
Strength & Efficiency Pillars
CBRE Group, Inc. shows operational resilience with a favorable revenue growth of 13.37% in the past year and gross profit growth of 7.78%. Interest expense remains low at 0.53%, supporting cost efficiency. The company holds a strong Piotroski Score of 6, indicating average financial health. However, profitability metrics lag, with net margin at 2.85% and ROE and ROIC effectively at 0%, limiting evidence of value creation. The Altman Z-Score of 2.63 places CBRE in the grey zone, signaling moderate financial risk.
Weaknesses and Drawbacks
CBRE faces moderate solvency risk with an Altman Z-Score of 2.63, reflecting potential vulnerability in financial stability. Profitability struggles are evident, with an EBIT margin at 0.0% and net margin remaining low. The company’s valuation appears favorable, but key liquidity ratios like current and quick ratios are unfavorable or unavailable, raising short-term liquidity concerns. Recent market activity shows a slightly seller-dominant trend with buyer dominance at 42.18%, indicating near-term selling pressure and potential volatility ahead.
Our Final Verdict about CBRE Group, Inc.
Despite favorable revenue growth and solid financial discipline, CBRE’s moderate Altman Z-Score of 2.63 introduces solvency caution. The profile suggests operational strengths but is tempered by low profitability and liquidity risks. While the long-term trend remains bullish, recent seller dominance implies a cautious entry. CBRE may appear suitable for investors with moderate risk tolerance but remains too speculative for conservative capital.
Disclaimer: This content is for informational purposes only and does not constitute financial, investment, or other professional advice. Investing in financial markets involves a significant risk of loss, and past performance is not indicative of future results.
Additional Resources
- CBRE Group, Inc. Reports Financial Results for Q4 and Full Year 2025 – Business Wire (Feb 12, 2026)
- CBRE Stock Drops Despite Record Revenue and EPS Growth – GuruFocus (Feb 12, 2026)
- CBRE Group Inc. Cl A stock underperforms Thursday when compared to competitors – MarketWatch (Feb 12, 2026)
- News | CBRE’s revenue hits record with boost from data centers – CoStar (Feb 12, 2026)
- CBRE GROUP ($CBRE) Releases Q4 2025 Earnings – Quiver Quantitative (Feb 12, 2026)
For more information about CBRE Group, Inc., please visit the official website: cbre.com