Home > Analyses > Financial Services > Cboe Global Markets, Inc.
Cboe Global Markets, Inc. shapes global financial markets by powering options, equities, and futures trading across multiple continents. Its pioneering platforms handle vast transaction volumes, setting industry standards in innovation and market transparency. Known for its strategic partnerships with leading index providers, Cboe commands a unique moat in derivatives and exchange-traded products. As market dynamics evolve, I ask: does Cboe’s robust foundation still justify its premium valuation and growth prospects in 2026?

Table of contents
Business Model & Company Overview
Cboe Global Markets, Inc., founded in 1973 and headquartered in Chicago, commands a dominant position in the Financial – Data & Stock Exchanges sector. It operates a comprehensive ecosystem spanning options, equities, futures, and FX markets. The company’s mission centers on providing seamless access to global derivatives and cash markets, integrating multiple asset classes under one roof.
Cboe’s revenue engine balances transaction fees from its five operating segments across the Americas, Europe, and Asia Pacific. It leverages recurring listings and clearing services alongside high-volume trading in listed options and futures. This diversified model underpins its strong economic moat, driven by deep market liquidity and strategic partnerships with major index providers.
Financial Performance & Fundamental Metrics
I analyze Cboe Global Markets’ income statement, key financial ratios, and dividend payout policy to assess its operational efficiency and shareholder returns.
Income Statement
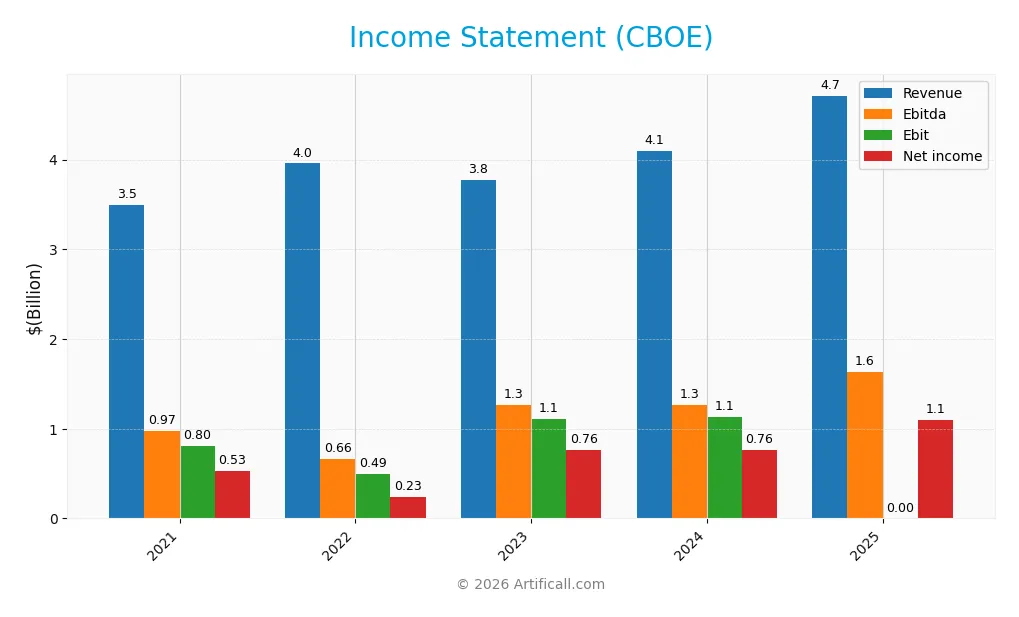
The following table summarizes Cboe Global Markets, Inc.’s key income statement metrics over the past five fiscal years, reported in USD.
| 2021 | 2022 | 2023 | 2024 | 2025 | |
|---|---|---|---|---|---|
| Revenue | 3.49B | 3.96B | 3.77B | 4.09B | 4.71B |
| Cost of Revenue | 2.02B | 2.22B | 1.86B | 2.02B | 2.41B |
| Operating Expenses | 670M | 1.25B | 860M | 974M | 793M |
| Gross Profit | 1.48B | 1.74B | 1.92B | 2.07B | 2.31B |
| EBITDA | 972M | 660M | 1.27B | 1.27B | 1.64B |
| EBIT | 804M | 493M | 1.11B | 1.14B | 1.51B |
| Interest Expense | 48M | 60M | 62M | 52M | 0 |
| Net Income | 529M | 235M | 761M | 765M | 1.10B |
| EPS | 4.93 | 2.21 | 7.16 | 7.24 | 10.46 |
| Filing Date | 2022-02-18 | 2023-02-17 | 2024-02-16 | 2025-02-21 | 2026-02-20 |
Income Statement Evolution
Cboe Global Markets’ revenue grew steadily from 3.5B in 2021 to 4.7B in 2025, a 35% increase over five years. Net income more than doubled, rising 108% to 1.1B. Margins improved notably, with gross margin reaching 48.9% and net margin expanding to 23.3%, reflecting enhanced operational efficiency and cost control.
Is the Income Statement Favorable?
The 2025 income statement shows robust fundamentals. Revenue rose 15% year-over-year, driven by a strong 33% EBIT growth. The company reported zero interest expense, boosting profitability. Net margin expanded 25%, and EPS surged 45%, signaling effective capital allocation. Overall, Cboe’s income statement displays favorable trends, supported by consistent margin improvement and strong bottom-line growth.
Financial Ratios
The table below summarizes key financial ratios for Cboe Global Markets, Inc. over the last five fiscal years:
| Ratios | 2021 | 2022 | 2023 | 2024 | 2025 |
|---|---|---|---|---|---|
| Net Margin | 15% | 6% | 20% | 19% | 23% |
| ROE | 15% | 7% | 19% | 18% | 21% |
| ROIC | 10% | 5% | 13% | 12% | 15% |
| P/E | 26.4 | 56.8 | 24.8 | 26.8 | 23.9 |
| P/B | 3.87 | 3.85 | 4.74 | 4.80 | 5.11 |
| Current Ratio | 1.31 | 1.05 | 1.43 | 1.78 | 1.87 |
| Quick Ratio | 1.31 | 1.05 | 1.43 | 1.78 | 1.87 |
| D/E | 0.40 | 0.54 | 0.40 | 0.37 | 0.33 |
| Debt-to-Assets | 21% | 27% | 22% | 21% | 18% |
| Interest Coverage | 17.0 | 8.2 | 17.0 | 21.3 | 0 |
| Asset Turnover | 0.51 | 0.57 | 0.50 | 0.53 | 0.51 |
| Fixed Asset Turnover | 16.1 | 17.8 | 15.4 | 16.9 | 19.3 |
| Dividend Yield | 1.39% | 1.57% | 1.18% | 1.21% | 1.08% |
Evolution of Financial Ratios
From 2021 to 2025, Cboe Global Markets, Inc. saw ROE improve steadily from 14.7% to 21.4%, signaling enhanced profitability. The current ratio rose from 1.31 to 1.87, indicating stronger liquidity. The debt-to-equity ratio declined from 0.40 to 0.33, reflecting a moderate reduction in leverage and greater financial stability.
Are the Financial Ratios Fovorable?
In 2025, profitability metrics show strength with a 23.3% net margin and ROIC at 15.3%, both favorable against a 5.14% WACC. Liquidity ratios (current and quick) at 1.87 are solid. Leverage remains conservative with debt-to-equity at 0.33 and debt-to-assets at 18.1%. Market valuation ratios are mixed: PE is neutral at 23.9, but PB is unfavorable at 5.11. Overall, 71% of key ratios are favorable, supporting a generally positive financial profile.
Shareholder Return Policy
Cboe Global Markets, Inc. consistently pays dividends, with a payout ratio near 26% in 2025 and a dividend per share rising to $2.7. The annual yield hovers around 1.08%, supported by solid net income and free cash flow coverage, indicating disciplined capital allocation.
The company also engages in share buybacks, complementing its dividend strategy. This balanced distribution approach appears sustainable, aligning well with Cboe’s profitability and cash flow generation, thus supporting long-term shareholder value creation without overextending its financial resources.
Score analysis
The radar chart below illustrates the company’s key financial scores and valuation measures:
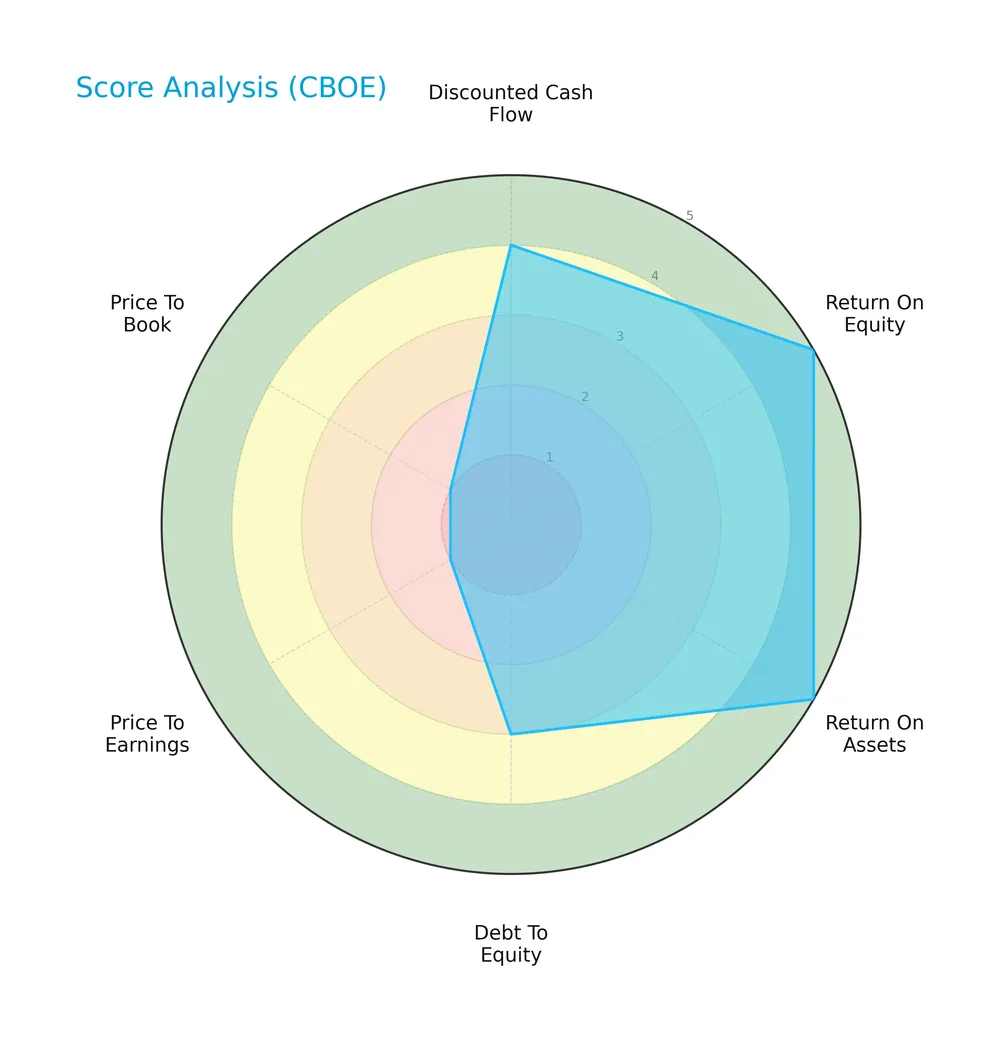
Cboe Global Markets scores highly on return on equity and assets, indicating efficient capital use. Its discounted cash flow rating is favorable, while debt-to-equity is moderate. Valuation metrics like P/E and P/B are very unfavorable, signaling potential market pricing concerns.
Analysis of the company’s bankruptcy risk
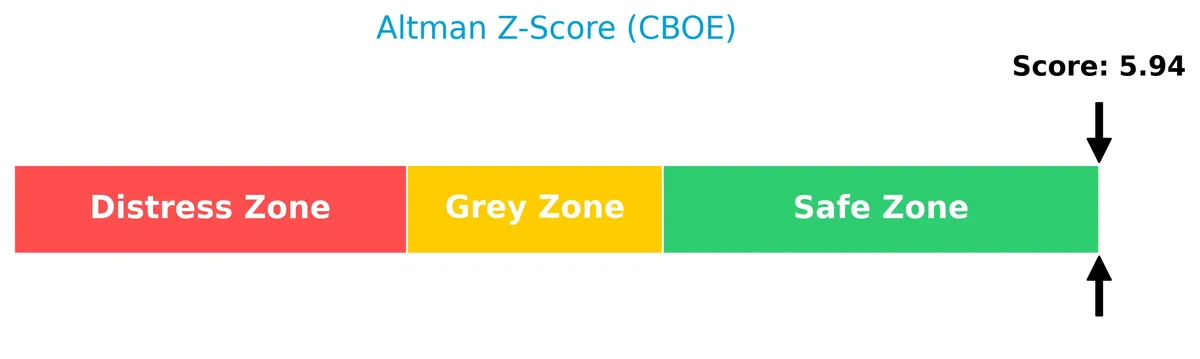
The Altman Z-Score places the company firmly in the safe zone, indicating a low probability of bankruptcy and strong financial stability:
Is the company in good financial health?
The Piotroski Score diagram highlights the company’s solid financial strength and operational efficiency:

With a strong score of 7, Cboe Global Markets shows robust financial health, suggesting reliable profitability and sound balance sheet management.
Competitive Landscape & Sector Positioning
This sector analysis will explore Cboe Global Markets’ strategic positioning, revenue segments, key products, and main competitors. I will assess whether Cboe holds a competitive advantage within the financial data and stock exchange industry.
Strategic Positioning
Cboe Global Markets operates a diversified product portfolio spanning options, equities, futures, FX, and data services. Geographically, it emphasizes North America with $1.67B revenue and maintains a significant presence in Europe and Asia Pacific at $379M, balancing concentrated domestic strength with international reach.
Revenue by Segment
This pie chart illustrates Cboe Global Markets’ revenue distribution by segment for the fiscal year 2025, highlighting key contributors to its business model.
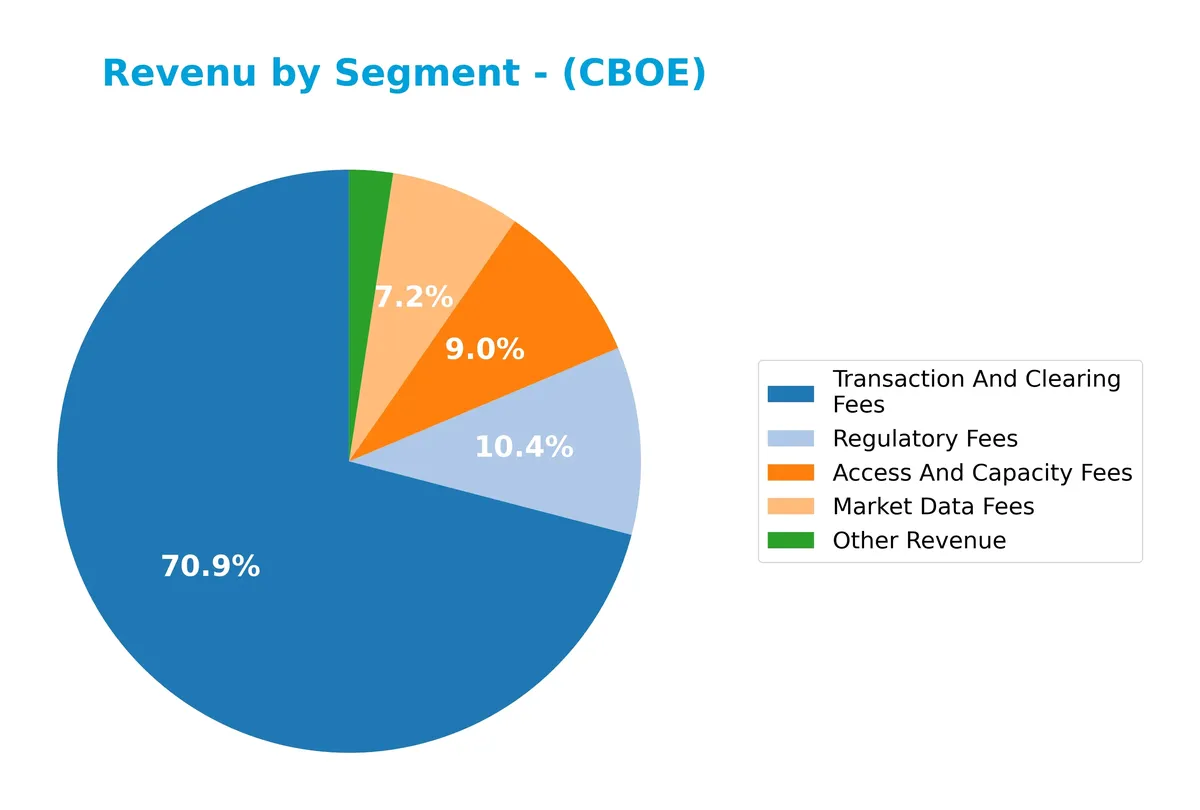
Transaction And Clearing Fees dominate with $3.6B, showcasing their critical role in Cboe’s revenue engine. Access And Capacity Fees and Market Data Fees contribute $409M and $327M respectively, reflecting steady demand for infrastructure and information services. Regulatory Fees at $285M declined from 2024, signaling possible regulatory shifts. Other Revenue at $96M remains a minor component. The 2025 figures reveal a concentrated revenue base with strong transactional growth but some pressure on regulatory income.
Key Products & Brands
The following table summarizes Cboe Global Markets’ main revenue-generating products and services:
| Product | Description |
|---|---|
| Transaction And Clearing Fees | Fees from executing and clearing trades across options, futures, equities, and FX markets. |
| Access And Capacity Fees | Charges for market participants’ access and capacity to Cboe’s trading platforms. |
| Market Data Fees | Revenue from selling market data and information services to institutional and retail clients. |
| Regulatory Fees | Fees collected to cover regulatory costs associated with market operations. |
| Other Revenue | Miscellaneous income sources not classified under core fees and services. |
Cboe’s product suite centers on transaction and clearing services, access fees, and market data. These offerings support a global multi-asset exchange platform spanning options, equities, futures, and FX.
Main Competitors
There are 9 competitors in total; below is a table listing the top 10 leaders by market capitalization:
| Competitor | Market Cap. |
|---|---|
| S&P Global Inc. | 155.2B |
| CME Group Inc. | 97.2B |
| Intercontinental Exchange, Inc. | 91.7B |
| Moody’s Corporation | 89.7B |
| Coinbase Global, Inc. | 60.5B |
| Nasdaq, Inc. | 55.5B |
| MSCI Inc. | 43.7B |
| Cboe Global Markets, Inc. | 26.0B |
| FactSet Research Systems Inc. | 10.8B |
Cboe Global Markets ranks 8th among its peers, holding roughly 19% of the top competitor’s market cap. It sits below both the average market cap of 70B and the sector median near 60.5B. The company enjoys a 45% market cap cushion over its next closest rival, indicating a moderate gap in scale.
Comparisons with competitors
Check out how we compare the company to its competitors:
Does CBOE have a competitive advantage?
Cboe Global Markets demonstrates a sustainable competitive advantage, evidenced by a very favorable moat rating and a ROIC exceeding WACC by over 10%. Its growing ROIC trend signals efficient capital use and strong value creation.
Looking ahead, Cboe’s diversified segments across options, equities, futures, and FX position it well to capitalize on expanding international markets and new product opportunities in Europe and Asia Pacific. These prospects support continued growth and profitability.
SWOT Analysis
This SWOT analysis highlights Cboe Global Markets’ core competitive factors and strategic challenges to inform investment decisions.
Strengths
- Strong ROIC well above WACC
- Robust revenue and earnings growth
- Diversified global market segments
Weaknesses
- High price-to-book ratio signals valuation risk
- Moderate debt-to-equity ratio limits leverage flexibility
- Lower dividend yield than peers
Opportunities
- Expansion in international markets
- Growth in derivatives and FX trading
- Strategic relationships with index providers
Threats
- Regulatory scrutiny in financial markets
- Intense competition from other exchanges
- Market volatility affecting trading volumes
Cboe’s strengths underline a durable competitive advantage with healthy profitability and growth. Yet, valuation and leverage require vigilance. The company should leverage its global footprint and partnerships while managing regulatory and market risks prudently.
Stock Price Action Analysis
The weekly stock chart below illustrates Cboe Global Markets, Inc.’s price movement and volatility over the past 12 months:
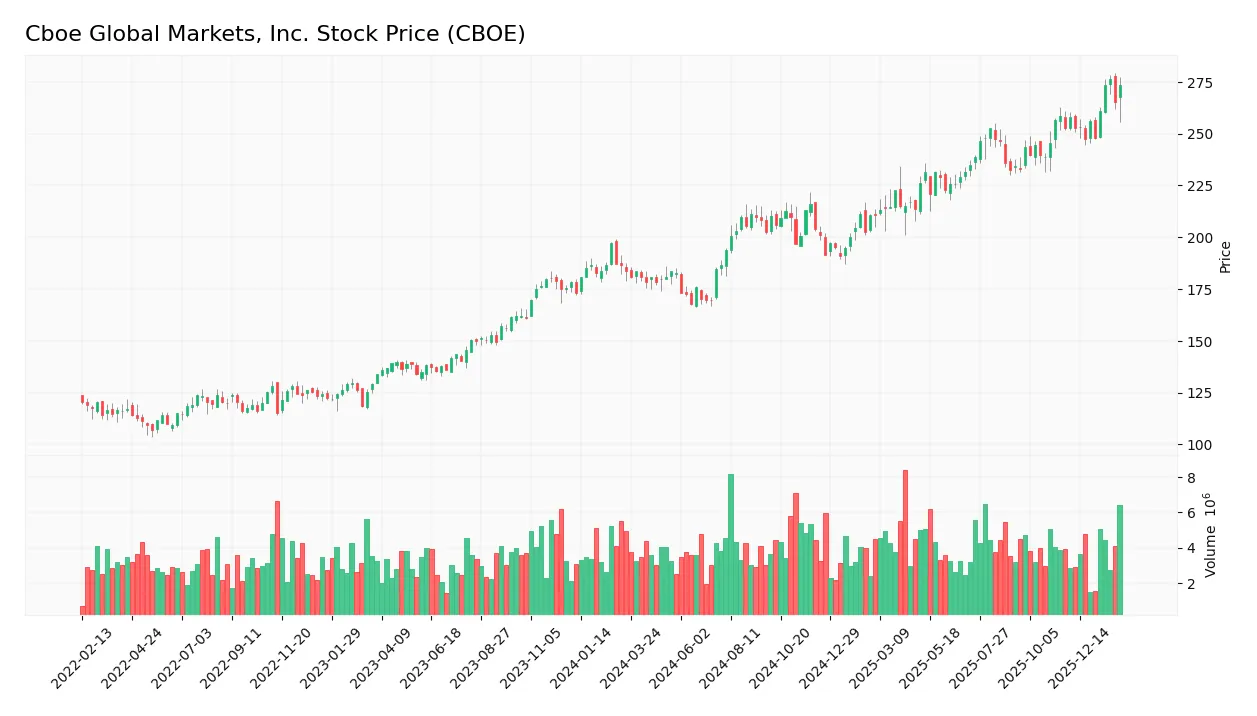
Trend Analysis
Over the past year, CBOE’s stock price rose 57.12%, indicating a strong bullish trend with accelerating momentum. The price ranged from a low of 167.6 to a high of 288.68. Volatility was significant, with a standard deviation of 28.54. Recent months show a continued positive slope of 3.21 and a 14.21% gain.
Volume Analysis
Trading volume is increasing, with buyers accounting for 55.4% of total activity over the last 12 months. In the recent period, buyer dominance strengthened to 70.14%, signaling strong buyer-driven sentiment and heightened market participation in the last three months.
Target Prices
Analysts present a confident target consensus for Cboe Global Markets, reflecting solid growth expectations.
| Target Low | Target High | Consensus |
|---|---|---|
| 240 | 317 | 289 |
The target range indicates bullish sentiment, with a midpoint suggesting upside potential near 289. This aligns with the stock’s strong market position.

Don’t Let Luck Decide Your Entry Point
Optimize your entry points with our advanced ProRealTime indicators. You’ll get efficient buy signals with precise price targets for maximum performance. Start outperforming now!
Analyst & Consumer Opinions
This section examines recent analyst ratings and consumer feedback to provide insight into Cboe Global Markets, Inc.’s market perception.
Stock Grades
Here are the latest verified analyst grades and actions for Cboe Global Markets, Inc.:
| Grading Company | Action | New Grade | Date |
|---|---|---|---|
| Barclays | Maintain | Overweight | 2026-02-09 |
| TD Cowen | Maintain | Hold | 2026-01-14 |
| Piper Sandler | Maintain | Overweight | 2026-01-14 |
| Barclays | Maintain | Overweight | 2026-01-08 |
| UBS | Maintain | Neutral | 2026-01-07 |
| Morgan Stanley | Maintain | Underweight | 2025-12-22 |
| Barclays | Upgrade | Overweight | 2025-12-12 |
| Citigroup | Maintain | Neutral | 2025-11-03 |
| Barclays | Maintain | Equal Weight | 2025-11-03 |
| Keefe, Bruyette & Woods | Maintain | Market Perform | 2025-11-03 |
The grades predominantly cluster around “Hold” and “Overweight,” with Barclays recently upgrading its stance. The consensus remains cautious, reflecting a balanced view of CBOE’s prospects amid mixed analyst opinions.
Consumer Opinions
Consumers express a mix of respect and frustration regarding Cboe Global Markets, Inc.’s services.
| Positive Reviews | Negative Reviews |
|---|---|
| Reliable trading platform with fast execution. | Customer support can be slow during peak times. |
| Transparent fee structure enhances trust. | Interface complexity intimidates new users. |
| Wide range of products meets diverse needs. | Occasional technical glitches disrupt trades. |
Overall, users appreciate Cboe’s reliability and product variety. However, recurring issues with customer service and platform usability suggest areas needing improvement.
Risk Analysis
Below is a summary table highlighting key risk categories, their likelihood, and potential impact on Cboe Global Markets, Inc.:
| Category | Description | Probability | Impact |
|---|---|---|---|
| Market Volatility | Fluctuations in trading volumes and market indices affecting revenue | Medium | High |
| Regulatory Risk | Changes in financial regulations impacting exchange operations | Medium | Medium |
| Competitive Risk | Pressure from new entrants or alternative trading platforms | Low | Medium |
| Valuation Risk | Elevated price-to-book ratio suggests potential overvaluation | Medium | Medium |
| Liquidity Risk | Lower average volume compared to peers may affect share liquidity | Low | Low |
The most pressing risks are market volatility and valuation pressures. Cboe’s low beta (0.35) cushions against volatility but its high PB ratio (5.11) flags overvaluation. Regulatory shifts remain a moderate risk given the sector’s complexity. Overall, Cboe’s safe Altman Z-score (6.18) and strong Piotroski score (7) mitigate bankruptcy concerns.
Should You Buy Cboe Global Markets, Inc.?
Cboe appears to be a robustly profitable company with a durable competitive moat, as indicated by its growing ROIC and value creation above WACC. Despite moderate leverage, its overall rating of B+ suggests a very favorable risk-return profile.
Strength & Efficiency Pillars
Cboe Global Markets, Inc. exhibits robust profitability with a net margin of 23.33% and a return on equity of 21.41%. Its return on invested capital (ROIC) stands at 15.31%, comfortably exceeding the weighted average cost of capital (WACC) of 5.14%, confirming the company as a clear value creator. Operational efficiency is strong, supported by a favorable gross margin of 48.93% and an EBIT margin of 32.12%. These metrics underscore sustainable competitive advantages and efficient capital allocation.
Weaknesses and Drawbacks
The company’s valuation presents notable concerns. A price-to-book ratio of 5.11 signals potential overvaluation relative to net assets, posing a risk if market sentiment shifts. Although the price-to-earnings ratio is neutral at 23.89, it remains elevated compared to the broader market. Leverage metrics are favorable, with a debt-to-equity ratio of 0.33 and a current ratio of 1.87, indicating solid liquidity. Market activity is strongly buyer dominant recently, mitigating near-term selling pressure risks.
Our Final Verdict about Cboe Global Markets, Inc.
Cboe Global Markets, Inc. shows a solid long-term fundamental profile with a bullish overall trend and strong recent buyer dominance. The company’s value-creating ability and efficient profitability metrics suggest an attractive profile for long-term exposure. However, valuation concerns warrant caution; prospective investors might consider timing their entry to mitigate premium pricing risks.
Disclaimer: This content is for informational purposes only and does not constitute financial, investment, or other professional advice. Investing in financial markets involves a significant risk of loss, and past performance is not indicative of future results.
Additional Resources
- Decoding Cboe Global Markets Inc (CBOE): A Strategic SWOT Insigh – GuruFocus (Feb 21, 2026)
- Is Wall Street Bullish or Bearish on Cboe Global Markets Stock? – Yahoo Finance (Feb 17, 2026)
- Cboe Global Markets (NASDAQ:CBOE) Director Sells $428,040.00 in Stock – MarketBeat (Feb 20, 2026)
- Cboe Global Markets Declares First-Quarter 2026 Dividend – PR Newswire (Feb 13, 2026)
- Cboe Global Markets stock hits all-time high at 283.17 USD – Investing.com (Feb 17, 2026)
For more information about Cboe Global Markets, Inc., please visit the official website: cboe.com