Home > Analyses > Industrials > Caterpillar Inc.
Caterpillar Inc. builds the backbone of global infrastructure with its rugged construction and mining machinery. Its iconic heavy equipment, from excavators to diesel engines, powers industries shaping cities and resources worldwide. Caterpillar commands industry leadership through cutting-edge innovation and a reputation for durable, high-performance products. As global demand fluctuates, I explore whether Caterpillar’s solid fundamentals justify its premium valuation and growth prospects in 2026.
Table of contents
Business Model & Company Overview
Caterpillar Inc., founded in 1925 and headquartered in Deerfield, Illinois, dominates the agricultural machinery sector. It offers a cohesive ecosystem of construction, mining, and energy equipment, including excavators, loaders, and turbines. This integrated product suite supports infrastructure development and resource extraction worldwide, positioning Caterpillar as a cornerstone in heavy machinery.
The company’s revenue engine balances hardware sales with software-enabled fleet management and financing solutions. Caterpillar strategically spans the Americas, Europe, and Asia, serving diverse industrial needs. Its broad portfolio and financial services create a resilient, competitive advantage that shapes global infrastructure and energy markets for decades to come.
Financial Performance & Fundamental Metrics
I will analyze Caterpillar Inc.’s income statement, key financial ratios, and dividend payout policy to assess its core financial health and shareholder value.
Income Statement
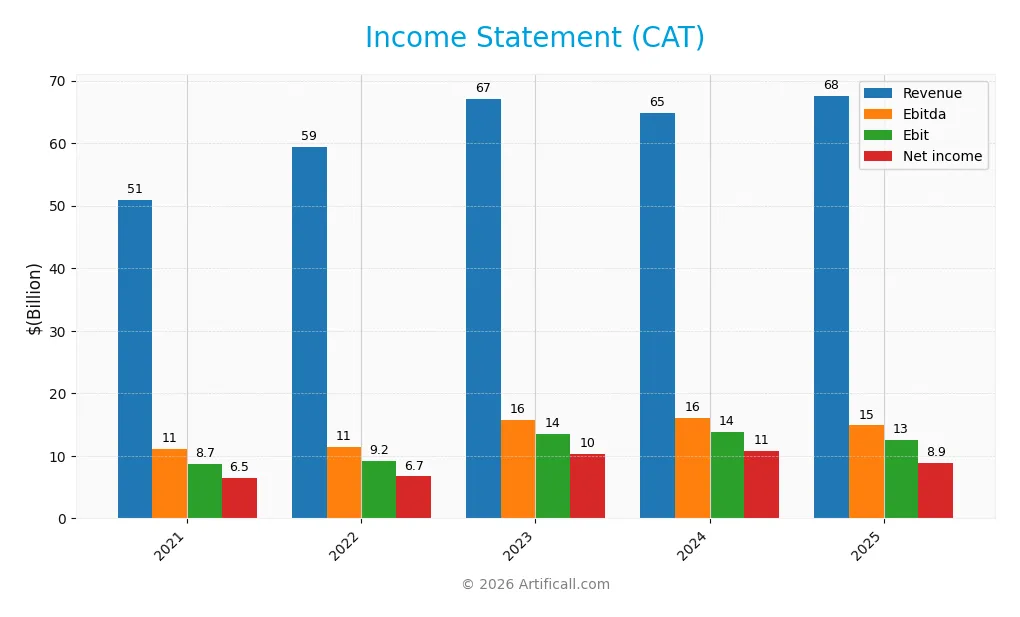
The following table summarizes Caterpillar Inc.’s key income statement figures for fiscal years 2021 through 2025, in USD.
| 2021 | 2022 | 2023 | 2024 | 2025 | |
|---|---|---|---|---|---|
| Revenue | 51B | 59.4B | 67.1B | 64.8B | 67.6B |
| Cost of Revenue | 36B | 41.9B | 43.8B | 41.5B | 45.7B |
| Operating Expenses | 8.13B | 9.61B | 10.3B | 10.3B | 10.6B |
| Gross Profit | 15B | 17.5B | 23.3B | 23.3B | 21.9B |
| EBITDA | 11B | 11.4B | 15.7B | 16B | 14.9B |
| EBIT | 8.7B | 9.2B | 13.6B | 13.9B | 12.6B |
| Interest Expense | 485M | 443M | 511M | 512M | 1.03B |
| Net Income | 6.49B | 6.7B | 10.3B | 10.8B | 8.87B |
| EPS | 11.93 | 12.73 | 20.24 | 22.17 | 18.9 |
| Filing Date | 2022-02-16 | 2023-02-15 | 2024-02-16 | 2025-02-14 | 2026-02-13 |
Income Statement Evolution
From 2021 to 2025, Caterpillar’s revenue rose 33% overall, reflecting steady growth. However, revenue growth slowed to 4.3% in 2025. Gross profit declined 6.3% in 2025, causing a margin contraction despite stable expenses. Net income grew 37% over the full period but dropped 21% in margin last year, indicating margin pressure amid sales expansion.
Is the Income Statement Favorable?
In 2025, Caterpillar maintained a solid 32.3% gross margin and an 18.6% EBIT margin, both favorable by industry standards. Interest expense remained low at 1.5% of revenue, supporting net margin of 13.1%. Despite a recent decline in net income and EPS, the overall fundamentals remain favorable. The income statement shows resilience amid cost challenges and moderate top-line growth.
Financial Ratios
The following table presents key financial ratios for Caterpillar Inc. over the fiscal years 2021 to 2025, offering insight into profitability, liquidity, leverage, and efficiency:
| Ratios | 2021 | 2022 | 2023 | 2024 | 2025 |
|---|---|---|---|---|---|
| Net Margin | 13% | 11% | 15% | 17% | 13% |
| ROE | 39% | 42% | 53% | 55% | 42% |
| ROIC | 8% | 10% | 15% | 16% | 11% |
| P/E | 17.3 | 18.8 | 14.6 | 16.4 | 30.1 |
| P/B | 6.8 | 8.0 | 7.7 | 9.1 | 12.5 |
| Current Ratio | 1.46 | 1.39 | 1.35 | 1.42 | 1.44 |
| Quick Ratio | 0.99 | 0.87 | 0.87 | 0.89 | 0.94 |
| D/E | 2.29 | 2.33 | 1.94 | 1.97 | 2.03 |
| Debt-to-Assets | 46% | 45% | 43% | 44% | 44% |
| Interest Coverage | 14.2 | 17.8 | 25.4 | 25.5 | 10.9 |
| Asset Turnover | 0.62 | 0.73 | 0.77 | 0.74 | 0.69 |
| Fixed Asset Turnover | 4.2 | 4.9 | 5.3 | 4.9 | 4.5 |
| Dividend Yield | 2.1% | 1.9% | 1.7% | 1.5% | 1.0% |
Evolution of Financial Ratios
From 2021 to 2025, Caterpillar’s Return on Equity (ROE) improved significantly, peaking at 41.6% in 2025. The Current Ratio remained stable around 1.4, indicating consistent liquidity. Meanwhile, the Debt-to-Equity Ratio fluctuated but remained elevated above 2, signaling persistent leverage. Profitability showed strength with net margins expanding in 2025 after prior fluctuations.
Are the Financial Ratios Favorable?
In 2025, profitability ratios such as ROE (41.6%) and net margin (13.1%) are favorable, outperforming many industrial peers. Liquidity ratios, including Current (1.44) and Quick (0.94), are neutral, reflecting balanced short-term financial health. Leverage remains unfavorable with a Debt-to-Equity ratio above 2. Market valuation ratios (P/E at 30.1 and P/B at 12.5) appear stretched. Overall, the financial profile is slightly favorable given mixed signals across categories.
Shareholder Return Policy
Caterpillar maintains a consistent dividend payout ratio around 25-36%, with a dividend yield near 1-2%. The company’s dividend per share has steadily increased from $4.29 in 2021 to $5.89 in 2025, supported by strong free cash flow coverage.
Share buybacks are part of the capital return strategy, complementing dividends. The payout appears sustainable given coverage by operating cash flow and free cash flow. This disciplined approach balances shareholder returns with financial prudence, supporting long-term value creation.
Score analysis
The following radar chart displays Caterpillar Inc.’s key financial scores for a comprehensive overview:
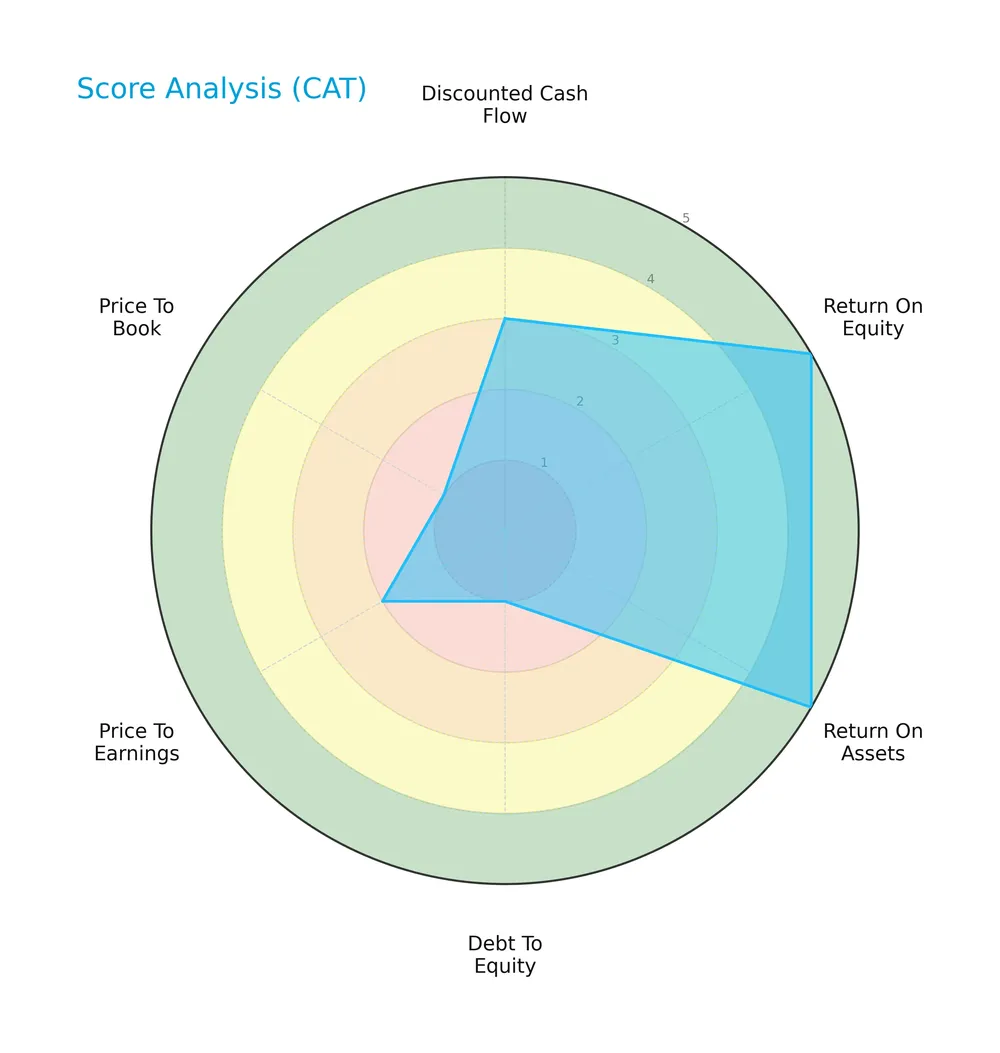
Caterpillar shows very favorable returns on equity and assets, scoring 5 in both. However, its debt-to-equity, price-to-earnings, and price-to-book ratios are unfavorable or very unfavorable, indicating valuation and leverage concerns.
Analysis of the company’s bankruptcy risk
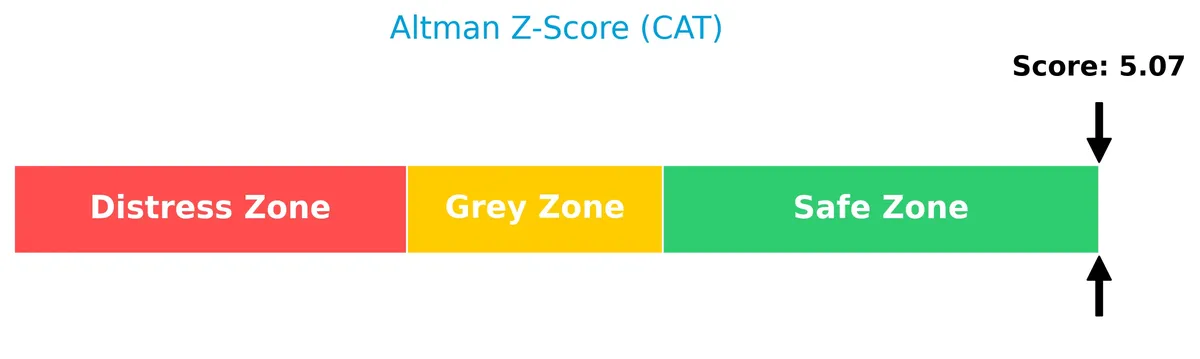
Caterpillar’s Altman Z-Score places it firmly in the safe zone, indicating a low risk of bankruptcy and strong financial stability:
Is the company in good financial health?
The Piotroski Score chart reflects Caterpillar’s financial strength based on key accounting criteria:
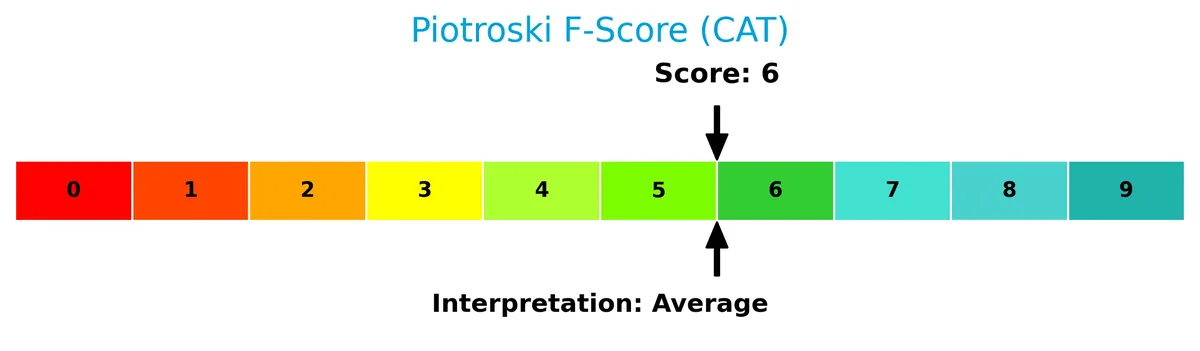
With a score of 6, Caterpillar ranks as average in financial health, suggesting moderate strength but room for improvement in profitability, liquidity, or efficiency metrics.
Competitive Landscape & Sector Positioning
This sector analysis explores Caterpillar Inc.’s strategic positioning, revenue segments, and key products. I will assess whether Caterpillar holds a competitive advantage over its main competitors.
Strategic Positioning
Caterpillar maintains a diversified product portfolio across Construction, Resource, Energy & Transportation, and Financial Products. Geographically, it generates significant revenue from North America (36.6B), EMEA (12.8B), Asia Pacific (11.2B), and Latin America (7B), reflecting broad international exposure.
Revenue by Segment
The pie chart displays Caterpillar Inc.’s revenue distribution by segment for fiscal year 2025, highlighting the relative size of each business area within total sales.
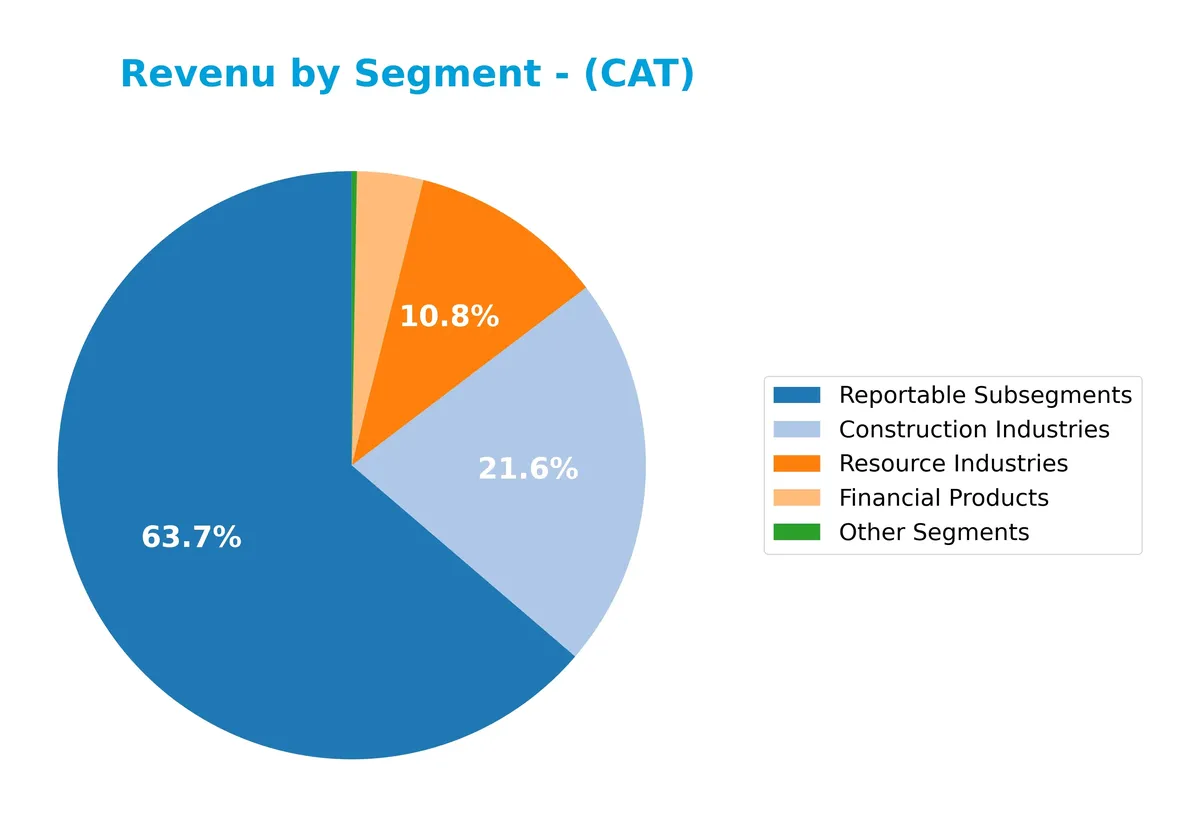
In 2025, Construction Industries dominates with $25.1B, remaining the core revenue driver despite slight decline from prior years. Resource Industries contributes $12.5B, showing stability. Financial Products at $4.2B supports business diversification. Notably, Power & Energy shows a negative figure, signaling restructuring or divestment. This shift concentrates revenue in core industrial segments, raising concentration risk but clarifying Caterpillar’s strategic focus.
Key Products & Brands
Below is an overview of Caterpillar Inc.’s main products and brands by segment:
| Product | Description |
|---|---|
| Construction Industries | Equipment including asphalt pavers, backhoe loaders, compactors, excavators, motorgraders, skid steer loaders, telehandlers, and utility vehicles. |
| Resource Industries | Mining equipment such as electric rope shovels, draglines, hydraulic shovels, rotary drills, mining trucks, off-highway trucks, and autonomous ready vehicles. |
| Energy & Transportation | Reciprocating engines, generator sets, turbines, remanufactured engines, diesel-electric locomotives, and related components for marine, oil and gas, industrial, and electric power sectors. |
| Financial Products | Operating and finance leases, installment sale contracts, working capital loans, wholesale financing plans, and insurance and risk management products. |
| Other Segments | Manufacturing of filters, fluids, undercarriage parts, and ground engaging tools. |
Caterpillar’s portfolio spans heavy machinery for construction, mining, and energy sectors, supported by integrated financial and aftermarket services. This diversified product mix underpins its industrial leadership.
Main Competitors
There are 5 competitors in total, with the table below listing the top 5 leaders by market capitalization:
| Competitor | Market Cap. |
|---|---|
| Caterpillar Inc. | 280B |
| Deere & Company | 126B |
| PACCAR Inc | 59B |
| Hyster-Yale Materials Handling, Inc. | 527M |
| Columbus McKinnon Corporation | 496M |
Caterpillar Inc. ranks 1st among its competitors with a market cap 29% above the top player benchmark. It stands well above both the average market cap of the top 10 (93B) and the median in its sector (59B). The company’s lead over its closest competitor, Deere & Company, is substantial, highlighting Caterpillar’s dominant position.
Comparisons with competitors
Check out how we compare the company to its competitors:
Does CAT have a competitive advantage?
Caterpillar currently does not demonstrate a clear competitive advantage, as its ROIC remains below WACC, indicating value shedding despite a growing profitability trend. The company’s income statement shows favorable margins but mixed recent growth metrics, reflecting operational challenges.
Looking ahead, Caterpillar’s broad product range and global footprint across construction, mining, and energy sectors provide opportunities to capture new markets. Continued innovation in autonomous vehicles and mining solutions may support future value creation amid evolving industry demands.
SWOT Analysis
This analysis highlights Caterpillar Inc.’s key internal and external factors, guiding strategic focus.
Strengths
- Strong market position in construction and mining equipment
- Robust ROE at 41.6% indicating efficient capital use
- Diverse global revenue streams with growth in North America
Weaknesses
- High debt-to-equity ratio of 2.03 signals financial leverage risk
- Elevated P/E and P/B ratios may deter value investors
- Recent declines in gross profit and net margin growth
Opportunities
- Expansion in emerging markets like Latin America and Asia Pacific
- Increasing demand for autonomous and electric machinery
- Growth in infrastructure investments globally
Threats
- Cyclical industry exposure to economic downturns
- Rising raw material costs impacting margins
- Intensifying competition from global and regional players
Caterpillar’s strengths lie in its market dominance and capital efficiency, but leverage and valuation raise caution. Growth opportunities in emerging markets and technology adoption can offset cyclical risks, demanding prudent capital allocation and margin management.
Stock Price Action Analysis
The weekly stock chart illustrates Caterpillar Inc.’s price dynamics over the last 100 weeks, highlighting key peaks and troughs:
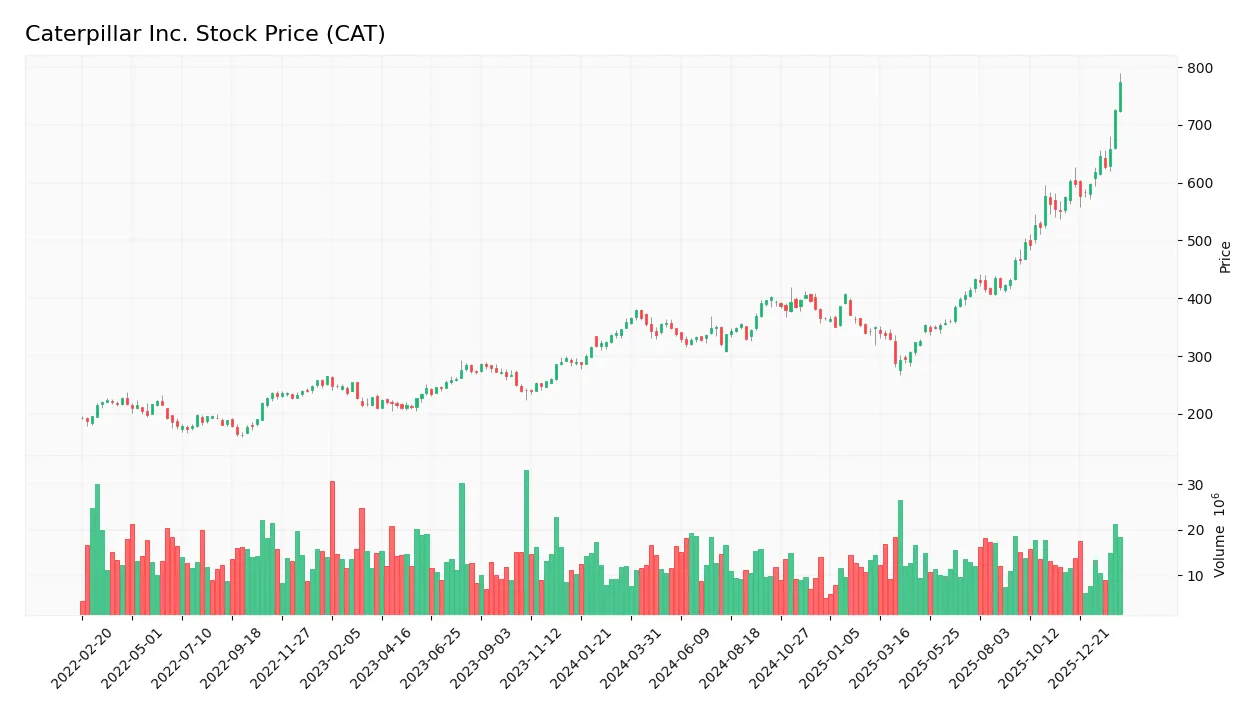
Trend Analysis
Over the past 12 months, Caterpillar’s stock surged 116.19%, confirming a strong bullish trend with accelerating momentum. Price volatility remains elevated, reflected by a standard deviation of 101.58. The stock ranged between a low of 288.08 and a high of 774.2, signaling pronounced upside movement.
Volume Analysis
Trading volumes total 1.57B shares, with buyers accounting for 60%, indicating buyer-driven activity. However, volume is decreasing overall, suggesting waning market participation despite sustained bullish investor sentiment. In the recent period, buyer dominance strengthened to 74%, reinforcing positive conviction.
Target Prices
Analysts present a robust target consensus for Caterpillar Inc., reflecting solid confidence in its growth potential.
| Target Low | Target High | Consensus |
|---|---|---|
| 425 | 805 | 687.23 |
The target range from 425 to 805 indicates varied optimism, with the consensus near 687 signaling a strong upward bias among experts.

Don’t Let Luck Decide Your Entry Point
Optimize your entry points with our advanced ProRealTime indicators. You’ll get efficient buy signals with precise price targets for maximum performance. Start outperforming now!
Analyst & Consumer Opinions
I present a detailed analysis of Caterpillar Inc. (CAT) grades and consumer feedback to evaluate market sentiment.
Stock Grades
Here are the latest verified grades for Caterpillar Inc. from recognized financial institutions:
| Grading Company | Action | New Grade | Date |
|---|---|---|---|
| Morgan Stanley | Downgrade | Underweight | 2024-10-14 |
| JP Morgan | Maintain | Overweight | 2024-10-14 |
| Truist Securities | Maintain | Buy | 2024-10-09 |
| Citigroup | Maintain | Buy | 2024-10-09 |
| B of A Securities | Maintain | Buy | 2024-09-30 |
| Evercore ISI Group | Maintain | In Line | 2024-08-19 |
| Barclays | Maintain | Equal Weight | 2024-08-07 |
| B of A Securities | Maintain | Buy | 2024-08-07 |
| Truist Securities | Maintain | Buy | 2024-08-07 |
| UBS | Maintain | Sell | 2024-08-07 |
Most analysts maintain a positive stance, with numerous Buy ratings. However, Morgan Stanley’s recent downgrade and UBS’s Sell rating highlight some caution among experts. The consensus remains Buy, reflecting moderate optimism.
Consumer Opinions
Caterpillar Inc. consistently earns respect for its robust machinery and reliable service, but some users express concerns over cost and maintenance.
| Positive Reviews | Negative Reviews |
|---|---|
| Durable equipment withstands tough job sites. | High repair costs strain small contractors. |
| Excellent dealer support and parts availability. | Machinery downtime impacts project timelines. |
| Strong resale value preserves investment worth. | Initial purchase price is steep for many buyers. |
Overall, consumers praise Caterpillar’s durability and dealer network. However, the high total cost of ownership and occasional downtime remain notable pain points.
Risk Analysis
Below is a summary table outlining key risks faced by Caterpillar Inc., including their likelihood and potential impact:
| Category | Description | Probability | Impact |
|---|---|---|---|
| Market Volatility | High beta (1.55) exposes CAT to significant market swings. | High | Medium |
| Leverage Risk | Debt-to-equity ratio above 2 signals elevated financial risk. | Medium | High |
| Valuation | Elevated P/E (30.1) and P/B (12.5) ratios suggest overvaluation. | Medium | Medium |
| Liquidity | Current ratio at 1.44 is adequate but quick ratio below 1 warns of liquidity tightness. | Low | Medium |
| Sector Cyclicality | Construction and mining sectors are highly cyclical and sensitive to economic downturns. | High | High |
| Interest Rates | Favorable interest coverage (12.2) mitigates risk, but rising rates could pressure costs. | Low | Medium |
The most pressing risks are Caterpillar’s high leverage and sector cyclicality. Historically, industrial machinery firms endure sharp profit contractions during recessions, magnified by CAT’s above-average debt. Its high beta further amplifies stock volatility amid economic uncertainty. While valuation metrics signal caution, strong profitability and a safe Altman Z-score (5.07) provide a buffer. Investors should remain vigilant about macroeconomic cycles and debt management.
Should You Buy Caterpillar Inc.?
Caterpillar appears to be improving profitability with a slightly favorable moat, reflecting growing operational efficiency despite shedding value relative to WACC. Its leverage profile seems substantial, posing risks, while the overall B rating suggests a very favorable, yet cautious, investment profile.
Strength & Efficiency Pillars
Caterpillar Inc. demonstrates robust profitability with a net margin of 13.13% and a strong return on equity at 41.62%. Its return on invested capital (ROIC) stands at 11.42%, comfortably above the weighted average cost of capital (WACC) of 10.08%, confirming the company as a clear value creator. These metrics reflect efficient capital allocation and operational effectiveness. Additionally, a favorable interest coverage ratio of 12.23 underscores its ability to service debt without straining earnings.
Weaknesses and Drawbacks
Despite operational strengths, Caterpillar faces valuation challenges with a high price-to-earnings ratio of 30.12 and price-to-book ratio of 12.54, indicating a premium market valuation that may pressure future upside. The company’s debt-to-equity ratio of 2.03 signals elevated leverage, raising risks if cash flows falter. While liquidity ratios are neutral, this leverage level demands caution. Investors should also consider that despite a strong buyer dominance of 73.97% recently, overall volume is decreasing, which could limit near-term momentum.
Our Final Verdict about Caterpillar Inc.
Caterpillar presents a fundamentally solid profile with clear value creation and operational efficiency. Its bullish long-term trend, combined with strong recent buyer dominance, suggests positive momentum. However, the elevated valuation and leverage introduce risk factors. This profile could appeal to investors seeking growth with moderate risk but may advise a measured entry given the premium pricing and capital structure.
Disclaimer: This content is for informational purposes only and does not constitute financial, investment, or other professional advice. Investing in financial markets involves a significant risk of loss, and past performance is not indicative of future results.
Additional Resources
- CATERPILLAR INC. (CAT) – MSN (Feb 11, 2026)
- Are Wall Street Analysts Predicting Caterpillar Stock Will Climb or Sink? – Yahoo Finance (Feb 10, 2026)
- CATERPILLAR INC SEC 10-K Report – TradingView (Feb 13, 2026)
- Caterpillar Inc. $CAT Stock Holdings Decreased by Atria Investments Inc – MarketBeat (Feb 13, 2026)
- Deep-Dive Research Report: Caterpillar Inc. (CAT) – The Yellow Iron Giant in the AI Era – FinancialContent (Feb 12, 2026)
For more information about Caterpillar Inc., please visit the official website: caterpillar.com