Home > Analyses > Consumer Cyclical > Carvana Co.
Carvana transforms how Americans buy used cars by turning a traditionally cumbersome process into a seamless online experience. It leads the auto dealership industry with its innovative e-commerce platform, combining vehicle inspection, financing, and delivery into one streamlined service. Known for disrupting the market, Carvana redefines convenience and transparency in car buying. As competition intensifies, I ask whether its current fundamentals justify its premium valuation and growth ambitions.

Table of contents
Business Model & Company Overview
Carvana Co., founded in 2012 and headquartered in Tempe, Arizona, leads the U.S. Auto – Dealerships industry with a disruptive e-commerce platform. It integrates vehicle acquisition, inspection, reconditioning, financing, and logistics into a seamless online car-buying ecosystem. This cohesive model redefines how used cars reach consumers, combining convenience with a distinctive fulfillment experience.
The company’s revenue engine balances vehicle sales with financing and complementary services, fueling growth across the Americas. Its nationwide logistics network and auction sites create a robust supply chain and customer support system. Carvana’s competitive advantage lies in its scalable platform and brand recognition, positioning it as a vital force shaping the future of automotive retail.
Financial Performance & Fundamental Metrics
I analyze Carvana Co.’s income statement, key financial ratios, and dividend payout policy to assess its profitability, efficiency, and shareholder returns.
Income Statement
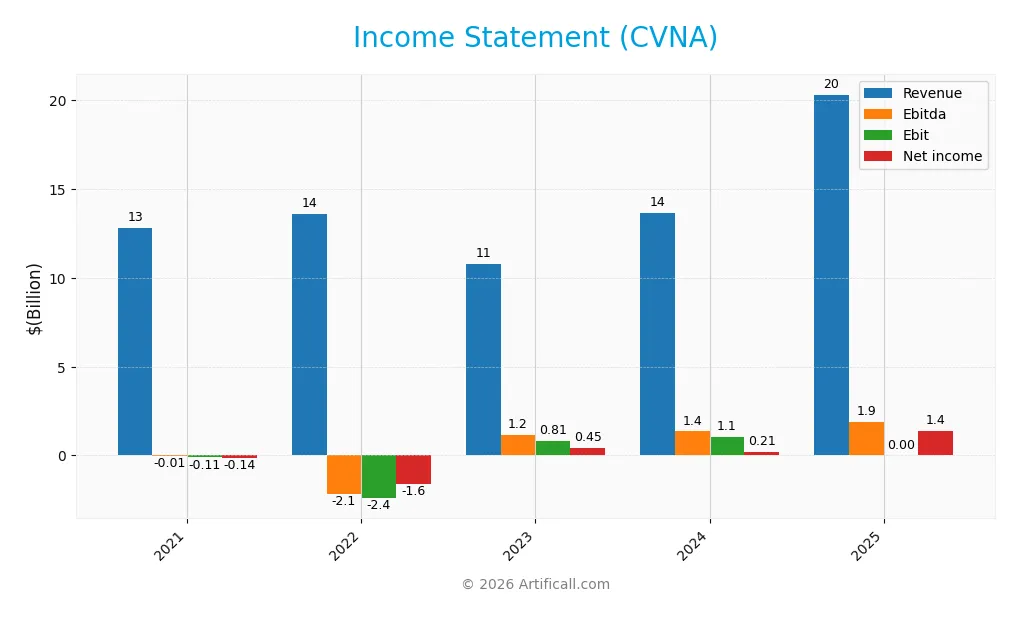
Below is Carvana Co.’s income statement summary for the past five fiscal years, showing key profitability and operational metrics.
| 2021 | 2022 | 2023 | 2024 | 2025 | |
|---|---|---|---|---|---|
| Revenue | 12.8B | 13.6B | 10.8B | 13.7B | 20.3B |
| Cost of Revenue | 11.0B | 12.6B | 9.0B | 11.0B | 16.1B |
| Operating Expenses | 1.9B | 2.5B | 1.8B | 1.7B | 2.3B |
| Gross Profit | 1.8B | 1.0B | 1.7B | 2.7B | 4.2B |
| EBITDA | -5M | -2.1B | 1.2B | 1.4B | 1.9B |
| EBIT | -110M | -2.4B | 807M | 1.1B | 0 |
| Interest Expense | 176M | 486M | 632M | 651M | 505M |
| Net Income | -135M | -1.6B | 450M | 210M | 1.4B |
| EPS | -1.63 | -15.74 | 4.12 | 1.72 | 10.22 |
| Filing Date | 2022-02-24 | 2023-02-23 | 2024-02-22 | 2025-02-19 | 2026-02-18 |
Income Statement Evolution
Carvana’s revenue rose sharply by 59% from 2021 to 2025, with a notable 49% jump in the last year alone. Gross profit expanded even faster, improving gross margin to 20.6%. Operating expenses scaled proportionally to revenue growth. Despite a collapse in EBIT growth last year, net income surged, lifting net margin significantly over the period.
Is the Income Statement Favorable?
In 2025, Carvana generated $20.3B revenue and $1.41B net income, yielding a 6.9% net margin. Interest expense remained manageable at 2.5% of revenue, supporting profitability. However, EBIT stood at zero, reflecting operational challenges despite positive EBITDA. Overall, fundamentals appear favorable with strong top-line growth and improving profitability, yet the flat EBIT margin signals caution.
Financial Ratios
The table below presents key financial ratios for Carvana Co. (CVNA) over the last five fiscal years, illustrating profitability, liquidity, leverage, and valuation metrics:
| Ratios | 2021 | 2022 | 2023 | 2024 | 2025 |
|---|---|---|---|---|---|
| Net Margin | -1.1% | -11.7% | 4.2% | 1.5% | 6.9% |
| ROE | -44.1% | 306.4% | 185.2% | 16.7% | 40.9% |
| ROIC | -1.6% | -19.0% | -1.1% | 13.3% | -33.6% |
| P/E | -142.2 | -0.3 | 12.9 | 118.5 | 41.3 |
| P/B | 62.7 | -0.9 | 23.8 | 19.7 | 16.9 |
| Current Ratio | 1.69 | 1.77 | 2.16 | 3.64 | 4.31 |
| Quick Ratio | 0.60 | 1.05 | 1.41 | 2.44 | 2.73 |
| D/E | 18.9 | -17.0 | 27.6 | 4.80 | 0.18 |
| Debt-to-Assets | 82.3% | 101.4% | 94.8% | 71.3% | 4.8% |
| Interest Coverage | -0.59 | -3.07 | -0.13 | 1.54 | 3.72 |
| Asset Turnover | 1.83 | 1.56 | 1.52 | 1.61 | 1.54 |
| Fixed Asset Turnover | 6.64 | 3.60 | 3.13 | 4.26 | 6.24 |
| Dividend Yield | 0% | 0% | 0% | 0% | 0% |
Evolution of Financial Ratios
Return on Equity (ROE) surged to 40.9% in 2025, reflecting improved profitability. The Current Ratio expanded notably to 4.31, indicating a stronger liquidity position. Debt-to-Equity Ratio sharply declined to 0.18, signaling reduced leverage. Overall, profitability stabilized with net margins steady near 6.9%, showing consistent earnings quality.
Are the Financial Ratios Fovorable?
Profitability shows strength in ROE but weakness in ROIC, which is negative and below WACC at 20.7%. Liquidity is mixed: quick ratio is favorable at 2.73, but current ratio is overly high at 4.31, suggesting inefficient asset use. Leverage metrics, including debt-to-equity at 0.18 and debt-to-assets at 4.8%, are favorable. Market valuation ratios like P/E (41.3) and P/B (16.9) appear stretched. The overall ratio profile is slightly unfavorable.
Shareholder Return Policy
Carvana Co. (CVNA) does not pay dividends, reflecting its focus on reinvestment and growth rather than immediate shareholder payouts. The company’s dividend payout ratio and yield remain at zero, aligning with a strategy prioritizing operational cash flow and capital expenditure coverage.
Although CVNA does not distribute dividends, it engages in share buybacks to return value to shareholders. This approach supports long-term value creation, provided free cash flow remains sufficient to cover capital needs without risking financial stability.
Score analysis
The radar chart below illustrates key valuation and financial performance metrics for Carvana Co.:
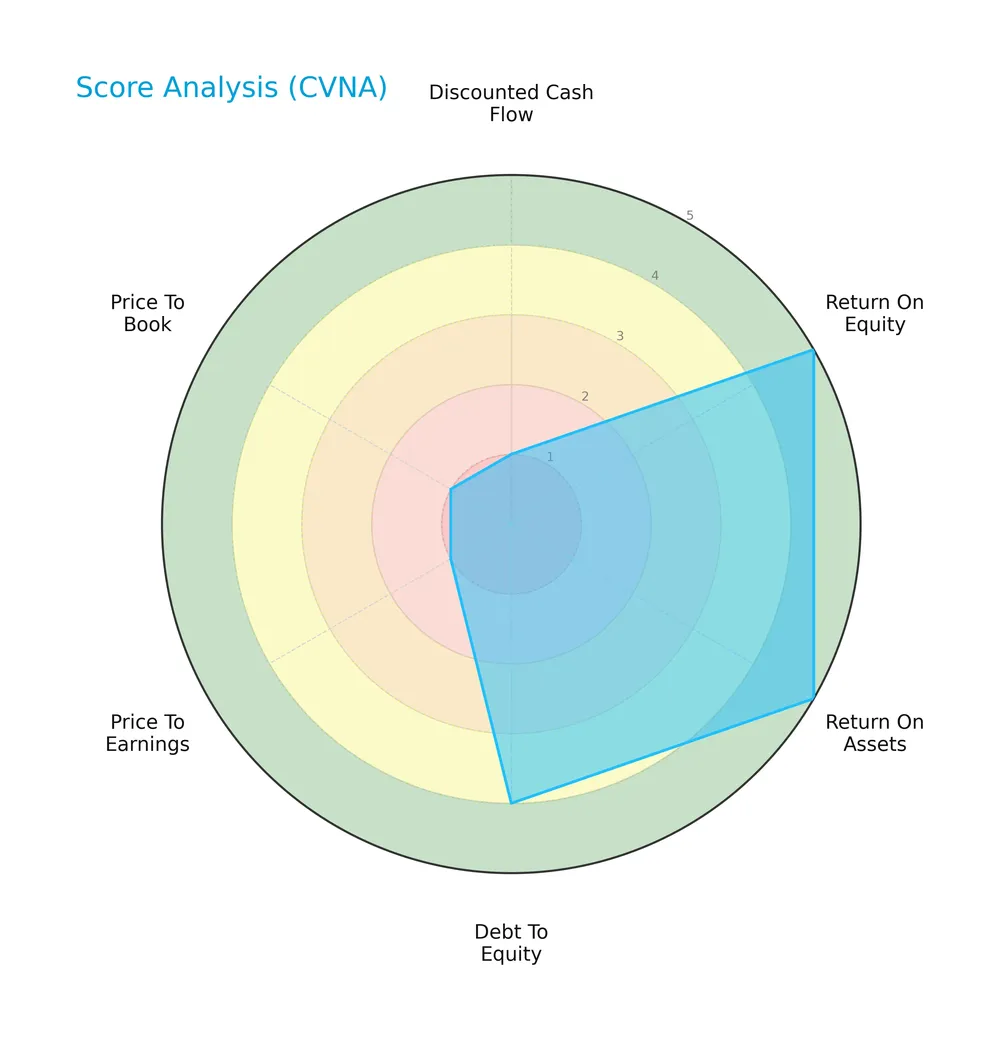
Carvana scores very favorably on return on equity and assets, indicating efficient profitability. Its debt-to-equity ratio is also favorable. However, discounted cash flow, price-to-earnings, and price-to-book scores are very unfavorable, reflecting valuation concerns.
Analysis of the company’s bankruptcy risk
Carvana’s Altman Z-Score places it comfortably in the safe zone, signaling a low risk of bankruptcy:

Is the company in good financial health?
The Piotroski Score diagram provides insight into Carvana’s overall financial strength:

A score of 6 suggests average financial health, indicating the company demonstrates moderate strength across profitability, leverage, liquidity, and efficiency metrics.
Competitive Landscape & Sector Positioning
This analysis examines Carvana Co.’s strategic positioning, revenue segments, key products, competitors, and strengths. I will assess whether Carvana holds a competitive advantage within the auto dealership sector.
Strategic Positioning
Carvana Co. focuses primarily on used vehicle sales in the U.S., with 2025 revenue of $14.5B from this segment. Other products and services contribute $1.7B, indicating some diversification but strong concentration in online used car retailing.
Revenue by Segment
This pie chart illustrates Carvana Co.’s revenue breakdown by segment for fiscal year 2025, highlighting the contributions of Used Vehicle Sales and other product/service lines.
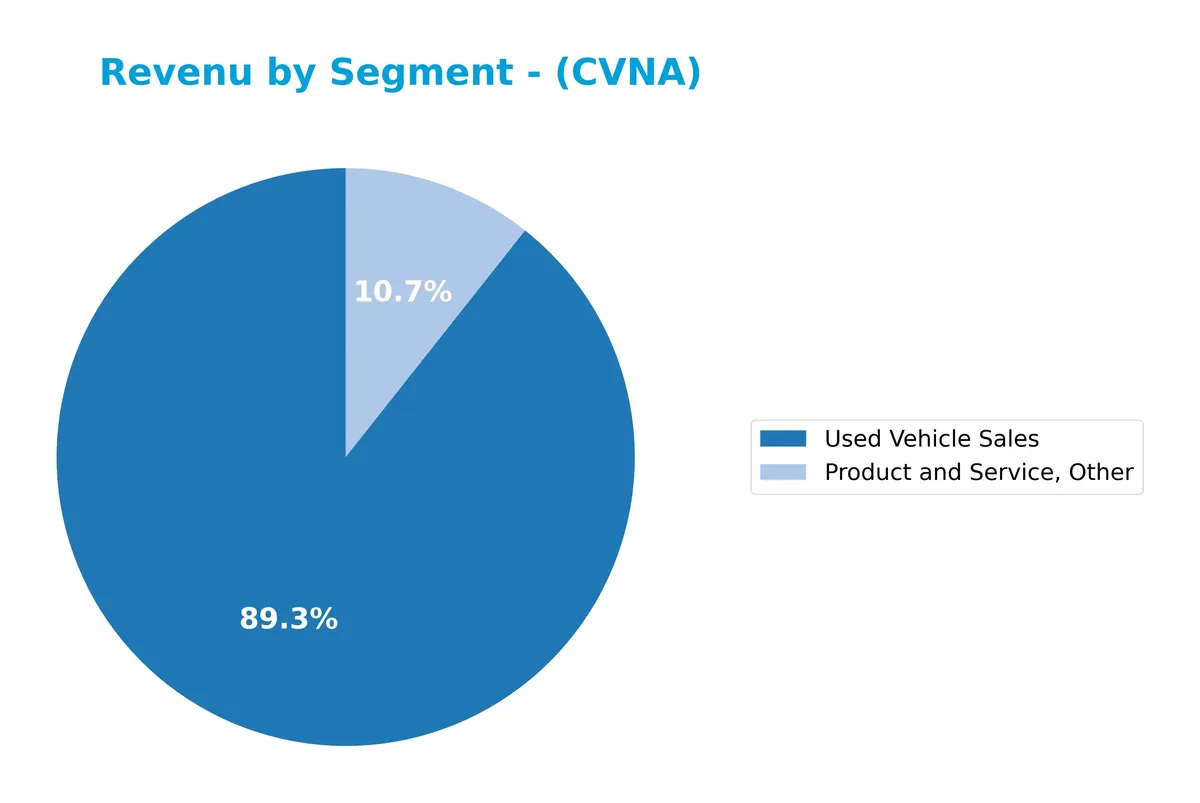
Used Vehicle Sales dominate Carvana’s revenue, reaching $14.5B in 2025, up sharply from $9.7B in 2024. The Product and Service, Other segment also expanded robustly to $1.7B, signaling diversification. Wholesale Vehicle Sales disappeared from the latest data, suggesting a strategic shift or discontinuation. The 2025 acceleration in core sales underscores Carvana’s growing market penetration but also raises concentration risk on the used vehicle segment.
Key Products & Brands
The following table summarizes Carvana Co.’s primary products and services by type and description:
| Product | Description |
|---|---|
| Used Vehicle Sales | Sale of used cars via an e-commerce platform, forming the company’s primary revenue source. |
| Product and Service, Other | Includes vehicle inspection, reconditioning, financing, logistics, and post-sale customer support. |
| Wholesale Vehicle Sales | Sales of vehicles through auction sites, contributing to secondary revenue streams. |
Carvana’s revenue heavily depends on used vehicle sales, with complementary services enhancing the customer experience and operational efficiency. Wholesale sales add a smaller but relevant revenue component.
Main Competitors
There are 2 competitors in total; below are the top 10 leaders by market capitalization:
| Competitor | Market Cap. |
|---|---|
| Carvana Co. | 86.8B |
| Copart, Inc. | 36.6B |
Carvana Co. ranks 1st among its competitors with a market cap at 90.3% of the top player benchmark. The company sits above both the average market cap of the top 10 and the sector median, highlighting its strong scale. There is no competitor above it, and it leads Copart, Inc. by a wide margin of 114.4%.
Comparisons with competitors
Check out how we compare the company to its competitors:
Does CVNA have a competitive advantage?
Carvana Co. does not present a competitive advantage as it is destroying value with a declining ROIC well below its WACC, indicating inefficient capital use and decreasing profitability. Despite favorable revenue and net income growth, the company’s operating profit remains weak, reflecting challenges in sustaining returns.
Looking ahead, Carvana’s focus on its e-commerce platform and logistics network offers opportunities to expand market reach and improve customer experience. However, the very unfavorable moat status signals that these prospects face significant execution risks and competitive pressures in the auto dealership sector.
SWOT Analysis
This analysis highlights Carvana Co.’s internal strengths and weaknesses alongside external opportunities and threats shaping its strategic outlook.
Strengths
- strong revenue growth
- high net margin improvement
- low debt-to-assets ratio
Weaknesses
- negative ROIC vs. WACC signals value destruction
- unfavorable EBIT margin
- high valuation multiples (PE, PB)
Opportunities
- expanding e-commerce auto sales market
- scaling logistics network
- growing demand for used vehicles
Threats
- intense auto dealership competition
- rising interest rates impacting financing
- regulatory risks in online vehicle sales
Carvana’s robust growth and improving profitability contrast sharply with value destruction and stretched valuation. Strategic focus should prioritize operational efficiency and capital allocation to convert growth into sustainable returns while managing competitive and regulatory risks.
Stock Price Action Analysis
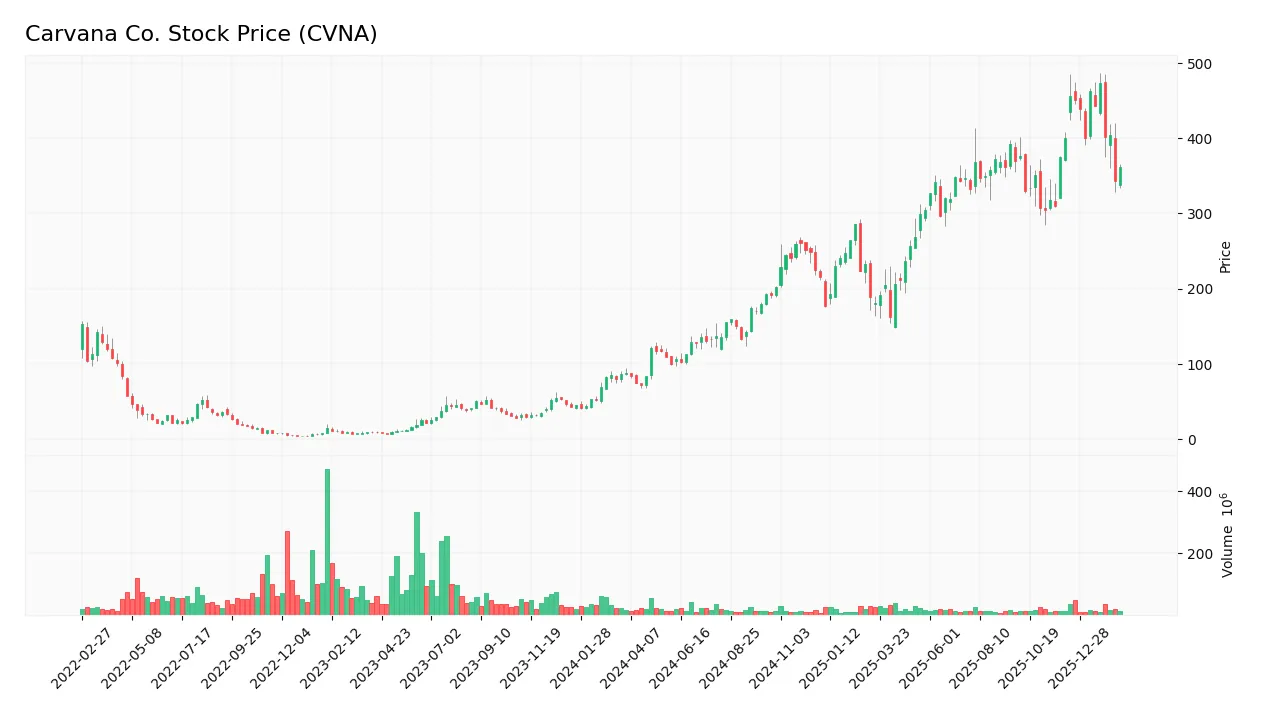
The weekly stock chart displays Carvana Co.’s price movements over the past 12 months, highlighting key fluctuations and trend shifts:
Trend Analysis
Over the past year, Carvana’s stock price surged 311.25%, indicating a strong bullish trend. Volatility remains high with a standard deviation of 106.37. The price peaked at 473.31 and bottomed at 71.36. Recently, from December 2025 to February 2026, the price fell 9.57%, showing a short-term bearish trend with decelerating momentum.
Volume Analysis
In the last three months, trading volume decreased despite higher total volumes annually. Buyer activity dropped to 44.07%, with sellers slightly dominating. This shift suggests cautious investor sentiment and reduced market participation amid recent price weakness.
Target Prices
Analysts present a bullish consensus for Carvana Co., reflecting strong confidence in its growth potential.
| Target Low | Target High | Consensus |
|---|---|---|
| 360 | 550 | 480.83 |
The target range spans from 360 to 550, with a consensus near 481, indicating robust upside expectations among industry analysts.

Don’t Let Luck Decide Your Entry Point
Optimize your entry points with our advanced ProRealTime indicators. You’ll get efficient buy signals with precise price targets for maximum performance. Start outperforming now!
Analyst & Consumer Opinions
This section examines Carvana Co.’s analyst ratings and consumer feedback to provide a balanced performance overview.
Stock Grades
Here are the latest verified stock grades from leading financial institutions for Carvana Co.:
| Grading Company | Action | New Grade | Date |
|---|---|---|---|
| JP Morgan | Maintain | Overweight | 2026-01-28 |
| Wells Fargo | Maintain | Overweight | 2026-01-27 |
| Barclays | Maintain | Overweight | 2026-01-21 |
| BTIG | Maintain | Buy | 2026-01-15 |
| UBS | Maintain | Buy | 2026-01-14 |
| B of A Securities | Maintain | Buy | 2026-01-13 |
| Evercore ISI Group | Maintain | In Line | 2025-12-23 |
| BTIG | Maintain | Buy | 2025-12-19 |
| Wedbush | Maintain | Outperform | 2025-12-19 |
| Citigroup | Maintain | Buy | 2025-12-12 |
The consensus reflects a generally positive stance with multiple “Buy” and “Overweight” grades maintained. A few firms hold a neutral “In Line” or “Hold” view, indicating moderate confidence amid some caution.
Consumer Opinions
Carvana Co. sparks mixed feelings among consumers, reflecting both its innovative edge and operational challenges.
| Positive Reviews | Negative Reviews |
|---|---|
| “Easy-to-use platform with a wide vehicle selection.” | “Delivery delays caused significant inconvenience.” |
| “Transparent pricing saved me negotiation hassle.” | “Customer service response times are inconsistent.” |
| “Hassle-free return policy gave me confidence.” | “Some vehicles arrived with unexpected damage.” |
Overall, consumers praise Carvana’s user-friendly experience and transparent pricing. However, delivery delays and inconsistent service quality remain persistent concerns.
Risk Analysis
The following table summarizes key risks Carvana Co. faces, categorized by likelihood and potential impact on performance:
| Category | Description | Probability | Impact |
|---|---|---|---|
| Market Volatility | High beta (3.57) indicates sensitivity to market swings. | High | High |
| Profitability | Negative ROIC (-33.63%) vs. high WACC (20.68%) signals value destruction risk. | Medium | High |
| Valuation | Elevated P/E (41.28) and P/B (16.88) ratios suggest overvaluation. | Medium | Medium |
| Liquidity | Strong current ratio (4.31) but zero interest coverage raises concerns about debt servicing. | Low | Medium |
| Dividend Policy | No dividend yield may deter income-focused investors. | Low | Low |
I emphasize market volatility and profitability risks as the most pressing. Carvana’s 3.57 beta implies it moves nearly 3.5 times the market volatility, amplifying downside in downturns. Its negative ROIC compared to a high cost of capital signals the company struggles to generate returns above its hurdle rate, which historically precedes valuation corrections in cyclical sectors like auto retail. Despite a strong liquidity cushion, zero interest coverage is a red flag for debt sustainability. These factors demand cautious allocation and close monitoring.
Should You Buy Carvana Co.?
Carvana Co. appears to have improving profitability and a manageable leverage profile, yet its competitive moat seems very unfavorable due to declining ROIC and value destruction. Supported by a B rating, the analytical interpretation suggests moderate financial health with notable risks.
Strength & Efficiency Pillars
Carvana Co. delivers solid profitability with a net margin of 6.92% and a strong return on equity of 40.89%. The firm maintains efficient asset use, demonstrated by an asset turnover of 1.54 and fixed asset turnover of 6.24. Despite an unfavorable ROIC of -33.63%, the Altman Z-Score of 7.67 places it safely in the “Safe Zone,” indicating sound solvency. Operational margins and revenue growth remain favorable, supporting a resilient core business.
Weaknesses and Drawbacks
Valuation metrics raise red flags. Carvana trades at a steep P/E of 41.28 and a P/B of 16.88, reflecting expensive market pricing. The current ratio of 4.31, despite seeming healthy, is flagged unfavorable, possibly indicating inefficiencies in asset management. Interest coverage stands at zero, signaling vulnerability to rising debt costs. Recent buyer dominance declined to 44.07%, hinting at short-term selling pressure, which could weigh on near-term price momentum.
Our Final Verdict about Carvana Co.
Carvana’s strong solvency and operational margins underpin a fundamentally stable profile. However, elevated valuation multiples and weakening short-term market demand suggest caution. Despite the bullish long-term trend, recent seller dominance signals a wait-and-see approach for a more favorable entry point. The company might appeal to investors seeking growth but could appear risky for conservative capital given current market dynamics.
Disclaimer: This content is for informational purposes only and does not constitute financial, investment, or other professional advice. Investing in financial markets involves a significant risk of loss, and past performance is not indicative of future results.
Additional Resources
- Carvana stock tumbles as profit metric misses the mark, outlook vague – Yahoo Finance (Feb 18, 2026)
- Carvana Stock Collapses After Q4 Earnings Fail To Impress – Benzinga (Feb 18, 2026)
- Carvana’s Q4 profitability loses traction, shares crater more than 20% (CVNA:NYSE) – Seeking Alpha (Feb 18, 2026)
- Carvana Co. (CVNA) Sustains Rapid Unit Growth as Lending Fears Ease – Yahoo Finance (Feb 17, 2026)
- Carvana (NYSE:CVNA) Beats Q4 CY2025 Sales Expectations But Stock Drops 20.6% – Yahoo Finance (Feb 18, 2026)
For more information about Carvana Co., please visit the official website: carvana.com