Home > Analyses > Consumer Cyclical > Carnival Corporation & plc
Carnival Corporation & plc transforms how millions experience travel by sea, connecting over 700 ports worldwide with its vast fleet. As the leisure travel titan, it commands a portfolio of iconic cruise brands that blend innovation, luxury, and adventure. Known for setting industry standards in quality and scale, Carnival shapes global tourism like few others. The critical question now is whether its financial strength and growth prospects justify its current valuation in a shifting travel landscape.

Table of contents
Business Model & Company Overview
Carnival Corporation & plc, founded in 1972 and headquartered in Miami, Florida, stands as a global leader in the leisure travel industry. It operates a cohesive ecosystem of 87 ships with 223,000 lower berths under renowned brands like Carnival Cruise Line, Princess Cruises, and Costa Cruises. This extensive portfolio connects travelers to around 700 ports worldwide, crafting memorable experiences across sea, land, and rail.
The company generates revenue through a balanced mix of ticket sales, onboard services, and exclusive travel packages sold via travel agents and digital platforms. Its strategic footprint spans the Americas, Europe, Asia, and Oceania, ensuring diversified market exposure. Carnival’s economic moat lies in its unmatched scale, brand diversity, and integrated service offerings, positioning it to shape the future of global leisure travel.
Financial Performance & Fundamental Metrics
I will analyze Carnival Corporation & plc’s income statement, key financial ratios, and dividend payout policy to assess its core financial health and value proposition.
Income Statement
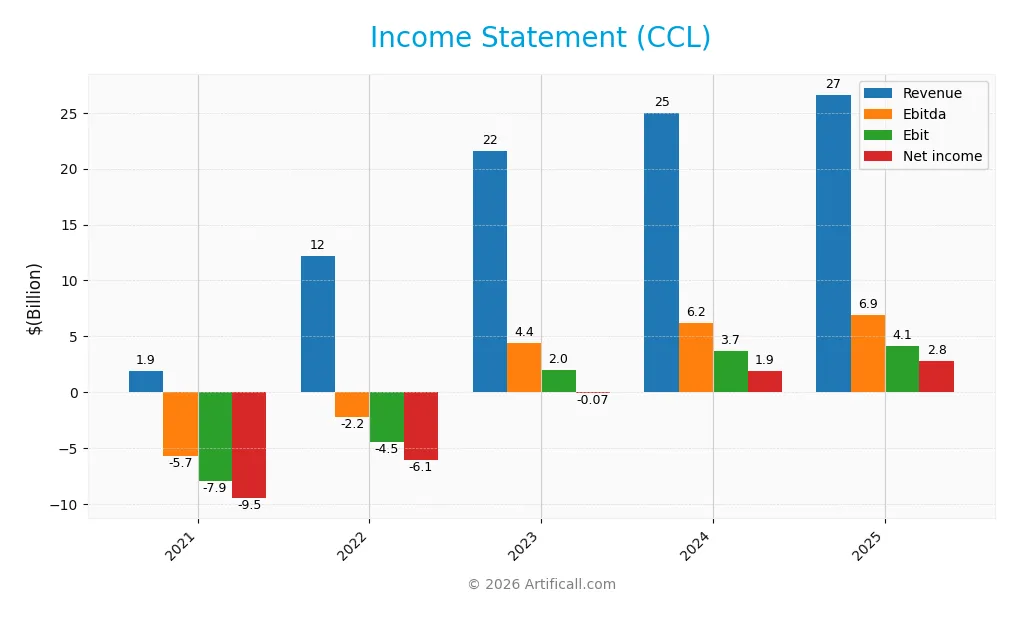
The table below summarizes Carnival Corporation & plc’s key income statement figures for fiscal years 2021 through 2025, showing revenue, expenses, profit, and earnings per share.
| 2021 | 2022 | 2023 | 2024 | 2025 | |
|---|---|---|---|---|---|
| Revenue | 1.91B | 12.17B | 21.59B | 25.02B | 26.62B |
| Cost of Revenue | 4.66B | 11.76B | 14.32B | 15.64B | 18.74B |
| Operating Expenses | 4.34B | 4.79B | 5.32B | 5.81B | 3.40B |
| Gross Profit | -2.75B | 412M | 7.28B | 9.38B | 7.89B |
| EBITDA | -5.69B | -2.20B | 4.37B | 6.23B | 6.91B |
| EBIT | -7.92B | -4.47B | 2.00B | 3.67B | 4.12B |
| Interest Expense | 1.60B | 1.61B | 2.07B | 1.76B | 1.35B |
| Net Income | -9.50B | -6.09B | -74M | 2.02B | 2.76B |
| EPS | -8.46 | -5.16 | -0.06 | 1.50 | 2.10 |
| Filing Date | 2022-01-27 | 2023-01-27 | 2024-01-26 | 2025-01-27 | 2026-01-27 |
Income Statement Evolution
Carnival Corporation’s revenue rose steadily from 1.9B in 2021 to 26.6B in 2025, a 1295% increase over five years. Net income improved dramatically from a 9.5B loss in 2021 to a 2.76B profit in 2025. Margins have generally improved, with gross margin at 29.6% and net margin climbing above 10%, reflecting stronger profitability.
Is the Income Statement Favorable?
In 2025, fundamentals show strength: revenue grew 6.4% year-over-year while EBIT expanded 12.3%. Despite a 16% decline in gross profit, operating expenses rose proportionally, maintaining operational efficiency. Interest expense remains moderate at 5.1% of revenue. Overall, the income statement scores 78.6% favorable metrics, indicating solid financial health.
Financial Ratios
The following table summarizes key financial ratios for Carnival Corporation & plc over the past five fiscal years:
| Ratios | 2021 | 2022 | 2023 | 2024 | 2025 |
|---|---|---|---|---|---|
| Net Margin | -498% | -501% | -0.34% | 7.66% | 10.4% |
| ROE | -78.2% | -86.3% | -1.08% | 20.7% | 22.5% |
| ROIC | -14.8% | -10.0% | 4.91% | 9.13% | 10.8% |
| P/E | -2.08 | -1.92 | -257 | 16.9 | 12.3 |
| P/B | 1.63 | 1.66 | 2.76 | 3.50 | 2.77 |
| Current Ratio | 0.97 | 0.71 | 0.46 | 0.29 | 0.32 |
| Quick Ratio | 0.94 | 0.67 | 0.41 | 0.25 | 0.28 |
| D/E | 2.85 | 5.08 | 4.63 | 3.12 | 2.28 |
| Debt-to-Assets | 0.65 | 0.69 | 0.65 | 0.59 | 0.54 |
| Interest Coverage | -4.43 | -2.72 | 0.95 | 2.04 | 3.32 |
| Asset Turnover | 0.04 | 0.24 | 0.44 | 0.51 | 0.52 |
| Fixed Asset Turnover | 0.05 | 0.30 | 0.52 | 0.58 | 0.59 |
| Dividend Yield | 0 | 0 | 0 | 0 | 0 |
Evolution of Financial Ratios
From 2021 to 2025, Carnival Corporation’s Return on Equity (ROE) improved significantly, turning positive and reaching 22.47% in 2025. The Current Ratio steadily declined from near 1.0 in 2021 to 0.32 in 2025, indicating worsening short-term liquidity. Meanwhile, the Debt-to-Equity Ratio remained high and increased, hitting 2.28 in 2025, signaling sustained leverage.
Are the Financial Ratios Favorable?
In 2025, profitability ratios like net margin (10.37%) and ROE (22.47%) are favorable, reflecting solid earnings generation. However, liquidity ratios such as the current ratio (0.32) and quick ratio (0.28) are unfavorable, highlighting potential short-term solvency risks. Leverage remains elevated with a debt-to-equity of 2.28 and debt-to-assets at 54.16%, both unfavorable. Market valuation ratios are mostly neutral or favorable, but the overall financial profile leans unfavorable.
Shareholder Return Policy
Carnival Corporation & plc (CCL) does not pay dividends, reflecting its ongoing focus on reinvestment and stabilizing profitability after recent losses. While no dividends are distributed, the company participates in share buybacks, signaling a preference for capital return through repurchases rather than cash payouts.
This approach aligns with a strategic emphasis on long-term shareholder value creation amid debt leverage and margin recovery. However, investors should consider the lack of dividend yield as part of the risk profile, especially given the company’s modest free cash flow coverage of capital expenditures and buybacks.
Score analysis
The radar chart below illustrates Carnival Corporation & plc’s key financial scores across valuation and profitability metrics:
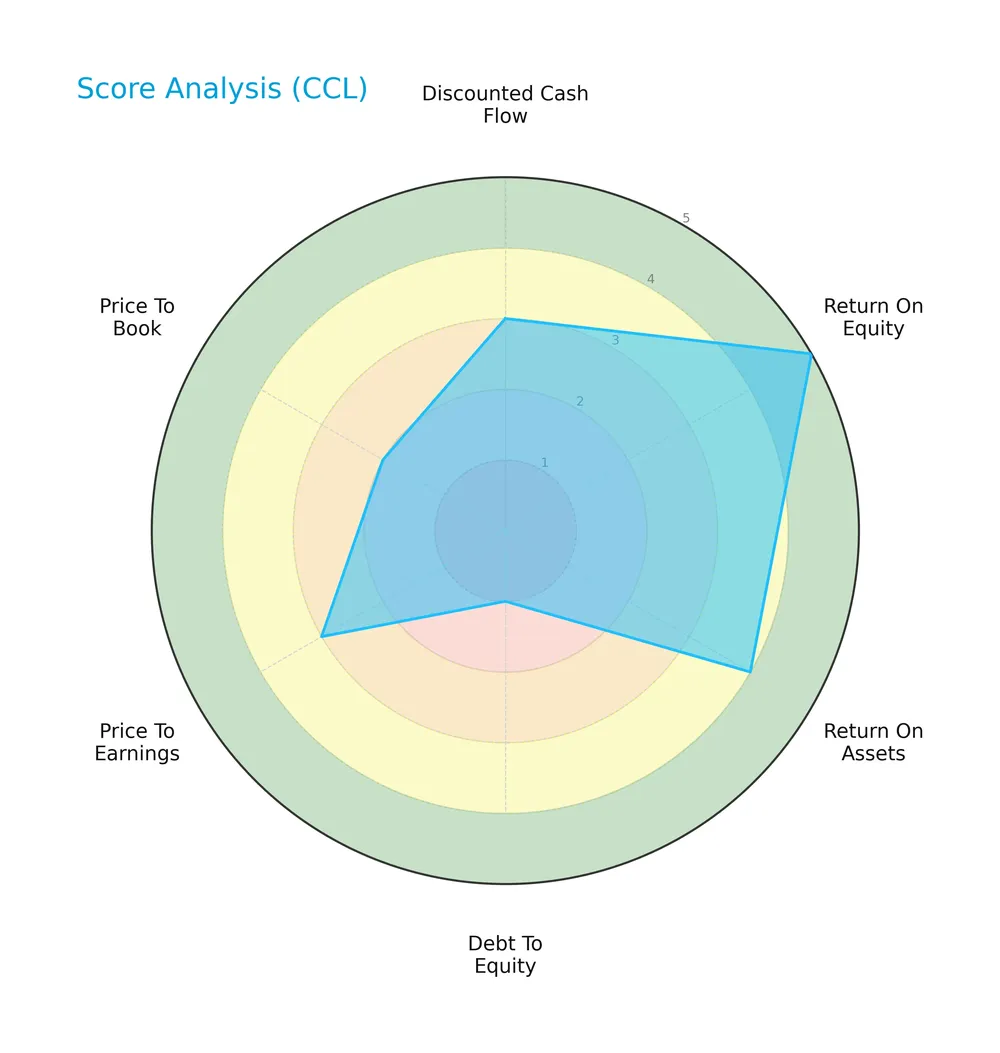
The company shows very favorable return on equity (5) and favorable return on assets (4). However, the debt-to-equity score is very unfavorable (1). Valuation metrics like price-to-earnings (3) and price-to-book (2) are moderate, reflecting mixed investor sentiment.
Analysis of the company’s bankruptcy risk
Carnival Corporation’s Altman Z-Score places it in the distress zone, indicating a high risk of bankruptcy:

Is the company in good financial health?
The Piotroski Score diagram highlights the company’s strong financial health status:

With a Piotroski Score of 7, Carnival Corporation demonstrates strong financial strength, suggesting solid fundamentals despite some balance sheet concerns.
Competitive Landscape & Sector Positioning
This section analyzes Carnival Corporation & plc’s position within the leisure travel sector, focusing on strategic factors. I will assess whether Carnival holds a competitive advantage over its main industry peers.
Strategic Positioning
Carnival Corporation & plc operates a diversified leisure travel portfolio, encompassing multiple cruise brands and additional services like hotels and motor coaches. Its geographic reach spans North America, Europe, Australia, and Asia, reflecting a broad global footprint that balances regional exposures.
Revenue by Segment
This pie chart illustrates Carnival Corporation & plc’s revenue distribution by segment for fiscal year 2025, highlighting the relative contributions of Cruise and Tour And Other businesses.
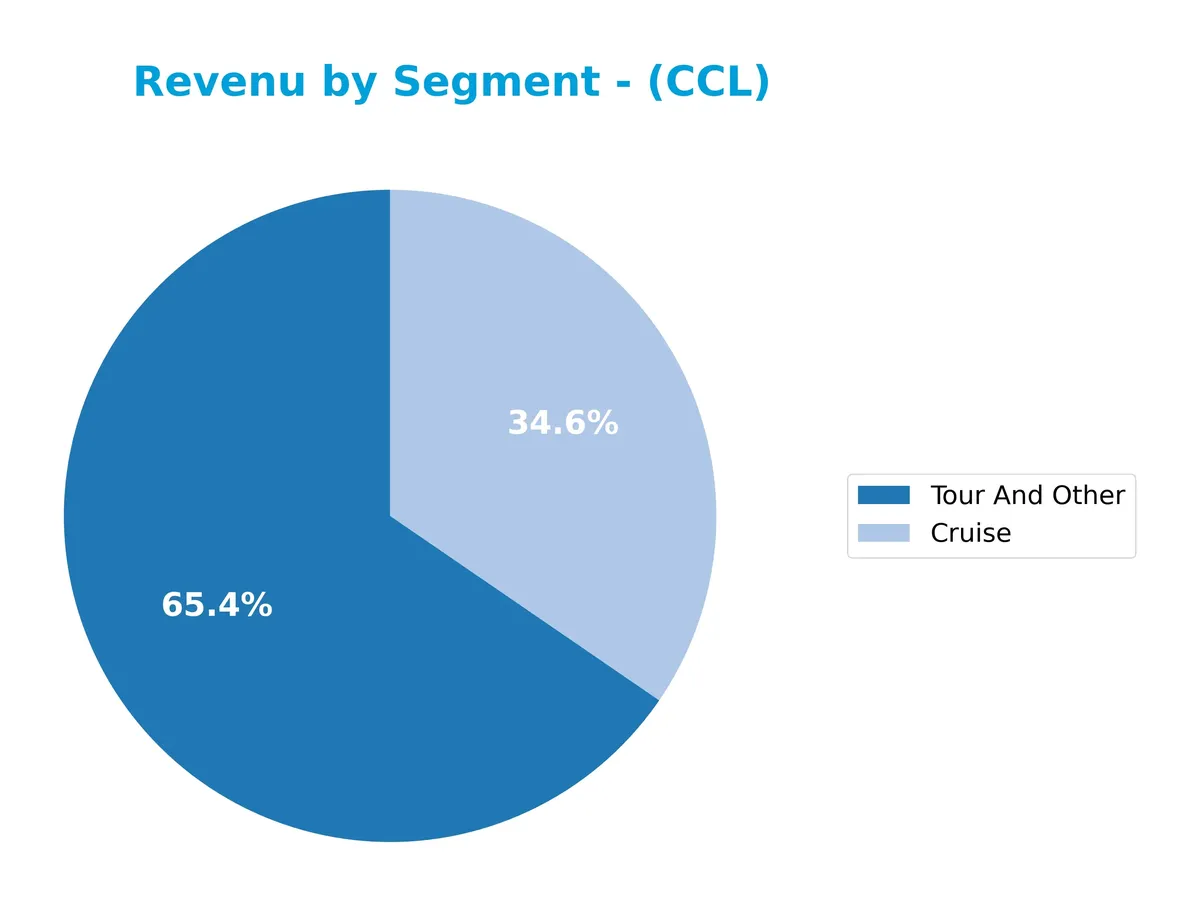
In 2025, Tour And Other leads with $17.4B, followed by Cruise at $9.2B. Historically, Tour And Other consistently drives the bulk of revenue, reflecting diversification beyond cruising. Cruise revenue shows steady recovery post-pandemic, increasing from $8.6B in 2024 to $9.2B. The data signals resurging demand in cruising, yet Tour And Other remains the dominant segment, underscoring concentrated exposure to that segment’s cyclical risks.
Key Products & Brands
Carnival Corporation’s revenue primarily derives from these core products and brands:
| Product | Description |
|---|---|
| Carnival Cruise Line | Operates leisure cruises visiting ~700 ports globally with a fleet of 87 ships and 223K berths. |
| Princess Cruises | Luxury cruise brand offering premium travel experiences across multiple international regions. |
| Holland America Line | Premium cruise line focused on cultural and exploratory voyages worldwide. |
| P&O Cruises (Australia) | Regional cruise services targeting the Australian market with leisure travel packages. |
| Seabourn | Ultra-luxury cruise brand emphasizing personalized and exclusive voyages. |
| Costa Cruises | Mediterranean and European cruise operator with a diverse customer base. |
| AIDA Cruises | German market-focused cruise brand known for casual, innovative onboard experiences. |
| P&O Cruises (UK) | British cruise line offering family-friendly and traditional cruise vacations. |
| Cunard | Historic luxury cruise brand with transatlantic and world cruise itineraries. |
| Tour and Other Services | Includes port destinations, hotels, lodges, railcars, motor coaches, and travel-related services. |
Carnival’s portfolio blends mass-market and luxury cruise brands, supplemented by ancillary travel services. The company’s diverse offerings span multiple continents, balancing volume-driven passenger ticket sales with higher-margin onboard and tour revenues.
Main Competitors
There are 2 competitors in the Consumer Cyclical Leisure sector. The table lists the top 10 leaders by market capitalization:
| Competitor | Market Cap. |
|---|---|
| Carnival Corporation & plc | 40.6B |
| Hasbro, Inc. | 11.6B |
Carnival Corporation & plc ranks 1st among its competitors. Its market cap is 8% larger than the next closest rival. The company is above both the average market cap of the top 10 and the sector median. The gap to Hasbro, the nearest competitor below, is significant at -276%.
Comparisons with competitors
Check out how we compare the company to its competitors:
Does Carnival Corporation & plc have a competitive advantage?
Carnival Corporation currently does not present a strong competitive advantage, as its ROIC falls below WACC, indicating value destruction despite improving profitability. The company’s EBITDA and net margin show favorable trends, but the overall moat status remains slightly unfavorable.
Looking ahead, Carnival’s extensive global footprint with 87 ships and presence across multiple regions offers potential expansion opportunities. Continued growth in key markets like Europe, Australia, and Asia could enhance its competitive position if operational efficiencies improve.
SWOT Analysis
This SWOT analysis highlights Carnival Corporation & plc’s strategic positioning to guide investment decisions.
Strengths
- strong brand portfolio
- favorable net margin of 10.37%
- significant revenue growth over 5 years
Weaknesses
- low liquidity ratios (current and quick ratios below 0.5)
- high debt levels with D/E at 2.28
- ROIC below WACC indicating value destruction
Opportunities
- expanding cruise markets in Europe, Asia, Australia
- increasing global leisure travel demand
- potential fleet modernization for efficiency gains
Threats
- high beta (2.44) indicating stock volatility
- economic downturns impacting discretionary spending
- regulatory and environmental compliance costs
Carnival shows solid brand strength and improving profitability amid financial leverage and liquidity challenges. The company must balance debt reduction with growth to sustain competitive advantage.
Stock Price Action Analysis
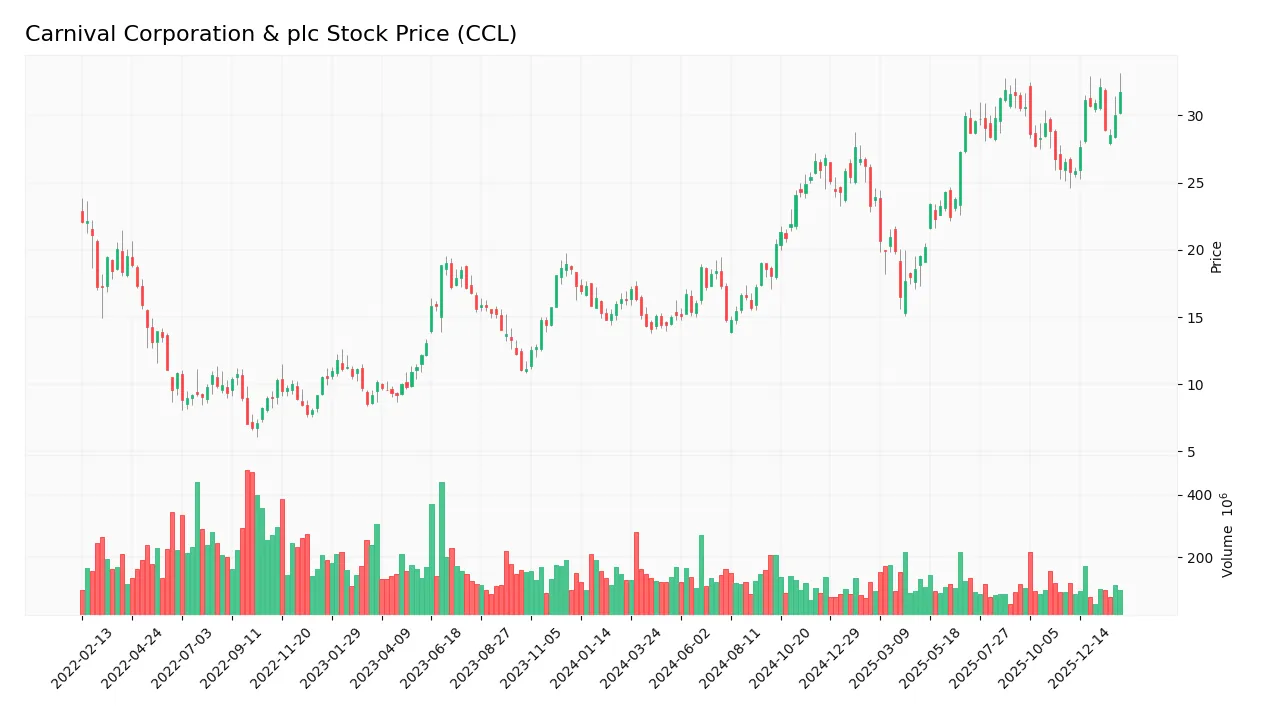
The weekly stock price chart for Carnival Corporation & plc (CCL) highlights key movements and price fluctuations over the last 12 months:
Trend Analysis
Over the past year, CCL’s stock price increased by 95.3%, signaling a strong bullish trend with clear acceleration. The price ranged between 14.12 and 32.13, showing significant upside momentum. The standard deviation of 5.6 indicates moderate volatility throughout this period.
Volume Analysis
Trading volume over the last three months shows a buyer-driven market, with buyers accounting for 68.7% of activity. Despite this dominance, total volume is decreasing, suggesting cautious participation amid optimism. This pattern points to selective accumulation rather than broad-based enthusiasm.
Target Prices
Analysts set a target price consensus that suggests moderate upside potential for Carnival Corporation & plc.
| Target Low | Target High | Consensus |
|---|---|---|
| 33 | 40 | 36.54 |
The target range indicates cautious optimism, with the consensus price implying a steady recovery in the cruise industry.

Don’t Let Luck Decide Your Entry Point
Optimize your entry points with our advanced ProRealTime indicators. You’ll get efficient buy signals with precise price targets for maximum performance. Start outperforming now!
Analyst & Consumer Opinions
This section examines recent analyst grades and consumer feedback related to Carnival Corporation & plc’s market performance.
Stock Grades
Below is a summary of recent verified analyst grades for Carnival Corporation & plc, reflecting a stable outlook across major firms:
| Grading Company | Action | New Grade | Date |
|---|---|---|---|
| Truist Securities | Maintain | Hold | 2026-01-22 |
| TD Cowen | Maintain | Buy | 2026-01-13 |
| UBS | Maintain | Buy | 2026-01-12 |
| B of A Securities | Maintain | Buy | 2026-01-12 |
| Bernstein | Maintain | Market Perform | 2026-01-06 |
| Barclays | Maintain | Overweight | 2025-12-22 |
| Mizuho | Maintain | Outperform | 2025-12-22 |
| Citigroup | Maintain | Buy | 2025-12-22 |
| Argus Research | Maintain | Buy | 2025-12-22 |
| Stifel | Maintain | Buy | 2025-12-22 |
The consensus maintains a predominantly positive view with a “Buy” rating driven by 26 buy recommendations versus 18 holds and 3 sells. No firms revised their prior assessments, indicating confidence in the current valuation range.
Consumer Opinions
Carnival Corporation & plc evokes strong feelings from its customers, reflecting both loyalty and frustration.
| Positive Reviews | Negative Reviews |
|---|---|
| “Great value for family vacations.” | “Frequent itinerary changes caused stress.” |
| “Friendly staff and excellent onboard entertainment.” | “Cabin cleanliness could improve.” |
| “Wide variety of destinations and activities.” | “Long wait times at ports and during boarding.” |
Consumers appreciate Carnival’s diverse itineraries and engaging onboard experiences. However, operational hiccups like itinerary changes and service delays remain common complaints.
Risk Analysis
Below is a detailed table summarizing Carnival Corporation & plc’s key risk factors, their likelihood, and potential impact on the business:
| Category | Description | Probability | Impact |
|---|---|---|---|
| Financial Leverage | High debt-to-equity ratio (2.28) increases default risk. | High | High |
| Liquidity | Very low current ratio (0.32) signals cash flow constraints. | High | High |
| Market Volatility | Beta of 2.44 indicates strong stock price swings vs. market. | Medium | Medium |
| Operational Risks | Exposure to global travel disruptions and fuel price volatility. | Medium | High |
| Profitability | ROIC (10.79%) below WACC (11.28%) signals value destruction. | Medium | Medium |
| Dividend Policy | No current dividend yield may discourage income-focused investors. | Low | Low |
| Bankruptcy Risk | Altman Z-score (1.37) in distress zone signals financial fragility. | Medium | High |
I observe that Carnival’s high leverage and poor liquidity are the most pressing concerns, increasing bankruptcy risk despite solid profitability and a strong Piotroski score. The company’s sensitivity to travel market cycles and fuel costs adds volatility. Prudence dictates close monitoring of leverage reduction and cash flow improvement.
Should You Buy Carnival Corporation & plc?
Carnival appears to be improving profitability with growing ROIC but suffers from a slightly unfavorable moat and substantial leverage. While operational efficiency shows promise, the distress-zone Altman Z-score and low debt rating suggest a cautious interpretation. The overall B+ rating reflects a moderate risk-return profile.
Strength & Efficiency Pillars
Carnival Corporation & plc displays solid profitability with a net margin of 10.37% and a return on equity of 22.47%. The Piotroski score of 7 signals strong financial health, underlining operational resilience. Despite a modest ROIC of 10.79%, it falls short of the WACC at 11.28%, indicating the company is currently shedding value. However, the improving ROIC trend suggests growing profitability potential. The Altman Z-Score of 1.37 places Carnival in the distress zone, highlighting caution on financial stability.
Weaknesses and Drawbacks
The company struggles with leverage, showing a high debt-to-equity ratio of 2.28 and weak liquidity, evidenced by a current ratio of 0.32. These metrics expose Carnival to refinancing and short-term liquidity risks. The price-to-book ratio of 2.77 is neutral but combined with a moderate P/E of 12.33, suggests limited valuation upside. Additionally, the absence of dividend yield and unfavorable fixed asset turnover at 0.59 signals operational inefficiencies. These factors collectively create tangible market headwinds.
Our Verdict about Carnival Corporation & plc
Carnival presents a fundamentally mixed profile with favorable profitability but financial distress risks and value destruction. The bullish long-term stock trend coupled with recent buyer dominance at 68.7% suggests positive investor sentiment. This scenario may appear attractive for selective long-term exposure but warrants a cautious wait-and-see approach due to financial leverage and liquidity concerns.
Disclaimer: This content is for informational purposes only and does not constitute financial, investment, or other professional advice. Investing in financial markets involves a significant risk of loss, and past performance is not indicative of future results.
Additional Resources
- Carnival Corporation (CCL) Is a Trending Stock: Facts to Know Before Betting on It – Yahoo Finance (Feb 05, 2026)
- SBI Securities Co. Ltd. Sells 46,137 Shares of Carnival Corporation $CCL – MarketBeat (Feb 05, 2026)
- Unify – Carnival Corporation (Dec 19, 2025)
- Investors Shouldn’t Be Too Comfortable With Carnival Corporation &’s (NYSE:CCL) Earnings – simplywall.st (Feb 03, 2026)
- Ever wondered about what HR looks like on a cruise ship? – HR Brew (Feb 04, 2026)
For more information about Carnival Corporation & plc, please visit the official website: carnivalcorp.com