Home > Analyses > Healthcare > Cardinal Health, Inc.
Cardinal Health, Inc. powers the healthcare ecosystem by seamlessly delivering vital pharmaceutical and medical products that touch millions of lives daily. As a dominant force in medical distribution, its extensive portfolio spans from branded and generic drugs to surgical supplies, underpinning hospitals and pharmacies worldwide. Renowned for operational excellence and innovation, Cardinal Health continuously adapts to evolving healthcare demands. This analysis explores whether its solid fundamentals and market position still support attractive growth and valuation prospects.

Table of contents
Business Model & Company Overview
Cardinal Health, Inc., established in 1979 and headquartered in Dublin, Ohio, stands as a dominant player in the integrated healthcare services and products industry. The company delivers a unified ecosystem serving hospitals, pharmacies, ambulatory surgery centers, and patients globally. Its core mission revolves around providing tailored solutions that span pharmaceutical distribution and medical product manufacturing, reinforcing its pivotal role in healthcare supply chains across the US, Canada, Europe, and Asia.
Cardinal Health’s revenue engine balances its Pharmaceutical and Medical segments, combining distribution of branded, generic, and specialty drugs with manufacturing and supply of medical and surgical products. This dual approach, supported by extensive supply chain services and patient management solutions, fuels growth across multiple continents. Its competitive advantage lies in this integrated offering and global reach, securing a strong economic moat that shapes the future of healthcare distribution and services.
Financial Performance & Fundamental Metrics
This section analyzes Cardinal Health, Inc.’s income statement, key financial ratios, and dividend payout policy to assess its overall financial health and shareholder value.
Income Statement
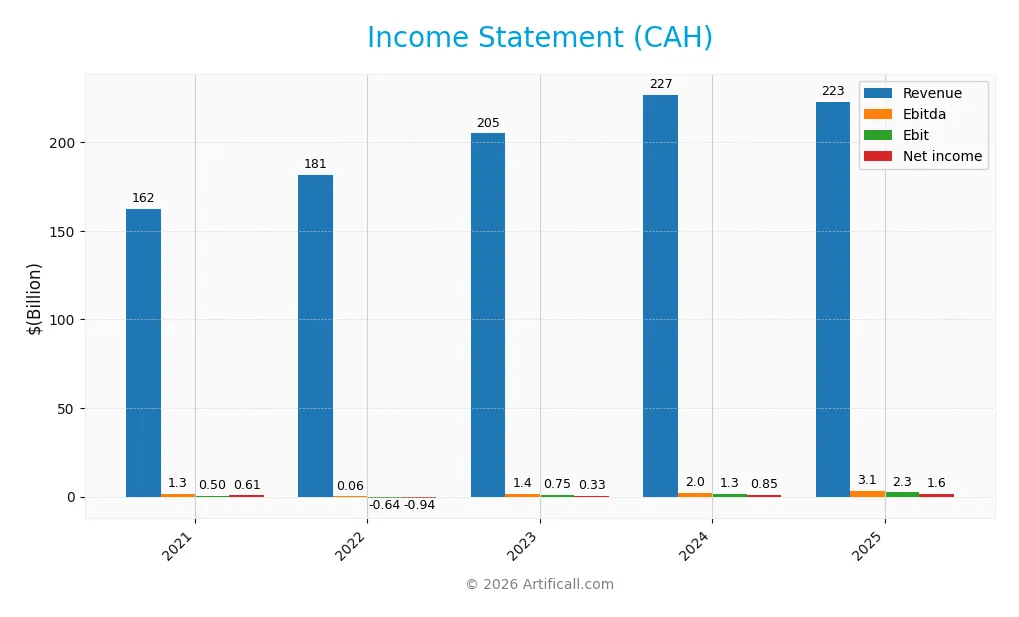
The table below presents Cardinal Health, Inc.’s annual income statement figures for the fiscal years 2021 through 2025 in USD, highlighting key performance metrics.
| 2021 | 2022 | 2023 | 2024 | 2025 | |
|---|---|---|---|---|---|
| Revenue | 162.5B | 181.3B | 205.0B | 226.8B | 222.6B |
| Cost of Revenue | 155.7B | 174.8B | 198.1B | 219.4B | 214.4B |
| Operating Expenses | 6.3B | 7.1B | 6.1B | 6.2B | 5.9B |
| Gross Profit | 6.8B | 6.5B | 6.9B | 7.4B | 8.2B |
| EBITDA | 1.3B | 55M | 1.4B | 2.0B | 3.1B |
| EBIT | 503M | -637M | 747M | 1.3B | 2.3B |
| Interest Expense | 180M | 147M | 84M | 51M | 215M |
| Net Income | 611M | -938M | 330M | 852M | 1.6B |
| EPS | 2.09 | -3.34 | 1.26 | 3.48 | 6.48 |
| Filing Date | 2021-08-16 | 2022-08-11 | 2023-08-15 | 2024-08-14 | 2025-08-12 |
Income Statement Evolution
Between 2021 and 2025, Cardinal Health, Inc. saw its revenue grow by 37% overall, though it dipped slightly by 1.87% in the latest year. Net income expanded more markedly, up 155%, with a similar positive trend in net margin, which grew by 86%. Gross margin remained stable at 3.67%, and EBIT margin held steady at 1.04%, reflecting consistent operational efficiency despite revenue fluctuations.
Is the Income Statement Favorable?
The 2025 income statement reveals solid fundamentals with a net margin of 0.7% and an EBIT margin of 1.04%, both rated neutral but stable. Interest expense is low at 0.1% of revenue, which is favorable. Notably, net income and EPS surged by approximately 87% year-over-year, supported by a 10% rise in gross profit and an 85% jump in EBIT. Overall, 71% of income statement metrics are favorable, suggesting a predominantly positive financial position.
Financial Ratios
The table below presents key financial ratios for Cardinal Health, Inc. over the last five fiscal years, providing insight into profitability, liquidity, leverage, and market valuation:
| Ratios | 2021 | 2022 | 2023 | 2024 | 2025 |
|---|---|---|---|---|---|
| Net Margin | 0.38% | -0.52% | 0.16% | 0.38% | 0.70% |
| ROE | 34.12% | 132.30% | -11.16% | -26.52% | -56.13% |
| ROIC | 2.65% | -4.33% | 3.58% | 8.80% | 11.37% |
| P/E | 27.28 | -15.55 | 74.80 | 28.11 | 25.94 |
| P/B | 9.31 | -20.57 | -8.34 | -7.45 | -14.56 |
| Current Ratio | 1.12 | 1.08 | 1.00 | 0.98 | 0.94 |
| Quick Ratio | 0.60 | 0.57 | 0.52 | 0.56 | 0.50 |
| D/E | 3.75 | -8.19 | -1.75 | -1.75 | -3.36 |
| Debt-to-Assets | 15.11% | 13.23% | 11.94% | 12.43% | 17.59% |
| Interest Coverage | 2.62 | -4.13 | 8.95 | 24.37 | 10.58 |
| Asset Turnover | 3.65 | 4.13 | 4.73 | 5.03 | 4.19 |
| Fixed Asset Turnover | 68.84 | 76.80 | 83.29 | 89.69 | 77.88 |
| Dividend Yield | 3.44% | 3.83% | 2.13% | 2.08% | 1.22% |
Evolution of Financial Ratios
Over the period from 2021 to 2025, Cardinal Health, Inc. saw a declining trend in Return on Equity (ROE), dropping sharply to -56.13% in 2025, indicating worsening profitability. The Current Ratio decreased below 1.0 to 0.94 in 2025, signaling reduced short-term liquidity. Conversely, the Debt-to-Equity Ratio improved, moving to a favorable negative value of -3.36, reflecting a unique capital structure dynamic.
Are the Financial Ratios Favorable?
In 2025, profitability ratios such as net margin (0.7%) and ROE (-56.13%) are unfavorable, while return on invested capital (11.37%) and weighted average cost of capital (6.32%) are favorable, indicating mixed earnings efficiency. Liquidity ratios, including current (0.94) and quick (0.50), remain below benchmark levels, marking unfavorable short-term financial health. Leverage metrics, including debt-to-assets (17.59%) and debt-to-equity (-3.36), alongside interest coverage (10.77), show favorable leverage management. Asset turnover ratios also perform well, supporting operational efficiency. Overall, 57.14% of key ratios are favorable, leading to a generally favorable financial stance.
Shareholder Return Policy
Cardinal Health, Inc. maintains a consistent dividend payout, with a payout ratio near 32% in 2025 and a dividend per share slightly above $2, yielding around 1.22% annually. The dividend is covered by free cash flow at approximately 77%, indicating a moderate level of sustainability, while the company also engages in share buybacks.
This balanced approach supports a steady shareholder return without excessive risk from distributions or repurchases. The dividend yield has trended downward from over 3% in 2021 to near 1.2% in 2025, reflecting cautious capital allocation amid modest profit margins, suggesting a focus on sustainable long-term value creation.
Score analysis
The following radar chart presents the evaluation of Cardinal Health, Inc.’s key financial scores:
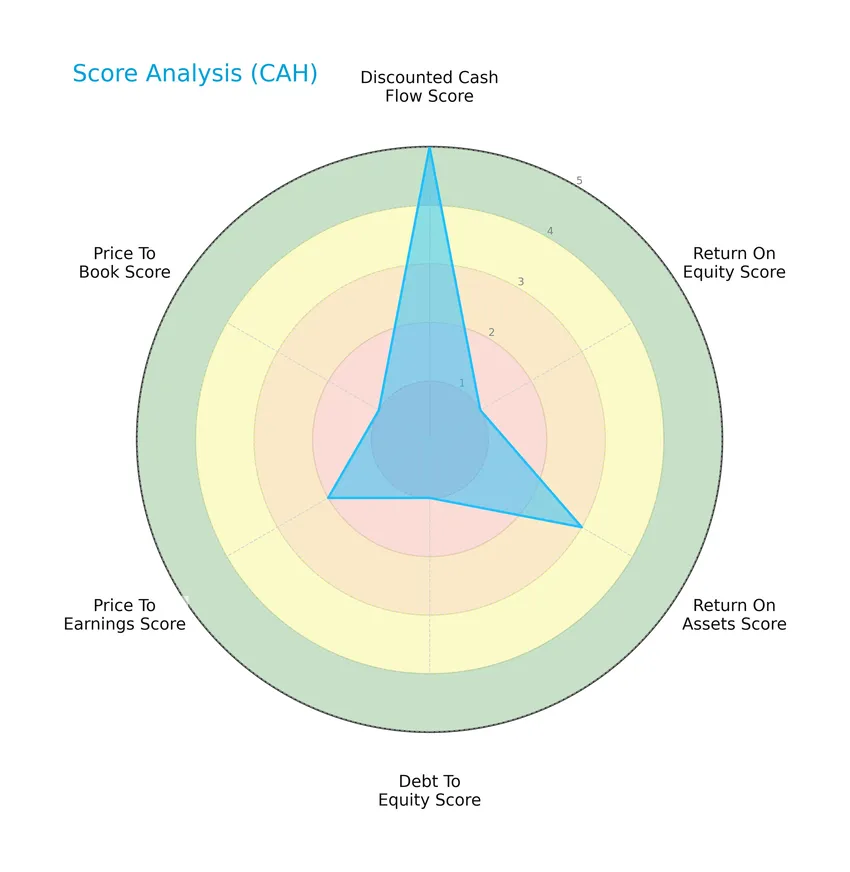
Cardinal Health shows a very favorable discounted cash flow score of 5, but struggles with very unfavorable return on equity, debt to equity, and price to book scores at 1 each. Return on assets and price to earnings scores are moderate at 3 and 2 respectively, reflecting mixed financial performance.
Analysis of the company’s bankruptcy risk
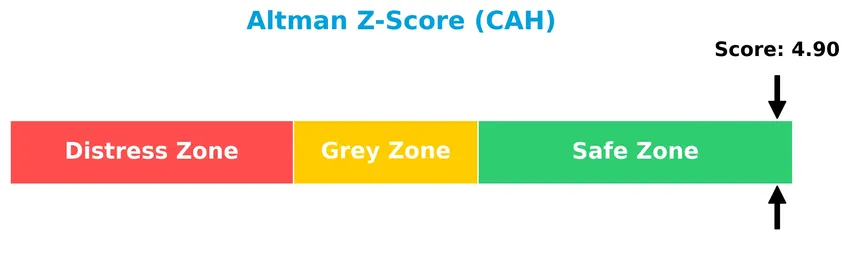
The Altman Z-Score indicates that Cardinal Health is in the safe zone, suggesting a low risk of bankruptcy based on its current financial ratios:
Is the company in good financial health?
The Piotroski Score diagram illustrates the company’s financial strength based on nine accounting criteria:
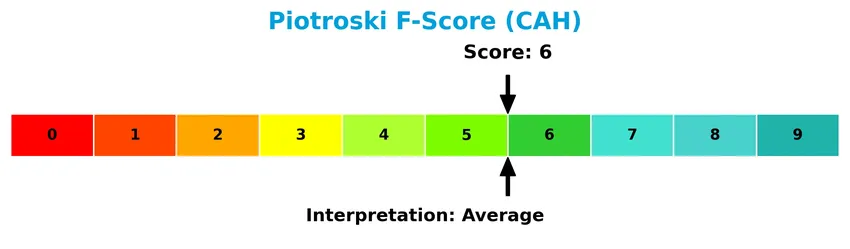
With a Piotroski Score of 6, Cardinal Health demonstrates average financial health. This score indicates moderate strength but leaves room for improvement in profitability, leverage, and efficiency metrics.
Competitive Landscape & Sector Positioning
This sector analysis will explore Cardinal Health, Inc.’s strategic positioning, revenue by segment, key products, main competitors, and competitive advantages. I will assess whether Cardinal Health holds a competitive advantage compared to its industry peers.
Strategic Positioning
Cardinal Health, Inc. focuses primarily on the U.S. market, generating over $220B in 2025 revenues domestically versus $1.7B internationally. Its portfolio spans pharmaceutical distribution and medical products, with the pharmaceutical segment dominating at over $204B, complemented by $12.6B in medical-related sales.
Revenue by Segment
This pie chart illustrates Cardinal Health, Inc.’s revenue distribution across its main business segments for the fiscal year ending June 30, 2025.
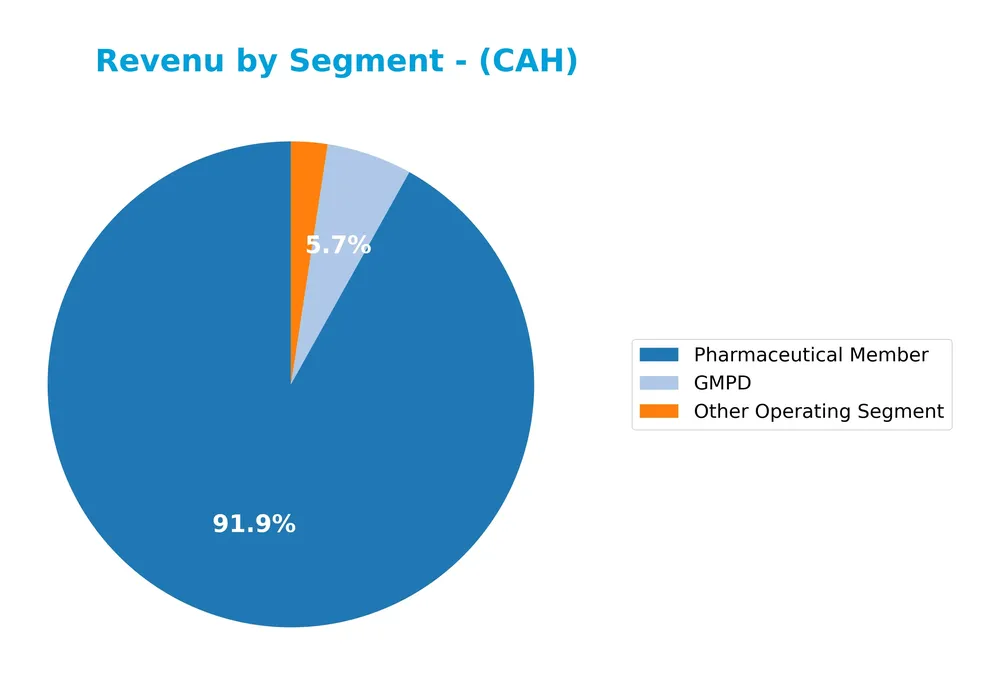
In 2025, the Pharmaceutical Member segment remains the dominant revenue driver at 205B, despite a slight decline from the previous year’s 210B. GMPD shows steady growth, reaching 12.6B, while Other Operating Segment increased to 5.4B. This suggests a concentration risk in Pharmaceuticals but also gradual diversification with rising contributions from other areas. The overall trend reflects a stable core business with emerging segment growth.
Key Products & Brands
The table below summarizes Cardinal Health, Inc.’s main product lines and brand categories:
| Product | Description |
|---|---|
| Pharmaceutical Segment | Distribution of branded, generic, specialty pharmaceuticals, over-the-counter healthcare, and consumer products. Includes specialty pharma services, nuclear pharmacies, radiopharmaceutical manufacturing, repackaging, medication therapy management, and pharmacy management services. |
| Medical Segment | Manufacture, sourcing, and distribution of Cardinal Health branded medical, surgical, and laboratory products including gloves, needles, syringes, wound care, surgical apparel, and urology products. Also distributes national brand products and provides supply chain services. |
| Cardinal Health At Home Solutions | Home healthcare products and related services targeting patient care outside of traditional clinical settings. |
| Nuclear Precision Health Services | Specialized services related to nuclear pharmacy and radiopharmaceuticals. |
Cardinal Health’s business is divided primarily into pharmaceutical and medical segments, complemented by home healthcare and nuclear precision health services, reflecting a broad portfolio that supports hospitals, pharmacies, and other healthcare providers.
Main Competitors
There are 4 competitors in the Healthcare Medical – Distribution industry, with the table showing the top 4 leaders by market capitalization:
| Competitor | Market Cap. |
|---|---|
| McKesson Corporation | 103B |
| Cencora, Inc. | 65.7B |
| Cardinal Health, Inc. | 48.9B |
| Henry Schein, Inc. | 9.4B |
Cardinal Health, Inc. ranks 3rd among its competitors and has about 48.1% of the market cap of the sector leader, McKesson Corporation. The company is below both the average market cap of the top competitors (56.7B) and the median sector market cap (57.3B). It maintains a 32.7% market cap gap to the next competitor above, Cencora, Inc., indicating a significant lead over Henry Schein, Inc. below.
Comparisons with competitors
Check out how we compare the company to its competitors:
Does CAH have a competitive advantage?
Cardinal Health, Inc. presents a competitive advantage, as evidenced by its ROIC exceeding WACC by over 5%, indicating value creation and efficient use of invested capital. The company also shows a strong, growing ROIC trend, reflecting increasing profitability and a durable competitive moat.
Looking ahead, Cardinal Health’s integrated healthcare services across multiple global markets, with segments in Pharmaceutical and Medical distribution, position it well to leverage new opportunities. Continued expansion in specialty pharmaceuticals, supply chain services, and product innovations may support sustained growth and competitive positioning.
SWOT Analysis
This SWOT analysis highlights Cardinal Health, Inc.’s key internal strengths and weaknesses alongside external opportunities and threats to guide strategic investment decisions.
Strengths
- Strong market position in US healthcare distribution
- Diverse product portfolio in pharmaceutical and medical segments
- Favorable ROIC indicating value creation
Weaknesses
- Declining recent revenue growth
- Low return on equity signaling profitability challenges
- Liquidity ratios below industry norms
Opportunities
- Expansion in international markets beyond US
- Growing demand for specialty pharmaceuticals and medical supplies
- Increasing integration of supply chain services
Threats
- Intense competition in medical distribution
- Regulatory changes impacting healthcare sector
- Supply chain disruptions and cost pressures
Cardinal Health’s robust market presence and improving profitability metrics position it well for long-term value creation. However, recent revenue softness and profitability concerns warrant cautious monitoring. Strategic focus on international expansion and specialty products can drive future growth, while risk management strategies must address competitive and regulatory threats.
Stock Price Action Analysis
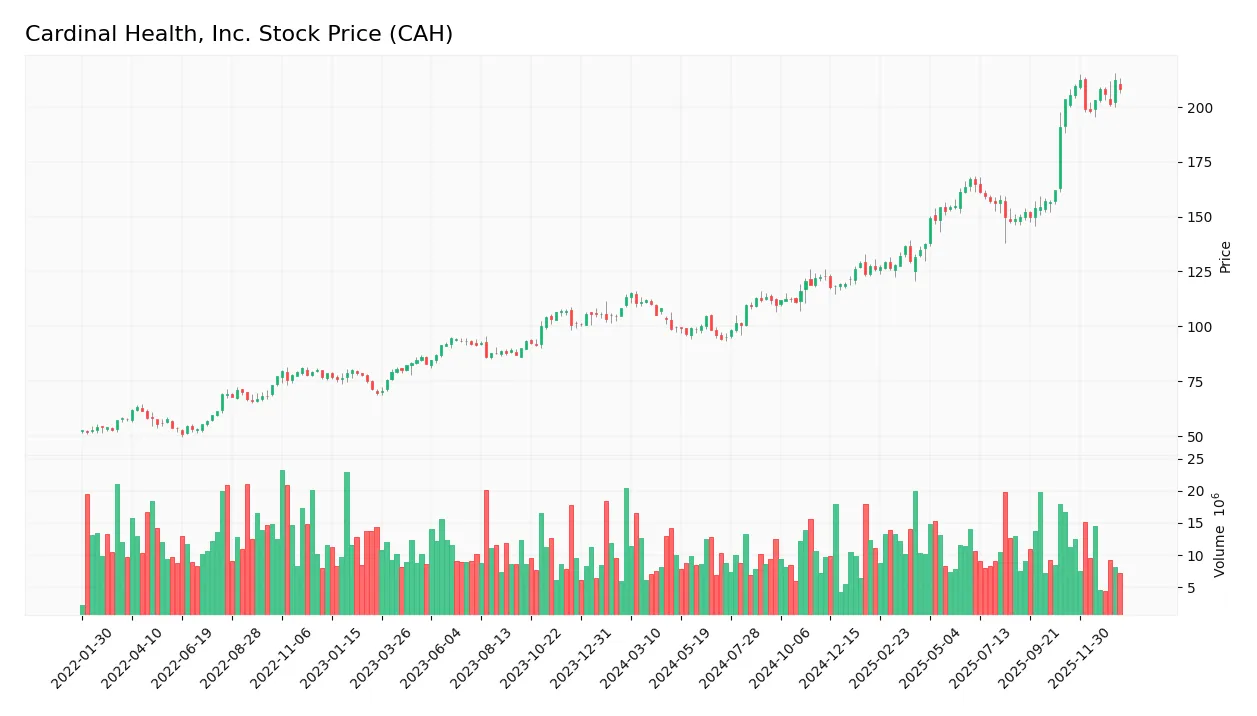
The weekly stock price chart for Cardinal Health, Inc. (CAH) illustrates recent price movements and volume trends over the past 12 weeks:
Trend Analysis
Over the past 12 months, CAH’s stock price rose by 83.76%, indicating a strong bullish trend with deceleration in momentum. The price fluctuated between a low of 94.1 and a high of 212.45, with a high volatility level evidenced by a 33.09 standard deviation. Recent weeks show a moderate 2.29% increase, confirming a continued but slower upward trend.
Volume Analysis
Trading volumes over the last three months have been increasing, with buyer activity dominating at 62.3%. The higher buyer volume compared to sellers suggests positive investor sentiment and strong market participation favoring upward price movement during this period.
Target Prices
Analysts show a strong consensus on Cardinal Health, Inc. with optimistic target prices.
| Target High | Target Low | Consensus |
|---|---|---|
| 250 | 189 | 225.5 |
The target prices suggest that analysts expect Cardinal Health’s stock to appreciate, with a consensus price of 225.5 indicating moderate upside potential from current levels.

Don’t Let Luck Decide Your Entry Point
Optimize your entry points with our advanced ProRealTime indicators. You’ll get efficient buy signals with precise price targets for maximum performance. Start outperforming now!
Analyst & Consumer Opinions
This section examines recent analyst grades and consumer feedback regarding Cardinal Health, Inc. (CAH) to provide insight.
Stock Grades
Here is a summary of the latest verified stock grades for Cardinal Health, Inc. from leading financial institutions:
| Grading Company | Action | New Grade | Date |
|---|---|---|---|
| Wells Fargo | Maintain | Overweight | 2026-01-15 |
| Citigroup | Upgrade | Buy | 2026-01-09 |
| Wells Fargo | Maintain | Overweight | 2025-11-05 |
| Mizuho | Maintain | Outperform | 2025-11-04 |
| TD Cowen | Maintain | Buy | 2025-11-03 |
| UBS | Maintain | Buy | 2025-10-31 |
| Evercore ISI Group | Maintain | Outperform | 2025-10-31 |
| Citigroup | Maintain | Neutral | 2025-10-31 |
| Wells Fargo | Maintain | Overweight | 2025-08-13 |
| Baird | Maintain | Outperform | 2025-08-13 |
The overall trend shows a predominance of positive ratings, with multiple firms maintaining buy, outperform, or overweight grades. Citigroup’s recent upgrade to buy stands out, while no sell or strong sell grades were recorded.
Consumer Opinions
Consumers of Cardinal Health, Inc. (CAH) express a mix of appreciation and concerns, reflecting a nuanced view of the company’s performance and service quality.
| Positive Reviews | Negative Reviews |
|---|---|
| Reliable supply chain management. | Occasional delays in order fulfillment. |
| Strong product quality and safety standards. | Customer service can be slow to respond. |
| Competitive pricing and good value. | Limited innovation in product offerings. |
Overall, feedback suggests Cardinal Health excels in supply reliability and product quality, but it faces challenges with customer service responsiveness and innovation pace. Investors should weigh these factors when considering CAH’s long-term potential.
Risk Analysis
Below is a summary table outlining key risk categories for Cardinal Health, Inc., including their probability and impact on investment decisions:
| Category | Description | Probability | Impact |
|---|---|---|---|
| Financial Performance | Weak net margin (0.7%) and negative ROE (-56.13%) indicate profitability challenges. | High | High |
| Liquidity Risk | Low current ratio (0.94) and quick ratio (0.5) suggest potential short-term liquidity issues. | Medium | Medium |
| Valuation Risk | Elevated P/E ratio (25.94) and unfavorable price-to-book ratio (-14.56) may limit upside. | Medium | Medium |
| Market Volatility | Beta of 0.654 indicates moderate stock price sensitivity to market fluctuations. | Medium | Low |
| Debt Management | Favorable debt-to-assets ratio (17.59%) and interest coverage (10.77) reduce default risk. | Low | Low |
| Regulatory & Industry | Operating in healthcare distribution exposes the company to regulatory changes and competition. | Medium | High |
The most critical risks for Cardinal Health stem from its weak profitability metrics and valuation concerns, which may affect returns despite a solid balance sheet. Its Altman Z-Score of 4.9 confirms financial stability, yet the moderate Piotroski score of 6 calls for cautious optimism. Investors should weigh these factors carefully.
Should You Buy Cardinal Health, Inc.?
Cardinal Health, Inc. appears to be generating improving operational efficiency and strong value creation, supported by a durable competitive moat with growing profitability. Despite a challenging leverage profile and mixed equity returns, its overall rating could be seen as moderate to very favorable, suggesting cautious optimism.
Strength & Efficiency Pillars
Cardinal Health, Inc. demonstrates solid value creation with a return on invested capital (ROIC) of 11.37% exceeding its weighted average cost of capital (WACC) at 6.32%, clearly marking it as a value creator. The company maintains a robust Altman Z-Score of 4.90, placing it safely in the low bankruptcy risk zone, while its Piotroski Score of 6 indicates average financial health. Favorable metrics such as a strong interest coverage ratio of 10.77 and efficient asset turnover of 4.19 further underline operational effectiveness and financial stability.
Weaknesses and Drawbacks
Despite these strengths, Cardinal Health faces notable headwinds. The return on equity (ROE) is deeply negative at -56.13%, signaling poor profitability from shareholders’ perspective. Valuation metrics present risks: a relatively high P/E ratio of 25.94 suggests a premium valuation that might compress returns, while the current ratio of 0.94 and quick ratio of 0.5 indicate tight liquidity positions. These factors, combined with moderate seller volume pressure, warrant caution for short-term investors.
Our Verdict about Cardinal Health, Inc.
Cardinal Health, Inc.’s fundamental profile appears favorable due to its strong value creation and financial health metrics. The bullish overall stock trend, coupled with recent buyer dominance at 62.3%, suggests potential positive momentum. This profile might appear attractive for long-term exposure; however, the liquidity constraints and negative ROE suggest that investors could benefit from monitoring for improved profitability and financial flexibility before committing fully.
Disclaimer: This content is for informational purposes only and does not constitute financial, investment, or other professional advice. Investing in financial markets involves a significant risk of loss, and past performance is not indicative of future results.
Additional Resources
- Cardinal Health Upgraded As It Maintains Investment-Grade Status And Position In Radiopharmaceuticals – Seeking Alpha (Jan 23, 2026)
- Universal Beteiligungs und Servicegesellschaft mbH Lowers Holdings in Cardinal Health, Inc. $CAH – MarketBeat (Jan 23, 2026)
- Cardinal Health, Inc. (CAH) Shares Gain Favor as Citi Turns Bullish on Specialist Assets – Yahoo Finance (Jan 18, 2026)
- Zacks Industry Outlook Highlights McKesson, Cardinal Health, West Pharmaceutical and Align Technology – The Globe and Mail (Jan 23, 2026)
- Cardinal Health, Inc. (CAH) shares gain favor as Citi turns bullish on specialist assets – MSN (Jan 20, 2026)
For more information about Cardinal Health, Inc., please visit the official website: cardinalhealth.com