Home > Analyses > Consumer Defensive > Campbell Soup Company
Campbell Soup Company has long been a staple in households, shaping how millions enjoy convenient, nourishing meals and snacks daily. As a dominant force in the packaged foods industry, Campbell’s portfolio spans iconic soups, beverages, and a diverse range of snacks under well-known brands like Pepperidge Farm and Snyder’s of Hanover. Renowned for consistent innovation and quality, the company continues to adapt in a competitive market. The key question now is whether Campbell’s current fundamentals support its valuation and future growth potential.
Table of contents
Business Model & Company Overview
Campbell Soup Company, founded in 1869 and headquartered in Camden, New Jersey, stands as a dominant player in the packaged foods industry. Its cohesive ecosystem spans Meals & Beverages and Snacks, offering iconic brands like Campbell’s soups, V8 beverages, and Pepperidge Farm snacks. Serving both retail and foodservice sectors in the US, Canada, and Latin America, Campbell integrates a broad portfolio that caters to diverse consumer tastes worldwide.
The company’s revenue engine balances robust sales from ready-to-serve meals and beverages with a growing snacks segment, generating value through both recurring and retail channels. Its presence across the Americas, Europe, and Asia secures a diversified market footprint. This strategic positioning and brand strength create a durable economic moat, shaping the future of convenient, trusted food products on a global scale.
Financial Performance & Fundamental Metrics
I will analyze Campbell Soup Company’s income statement, key financial ratios, and dividend payout policy to assess its overall financial health and investment potential.
Income Statement
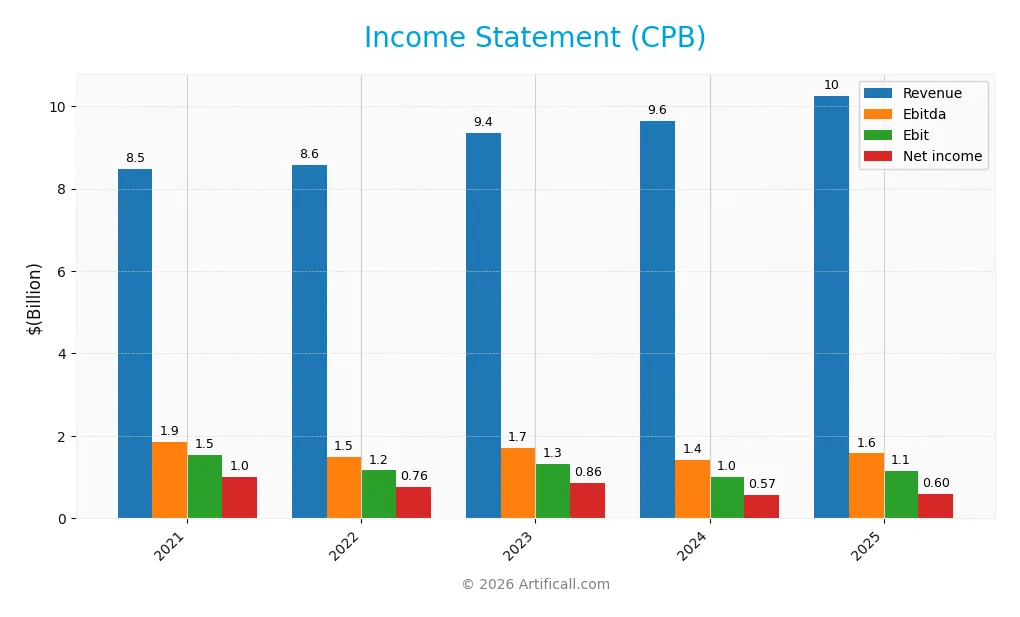
The table below summarizes Campbell Soup Company’s key income statement figures for the fiscal years 2021 through 2025, expressed in USD.
| 2021 | 2022 | 2023 | 2024 | 2025 | |
|---|---|---|---|---|---|
| Revenue | 8.48B | 8.56B | 9.36B | 9.64B | 10.25B |
| Cost of Revenue | 5.67B | 5.94B | 6.44B | 6.67B | 7.13B |
| Operating Expenses | 1.54B | 1.48B | 1.61B | 1.75B | 1.77B |
| Gross Profit | 2.81B | 2.63B | 2.92B | 2.97B | 3.12B |
| EBITDA | 1.86B | 1.50B | 1.70B | 1.42B | 1.58B |
| EBIT | 1.55B | 1.16B | 1.32B | 1.01B | 1.14B |
| Interest Expense | 210M | 189M | 188M | 249M | 345M |
| Net Income | 1.00B | 757M | 858M | 567M | 602M |
| EPS | 3.31 | 2.51 | 2.87 | 1.90 | 2.02 |
| Filing Date | 2021-09-23 | 2022-09-22 | 2023-09-21 | 2024-09-19 | 2025-09-18 |
Income Statement Evolution
Between 2021 and 2025, Campbell Soup Company’s revenue grew by 21% overall, with a moderate 6.4% increase in the last year, indicating steady top-line expansion. However, net income declined almost 40% over the period, reflecting pressure on profitability despite stable gross margins around 30%. EBIT margins improved, rising to 11.13%, signaling some operational efficiency gains.
Is the Income Statement Favorable?
In 2025, Campbell’s fundamentals show a generally favorable income statement. Revenue reached $10.25B, with gross profit at $3.12B and an EBIT of $1.14B, supporting an 11.13% EBIT margin. Despite a slight net margin contraction year-over-year to 5.87%, EPS increased 6.35% to $2.02, while interest expense remained manageable at 3.36% of revenue. Overall, the income statement portrays operational strength amid margin challenges.
Financial Ratios
The following table presents key financial ratios for Campbell Soup Company (CPB) over the fiscal years 2021 to 2025, illustrating profitability, valuation, liquidity, leverage, and efficiency measures:
| Ratios | 2021 | 2022 | 2023 | 2024 | 2025 |
|---|---|---|---|---|---|
| Net Margin | 12% | 9% | 9% | 6% | 6% |
| ROE | 32% | 23% | 23% | 15% | 15% |
| ROIC | 10% | 9% | 10% | 7% | 8% |
| P/E | 13.2 | 19.7 | 16.0 | 24.8 | 16.0 |
| P/B | 4.2 | 4.5 | 3.7 | 3.7 | 2.5 |
| Current Ratio | 0.93 | 0.68 | 0.93 | 0.61 | 0.77 |
| Quick Ratio | 0.42 | 0.25 | 0.35 | 0.22 | 0.28 |
| D/E | 1.68 | 1.52 | 1.36 | 1.99 | 1.85 |
| Debt-to-Assets | 45% | 42% | 41% | 50% | 48% |
| Interest Coverage | 6.0 | 6.1 | 7.0 | 4.9 | 3.9 |
| Asset Turnover | 0.72 | 0.72 | 0.78 | 0.63 | 0.69 |
| Fixed Asset Turnover | 3.25 | 3.32 | 3.50 | 3.18 | 3.71 |
| Dividend Yield | 3.3% | 3.0% | 3.3% | 3.2% | 4.8% |
*Notes:*
- Net Margin, ROE, and ROIC are expressed as percentages rounded to whole numbers.
- P/E and P/B ratios are multiples.
- Current and Quick Ratios indicate liquidity, below 1 in all years.
- D/E (Debt-to-Equity) and Debt-to-Assets ratios show a moderately leveraged capital structure.
- Interest Coverage ratio declined over the period, indicating lower buffer for interest payments in 2025.
- Asset Turnover and Fixed Asset Turnover reflect moderate efficiency in asset utilization.
- Dividend Yield increased notably in 2025.
Evolution of Financial Ratios
Over the period, Campbell Soup Company’s Return on Equity (ROE) showed a declining trend from a high of 31.79% in 2021 to 15.43% in 2025, indicating reduced profitability. The Current Ratio consistently remained below 1, fluctuating but generally low, reflecting limited short-term liquidity. Meanwhile, the Debt-to-Equity Ratio increased over time, reaching 1.85 in 2025, suggesting a growing reliance on debt financing.
Are the Financial Ratios Fovorable?
In 2025, profitability ratios such as ROE at 15.43% and fixed asset turnover at 3.71 are favorable, while net margin at 5.87% is neutral. Liquidity ratios remain unfavorable, with a current ratio of 0.77 and quick ratio of 0.28. Leverage appears unfavorable due to a high debt-to-equity ratio of 1.85, though debt-to-assets is neutral at 48.42%. Market valuation ratios like P/E of 15.98 and P/B of 2.47 are neutral. Overall, the ratios suggest a slightly favorable financial position.
Shareholder Return Policy
Campbell Soup Company maintains a consistent dividend policy with a payout ratio around 76% in 2025 and an annual yield near 4.77%. Dividends per share have shown a steady increase, supported by free cash flow coverage above 60%. The company also executes share buybacks, balancing shareholder returns.
While the payout ratio is relatively high, dividend and buyback coverage by operating cash flow suggests a commitment to sustainable distributions. The policy appears aligned with long-term shareholder value creation, though a high payout ratio warrants monitoring for potential risks in cash flow volatility.
Score analysis
The following radar chart presents a comprehensive overview of Campbell Soup Company’s key financial scores:
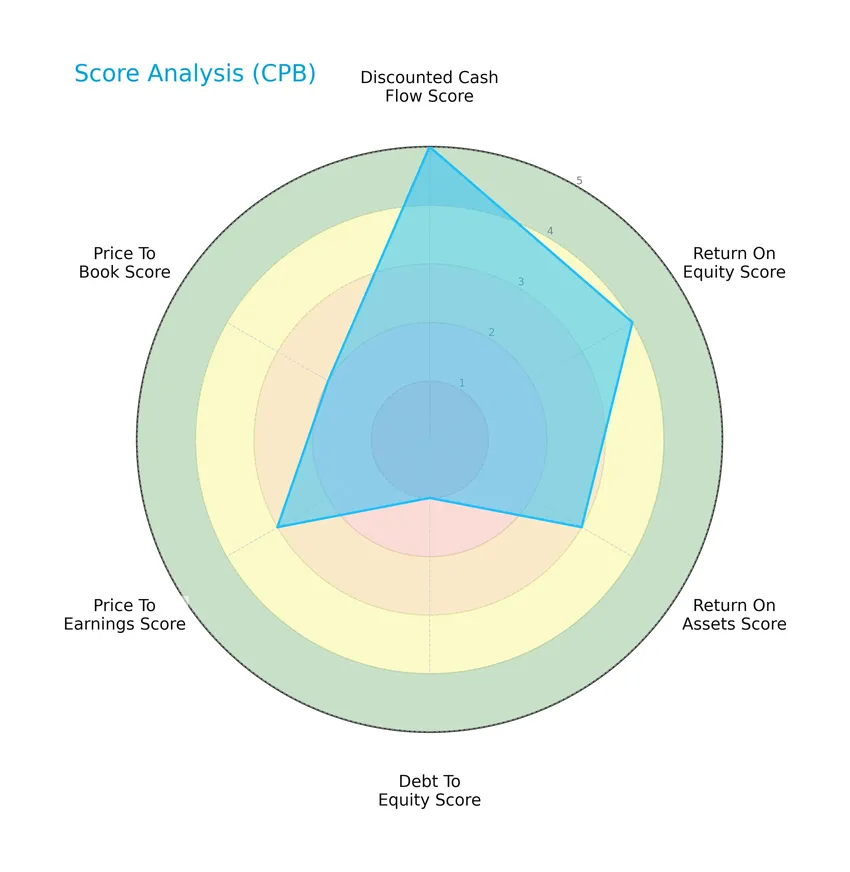
Campbell Soup Company shows a very favorable discounted cash flow score of 5 and a favorable return on equity score of 4. Return on assets and price-to-earnings scores are moderate at 3, while debt-to-equity is very unfavorable at 1, and price-to-book is moderate at 2.
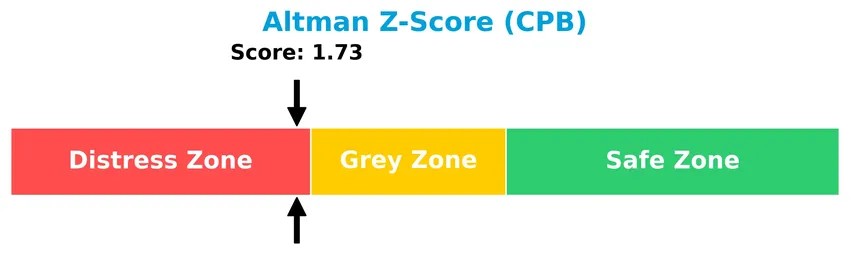
Analysis of the company’s bankruptcy risk
The Altman Z-Score indicates that Campbell Soup Company is currently in the distress zone, suggesting a higher risk of financial distress and potential bankruptcy:
Is the company in good financial health?
The Piotroski Score diagram offers insight into the company’s overall financial health based on nine specific criteria:
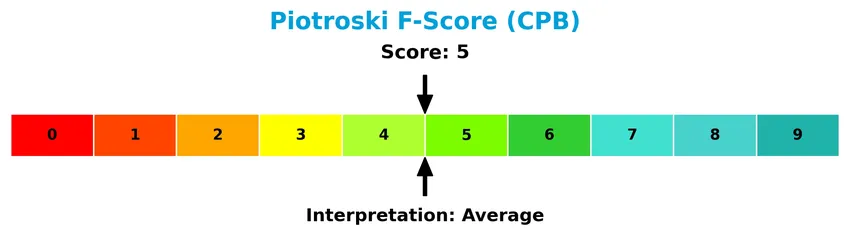
With a Piotroski score of 5, Campbell Soup Company is considered to have average financial health, reflecting a moderate strength in profitability, leverage, liquidity, and operational efficiency.
Competitive Landscape & Sector Positioning
This sector analysis will examine Campbell Soup Company’s strategic positioning, revenue by segment, key products, main competitors, competitive advantages, and SWOT analysis. I will assess whether Campbell Soup Company holds a competitive advantage over its industry peers.
Strategic Positioning
Campbell Soup Company maintains a diversified product portfolio focused on baked snacks ($4.43B in 2025), beverages ($3.05B), and soups ($2.78B), with geographic exposure primarily in the United States, generating over $7.9B in revenue, and smaller international sales around $525M, reflecting a concentration in North America with selective global presence.
Revenue by Segment
This pie chart illustrates Campbell Soup Company’s revenue distribution by product segment for the fiscal year 2025, highlighting the relative size of each business line in their portfolio.
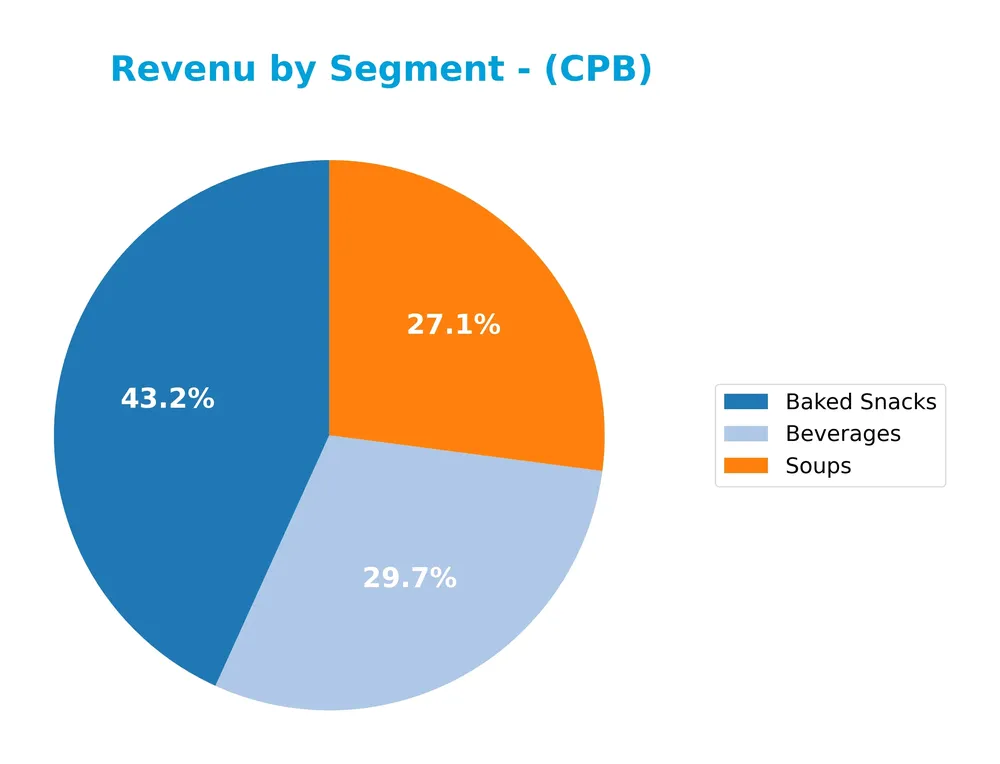
In 2025, Baked Snacks led Campbell’s revenue with $4.4B, followed by Beverages at $3.0B and Soups at $2.8B. The strong growth in Beverages since 2023, where it was notably smaller, signals a strategic shift and diversification away from traditional Soups. Baked Snacks remain the dominant segment, though its revenue slightly contracted from previous years, indicating a potential plateau. This evolving mix lowers concentration risk and suggests a balanced revenue base.
Key Products & Brands
The table below outlines Campbell Soup Company’s main products and brand categories with their descriptions:
| Product | Description |
|---|---|
| Soups | Includes Campbell’s condensed and ready-to-serve soups, Swanson broth and stocks, Pacific Foods broth and soups, and V8 juices. |
| Beverages | Comprises V8 juices and beverages, Campbell’s tomato juice, and non-dairy beverages from Pacific Foods. |
| Simple Meals | Features Campbell’s gravies, pasta, beans, dinner sauces, Swanson canned poultry, and Plum baby food and snacks. |
| Baked Snacks | Encompasses Pepperidge Farm cookies, crackers, fresh bakery, frozen products, Milano cookies, Goldfish crackers, and pretzels. |
| Snacks | Includes Snyder’s of Hanover pretzels, Lance sandwich crackers, Cape Cod and Kettle Brand potato chips, and Pop Secret popcorn. |
Campbell Soup Company operates primarily through its Meals & Beverages and Snacks segments, offering a diverse range of packaged foods from soups and beverages to baked and savory snacks, serving both retail and foodservice markets in North America and Latin America.
Main Competitors
There are 11 competitors in the sector, with the table below listing the top 10 leaders by market capitalization:
| Competitor | Market Cap. |
|---|---|
| JBS N.V. | 31.99B |
| The Kraft Heinz Company | 28.87B |
| General Mills, Inc. | 24.90B |
| McCormick & Company, Incorporated | 18.06B |
| Hormel Foods Corporation | 12.87B |
| The J. M. Smucker Company | 10.31B |
| The Magnum Ice Cream Company N.V. | 9.70B |
| Pilgrim’s Pride Corporation | 9.26B |
| Conagra Brands, Inc. | 8.28B |
| Campbell Soup Company | 8.26B |
Campbell Soup Company ranks 10th among its 11 competitors by market capitalization, holding about 25% of the market cap relative to the leader, JBS N.V. Its market cap is below both the average of the top 10 competitors (16.25B) and the sector median (10.31B). The company is positioned 3.62% below its closest competitor above, Conagra Brands, indicating a narrow gap in scale.
Comparisons with competitors
Check out how we compare the company to its competitors:
Does CPB have a competitive advantage?
Campbell Soup Company presents a slight competitive advantage, as it is creating value with a ROIC exceeding its WACC by 3.7%, though its profitability shows a declining trend. Its gross margin of 30.4% and EBIT margin of 11.1% are favorable, supporting sustained operational efficiency within the packaged foods industry.
Looking ahead, CPB’s diverse product portfolio across Meals & Beverages and Snacks segments, including established brands like Pepperidge Farm and V8, positions it to capitalize on retail, foodservice, and international markets, notably Latin America. Continued innovation and geographic expansion offer opportunities, despite mixed income growth over recent years.
SWOT Analysis
This SWOT analysis provides a clear overview of Campbell Soup Company’s key strategic factors to guide investment decisions.
Strengths
- strong brand portfolio
- favorable EBIT margin at 11.13%
- diversified snacks and beverages segments
Weaknesses
- declining net income over 5 years
- weak liquidity ratios (current ratio 0.77)
- high debt-to-equity at 1.85
Opportunities
- expanding e-commerce distribution
- growth in healthy/snack food trends
- international market expansion potential
Threats
- intense competition in packaged foods
- commodity price volatility
- shifting consumer preferences
Overall, Campbell Soup Company shows solid operational strengths and growth prospects but is challenged by profitability declines and financial leverage. Strategic focus should be on improving efficiency and leveraging growth in snacks and international markets while managing debt risks.
Stock Price Action Analysis
The following weekly chart illustrates Campbell Soup Company’s stock price movements over the past 12 months, highlighting key highs and lows:
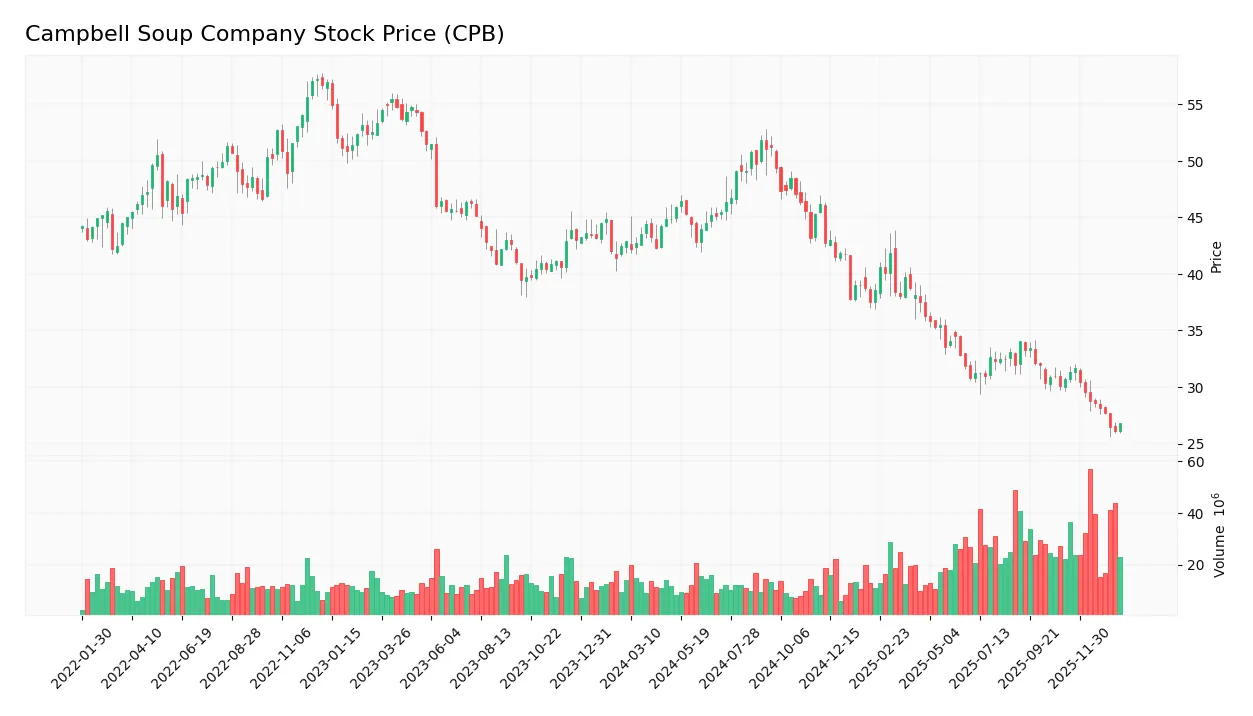
Trend Analysis
Over the past 12 months, Campbell Soup Company’s stock price declined by 37.51%, indicating a bearish trend. The highest price reached 51.89 while the lowest hit 26.08, with volatility reflected in a 6.97 standard deviation. The downward trend shows deceleration, suggesting a slowing pace of decline.
Volume Analysis
Trading volume has been increasing, with total volume surpassing 2.1B shares. However, seller volume dominates at 1.19B versus buyer volume of 943M, comprising 43.56% buyers overall. In the recent period, sellers remain dominant with only 28.18% buyer volume, reflecting sustained selling pressure and cautious investor sentiment.
Target Prices
The consensus target prices for Campbell Soup Company reflect moderate growth expectations.
| Target High | Target Low | Consensus |
|---|---|---|
| 38 | 26 | 30.22 |
Analysts project Campbell Soup’s stock to trade between $26 and $38, with an average target around $30.22, indicating cautious optimism in the near term.

Don’t Let Luck Decide Your Entry Point
Optimize your entry points with our advanced ProRealTime indicators. You’ll get efficient buy signals with precise price targets for maximum performance. Start outperforming now!
Analyst & Consumer Opinions
This section reviews the latest analyst ratings and consumer feedback regarding Campbell Soup Company (CPB) to provide balanced insight.
Stock Grades
Here is a summary of the latest Campbell Soup Company stock grades from leading financial institutions:
| Grading Company | Action | New Grade | Date |
|---|---|---|---|
| Morgan Stanley | Maintain | Equal Weight | 2026-01-16 |
| DA Davidson | Maintain | Neutral | 2025-12-11 |
| Wells Fargo | Maintain | Equal Weight | 2025-12-10 |
| UBS | Maintain | Sell | 2025-12-10 |
| Bernstein | Maintain | Outperform | 2025-12-10 |
| Stifel | Maintain | Hold | 2025-12-10 |
| RBC Capital | Maintain | Sector Perform | 2025-12-10 |
| Stephens & Co. | Maintain | Overweight | 2025-12-08 |
| Morgan Stanley | Maintain | Equal Weight | 2025-12-05 |
| UBS | Maintain | Sell | 2025-12-04 |
The consensus leans toward a Hold rating, with a majority of analysts maintaining neutral or equal weight positions, while a minority suggest Sell or Outperform, indicating a balanced but cautious market outlook.
Consumer Opinions
Consumers have mixed but insightful opinions about Campbell Soup Company, reflecting both appreciation and areas needing improvement.
| Positive Reviews | Negative Reviews |
|---|---|
| “Consistently flavorful soups with a nostalgic taste.” | “Some products feel too salty and overly processed.” |
| “Convenient packaging makes it easy for quick meals.” | “Limited options for low-sodium or health-conscious buyers.” |
| “Reliable quality and widely available in stores.” | “Price increases have made it less affordable.” |
Overall, consumers praise Campbell Soup for its consistent taste and convenience, but frequently mention concerns about high sodium content and recent price hikes as significant drawbacks.
Risk Analysis
Below is a summary table highlighting key risks associated with Campbell Soup Company (CPB) for investors to consider carefully:
| Category | Description | Probability | Impact |
|---|---|---|---|
| Financial Health | Altman Z-Score of 1.73 places CPB in the distress zone, indicating bankruptcy risk. | Medium | High |
| Leverage & Debt | High debt-to-equity ratio of 1.85 and low debt score signal financial vulnerability. | High | Medium |
| Liquidity | Unfavorable current ratio (0.77) and quick ratio (0.28) suggest liquidity constraints. | Medium | Medium |
| Market Volatility | Stock price range wide (25.62–43.85) with beta near zero (-0.043) indicates low market sensitivity but possible price swings. | Low | Low |
| Profitability | Neutral net margin (5.87%) and moderate ROE (15.43%) may limit growth potential. | Medium | Medium |
| Competitive Risk | Intense competition in packaged foods sector could pressure market share and margins. | Medium | Medium |
The most critical risks for Campbell Soup stem from its financial distress signals—particularly the Altman Z-Score indicating a moderate to high bankruptcy risk—and its high leverage with unfavorable liquidity ratios. These factors warrant cautious risk management despite the company’s stable market position and dividend yield.
Should You Buy Campbell Soup Company?
Campbell Soup Company appears to present a profile of moderate profitability with a slightly favorable but declining competitive moat, while its leverage profile suggests substantial debt concerns. Supported by a very favorable B+ overall rating, this analytical interpretation indicates mixed financial health.
Strength & Efficiency Pillars
Campbell Soup Company demonstrates solid profitability with a favorable return on equity (ROE) of 15.43% and a net margin of 5.87%. The company’s return on invested capital (ROIC) stands at 7.96%, comfortably exceeding its weighted average cost of capital (WACC) of 4.24%, which confirms that Campbell Soup is a value creator. Despite a declining ROIC trend, operational efficiency is supported by a robust fixed asset turnover of 3.71 and a healthy dividend yield of 4.77%. The Piotroski score of 5 indicates average financial strength, while the Altman Z-score of 1.73 places it in the distress zone, signaling caution on financial stability.
Weaknesses and Drawbacks
Key risks for Campbell Soup stem from its financial leverage and liquidity. The debt-to-equity ratio is elevated at 1.85, flagged as very unfavorable, while both the current ratio (0.77) and quick ratio (0.28) indicate weak short-term solvency. Valuation multiples are moderate with a price-to-earnings ratio of 15.98 and price-to-book ratio of 2.47, which suggests the stock trades at a reasonable premium but warrants attention. Market pressure is notable, with recent seller dominance at 71.82% and a steep near-term price decline of 12.85%, reflecting bearish sentiment and increased volatility.
Our Verdict about Campbell Soup Company
The long-term fundamental profile of Campbell Soup Company appears moderately favorable given its value creation and profitability metrics. However, the bearish overall trend and recent pronounced seller dominance may suggest a wait-and-see approach for a more attractive entry point. While the company could appeal for investors seeking dividend income and operational efficiency, its financial distress signals and market weakness might pose short-term headwinds.
Disclaimer: This content is for informational purposes only and does not constitute financial, investment, or other professional advice. Investing in financial markets involves a significant risk of loss, and past performance is not indicative of future results.
Additional Resources
- Rakuten Investment Management Inc. Makes New $1.40 Million Investment in The Campbell’s Company $CPB – MarketBeat (Jan 24, 2026)
- Did Campbell’s (CPB) Executive Share Sale Quietly Recast Its Cost-Savings and Brand Investment Story? – Yahoo Finance (Jan 09, 2026)
- Campbell’s: Buy This 6% Yield While Market Ignores Value (NASDAQ:CPB) – Seeking Alpha (Jan 15, 2026)
- Campbell’s Appoints Todd Cunfer Chief Financial Officer – The Campbell’s Company (Oct 07, 2025)
- Campbell Soup Insider Sells $325K in Stock as Shares Fall 33% This Past Year – The Motley Fool (Jan 09, 2026)
For more information about Campbell Soup Company, please visit the official website: campbellsoupcompany.com