Home > Analyses > Energy > Cameco Corporation
Cameco Corporation powers the world’s clean energy future by supplying critical uranium fuel for nuclear reactors. It dominates the uranium industry through its integrated operations—from mining to fuel fabrication—serving top nuclear utilities across the Americas, Europe, and Asia. Known for operational excellence and innovation, Cameco shapes global nuclear fuel markets. As energy demands evolve, I ask: does Cameco’s current valuation fully reflect its growth prospects and strategic resilience?

Table of contents
Business Model & Company Overview
Cameco Corporation, founded in 1987 and headquartered in Saskatoon, Canada, dominates the uranium industry with a vertically integrated core business spanning exploration, mining, milling, refining, and fuel fabrication. Its ecosystem serves nuclear utilities worldwide, anchoring its leadership in a critical energy sector. The company’s strategic operations blend raw material extraction with advanced fuel services, positioning it uniquely in the global nuclear fuel supply chain.
Cameco’s revenue engine balances uranium concentrate sales with high-value fuel services, including conversion and fabrication of reactor components for CANDU reactors. Its diversified presence in the Americas, Europe, and Asia supports steady demand across mature and emerging nuclear markets. This integration creates a formidable competitive advantage, cementing Cameco’s economic moat and influence in shaping the future of nuclear energy globally.
Financial Performance & Fundamental Metrics
I analyze Cameco Corporation’s income statement, key financial ratios, and dividend payout policy to evaluate its core financial strength and shareholder value creation.
Income Statement
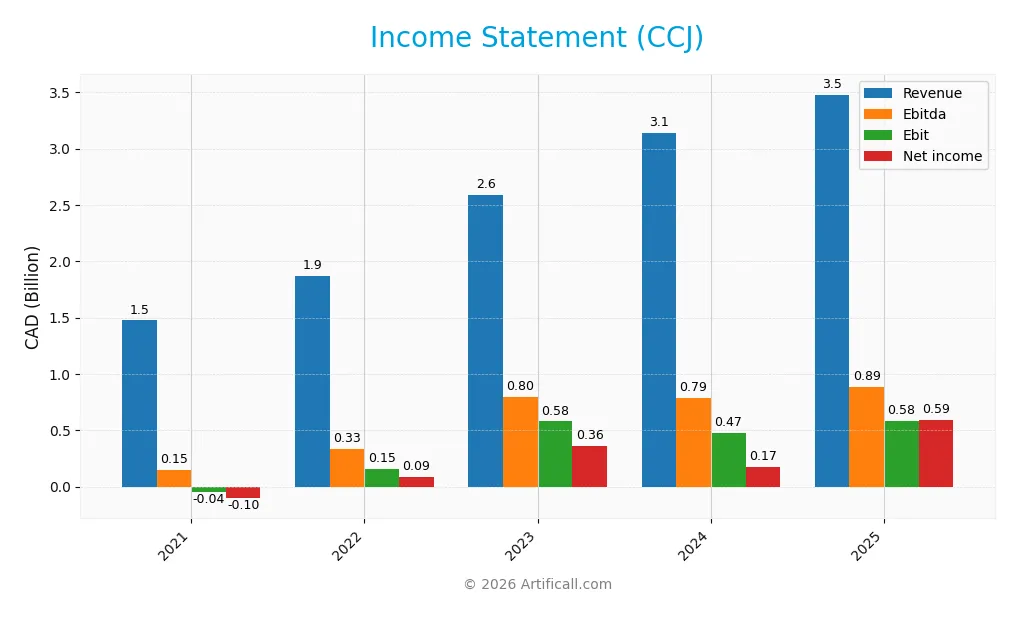
The table below summarizes Cameco Corporation’s key income statement metrics from fiscal years 2021 to 2025, reflecting its financial performance in CAD.
| 2021 | 2022 | 2023 | 2024 | 2025 | |
|---|---|---|---|---|---|
| Revenue | 1.47B | 1.87B | 2.59B | 3.14B | 3.48B |
| Cost of Revenue | 1.47B | 1.63B | 1.81B | 2.07B | 2.55B |
| Operating Expenses | 138M | 218M | 499M | 553M | 349M |
| Gross Profit | 1.93M | 233M | 782M | 1.06B | 930M |
| EBITDA | 147M | 331M | 800M | 789M | 885M |
| EBIT | -43M | 154M | 579M | 475M | 580M |
| Interest Expense | 56M | 56M | 76M | 111M | 74M |
| Net Income | -103M | 89M | 361M | 172M | 589M |
| EPS | -0.26 | 0.22 | 0.83 | 0.40 | 1.35 |
| Filing Date | 2022-03-22 | 2023-03-29 | 2024-03-22 | 2025-03-21 | 2026-03-19 |
Income Statement Evolution
Cameco’s revenue grew strongly by 136% from 2021 to 2025, with a 10.95% increase from 2024 to 2025. Net income surged 674% over the same period, reflecting a sharp margin expansion. Gross margin softened slightly in the last year, declining 12.55%, but EBIT and net margins both improved significantly, indicating better cost control and profitability.
Is the Income Statement Favorable?
In 2025, Cameco posted revenue of 3.48B CAD and net income of 589M CAD, yielding a solid net margin near 17%. EBIT margin stood at 16.68%, supported by disciplined operating expenses and low interest expense at 2.14% of revenue. Despite a minor drop in gross profit, the overall fundamentals point to a favorable income statement driven by strong earnings growth and efficient capital allocation.
Financial Ratios
The table below summarizes key financial ratios for Cameco Corporation (CCJ) over the last five fiscal years, providing a clear view of profitability, liquidity, leverage, and market valuation metrics:
| Ratios | 2021 | 2022 | 2023 | 2024 | 2025 |
|---|---|---|---|---|---|
| Net Margin | -7% | 5% | 14% | 5% | 17% |
| ROE | -2% | 2% | 6% | 3% | 9% |
| ROIC | -2% | 0% | 2% | 4% | 5% |
| P/E | -107 | 139 | 69 | 187 | 93 |
| P/B | 2.26 | 2.13 | 4.06 | 5.05 | 7.92 |
| Current Ratio | 5.18 | 5.92 | 1.55 | 1.62 | 2.47 |
| Quick Ratio | 3.96 | 4.46 | 0.84 | 0.80 | 1.68 |
| D/E | 0.21 | 0.17 | 0.29 | 0.20 | 0.15 |
| Debt-to-Assets | 13% | 12% | 18% | 13% | 10% |
| Interest Coverage | -2.5 | 0.3 | 3.7 | 4.6 | 7.8 |
| Asset Turnover | 0.20 | 0.22 | 0.26 | 0.32 | 0.34 |
| Fixed Asset Turnover | 0.41 | 0.54 | 0.77 | 0.95 | 1.05 |
| Dividend Yield | 0.29% | 0.42% | 0.21% | 0.22% | 0.19% |
Evolution of Financial Ratios
From 2021 to 2025, Cameco’s Return on Equity (ROE) improved from negative to 8.54%, although it remains below industry standards. The Current Ratio declined from a very high 5.18 in 2021 to a more balanced 2.47 in 2025, signaling improved liquidity management. Debt-to-Equity Ratio steadily decreased to 0.15, reflecting a conservative leverage approach. Profitability margins stabilized and improved, notably net profit margin reaching 16.93% in 2025.
Are the Financial Ratios Favorable?
In 2025, liquidity ratios like Current (2.47) and Quick (1.68) ratios are favorable, indicating solid short-term financial health. Leverage metrics, including Debt-to-Equity (0.15) and Debt-to-Assets (9.93%), also appear prudent. However, profitability indicators such as ROE (8.54%) and ROIC (4.77%) are unfavorable relative to the sector, suggesting suboptimal capital efficiency. Valuation multiples, including PE (92.78) and PB (7.92), remain stretched, while asset turnover is weak at 0.34. Overall, the financial ratios present a neutral profile.
Shareholder Return Policy
Cameco Corporation maintains a modest dividend payout ratio around 18%, with dividends per share rising to 0.24 CAD in 2025. The annual dividend yield remains low at approximately 0.19%, supported by share buybacks and coverage from free cash flow.
This cautious distribution aligns with sustainable value creation given the company’s robust cash flow and capital expenditure coverage. The blend of dividends and buybacks appears prudent, balancing shareholder returns with reinvestment needs amid industry volatility.
Score analysis
The radar chart below illustrates the company’s key financial scores reflecting profitability, leverage, and valuation metrics:
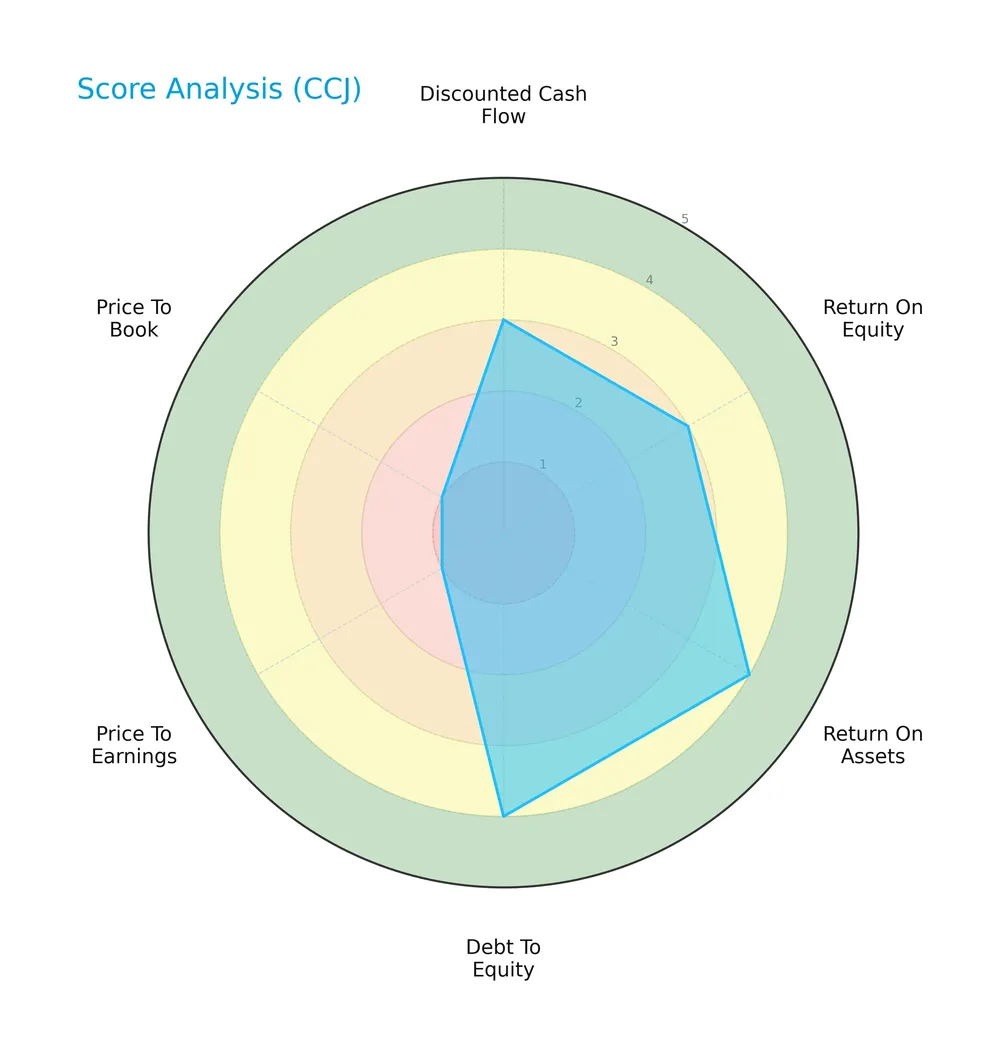
Cameco Corporation shows moderate scores in discounted cash flow and return on equity. Return on assets and debt to equity scores are favorable. Price-to-earnings and price-to-book scores remain very unfavorable, indicating valuation concerns.
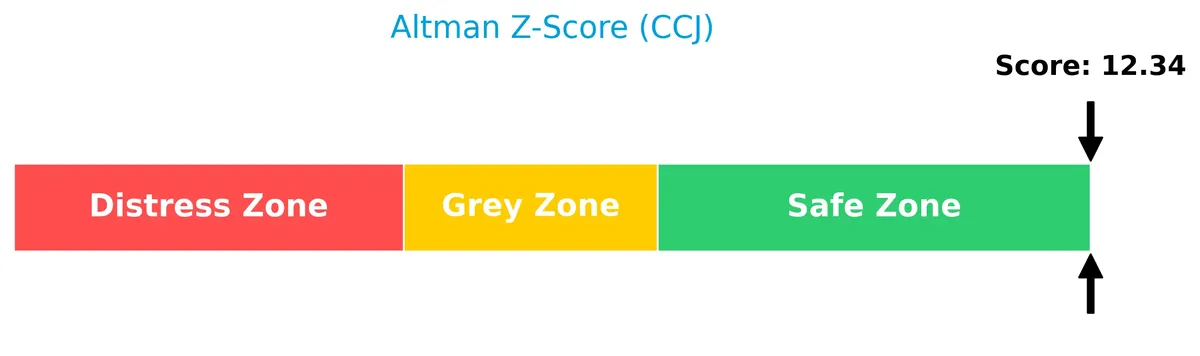
Analysis of the company’s bankruptcy risk
The Altman Z-Score places the company well within the safe zone, signaling very low bankruptcy risk:
Is the company in good financial health?
The Piotroski Score diagram presents a strong financial health profile based on nine fundamental criteria:
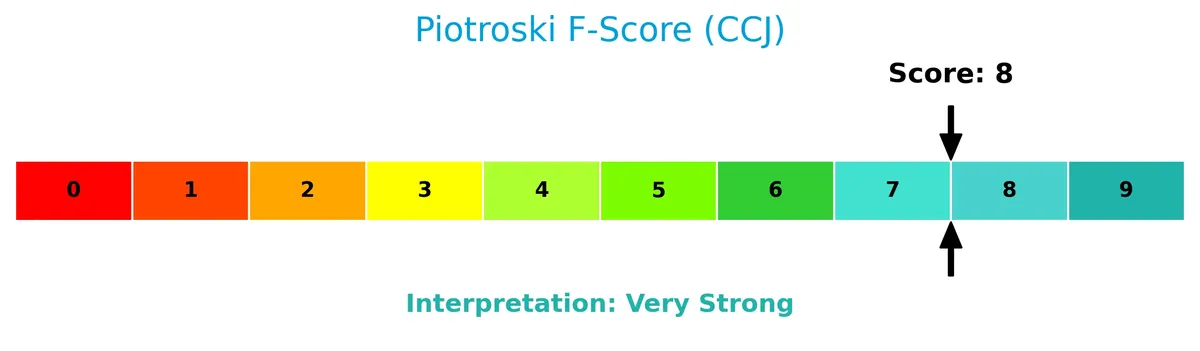
With a Piotroski Score of 8, the company demonstrates very strong financial strength, highlighting solid profitability, liquidity, and operational efficiency.
Competitive Landscape & Sector Positioning
This section examines Cameco Corporation’s strategic positioning and revenue breakdown by segment. I will assess if the company holds a competitive advantage over its main competitors in uranium and fuel services.
Strategic Positioning
Cameco Corporation focuses on uranium and fuel services, serving nuclear utilities across the Americas, Europe, and Asia. Its geographic exposure centers mainly on the United States and Canada, with limited revenue contributions from Switzerland and Germany, indicating moderate regional diversification.
Key Products & Brands
Cameco Corporation’s key products and brands focus on uranium and nuclear fuel services:
| Product | Description |
|---|---|
| Uranium Concentrate | Exploration, mining, milling, and sale of uranium concentrate to nuclear utilities worldwide. |
| Fuel Services | Refining, conversion, fabrication of uranium concentrate, and production of fuel bundles. |
| CANDU Reactor Components | Manufacture of fuel bundles and reactor components specifically for CANDU nuclear reactors. |
Cameco operates two main segments: Uranium and Fuel Services. Both serve nuclear utilities across the Americas, Europe, and Asia, emphasizing a vertically integrated uranium supply chain.
Main Competitors
There are 10 competitors in the uranium industry; below are the top 10 leaders by market capitalization:
| Competitor | Market Cap. |
|---|---|
| Cameco Corporation | 39.8B |
| NexGen Energy Ltd. | 6.0B |
| Uranium Energy Corp. | 5.6B |
| Centrus Energy Corp. | 4.2B |
| Energy Fuels Inc. | 3.5B |
| Denison Mines Corp. | 2.4B |
| Ur-Energy Inc. | 507M |
| IsoEnergy Ltd. | 499M |
| Uranium Royalty Corp. | 471M |
| enCore Energy Corp. | 464M |
Cameco Corporation ranks first among its uranium peers, with a market cap 14% above the next largest competitor. Its capitalization far exceeds both the average top 10 market cap of 6.4B and the sector median of 2.9B. The gap between Cameco and NexGen Energy, the closest rival, underscores its dominant scale in this industry.
Does CCJ have a competitive advantage?
Cameco Corporation currently shows a competitive disadvantage, as its ROIC falls below its WACC, indicating value destruction despite improving profitability. The company’s income statement trends are favorable, with strong revenue and net margin growth suggesting operational improvements.
Looking ahead, Cameco benefits from its diversified uranium and fuel services segments, serving key global nuclear markets in the Americas, Europe, and Asia. Expansion opportunities may arise from new reactor fuel technologies and growing nuclear demand, potentially enhancing its competitive positioning.
Comparisons with competitors
Check out how we compare the company to its competitors:
SWOT Analysis
This SWOT analysis highlights Cameco Corporation’s core strengths, weaknesses, opportunities, and threats to guide strategic decisions.
Strengths
- Strong uranium production expertise
- Favorable net margin of 16.93%
- Low debt-to-equity ratio at 0.15
Weaknesses
- ROIC below WACC, indicating value destruction
- High P/E of 92.78 signals overvaluation
- Weak asset turnover at 0.34
Opportunities
- Rising global nuclear energy demand
- Expansion into fuel services and reactor components
- Growing ROIC trend suggests improving profitability
Threats
- Volatile uranium prices
- Regulatory and geopolitical risks
- Competition from alternative energy sources
Cameco’s strengths in uranium production and solid profitability position it well in the energy sector. However, value destruction and high valuation require caution. The company’s improving profitability and sector tailwinds offer upside if risks around pricing and regulation are managed prudently.
Stock Price Action Analysis
The weekly stock chart illustrates Cameco Corporation’s price movements and volatility over the past 12 months:
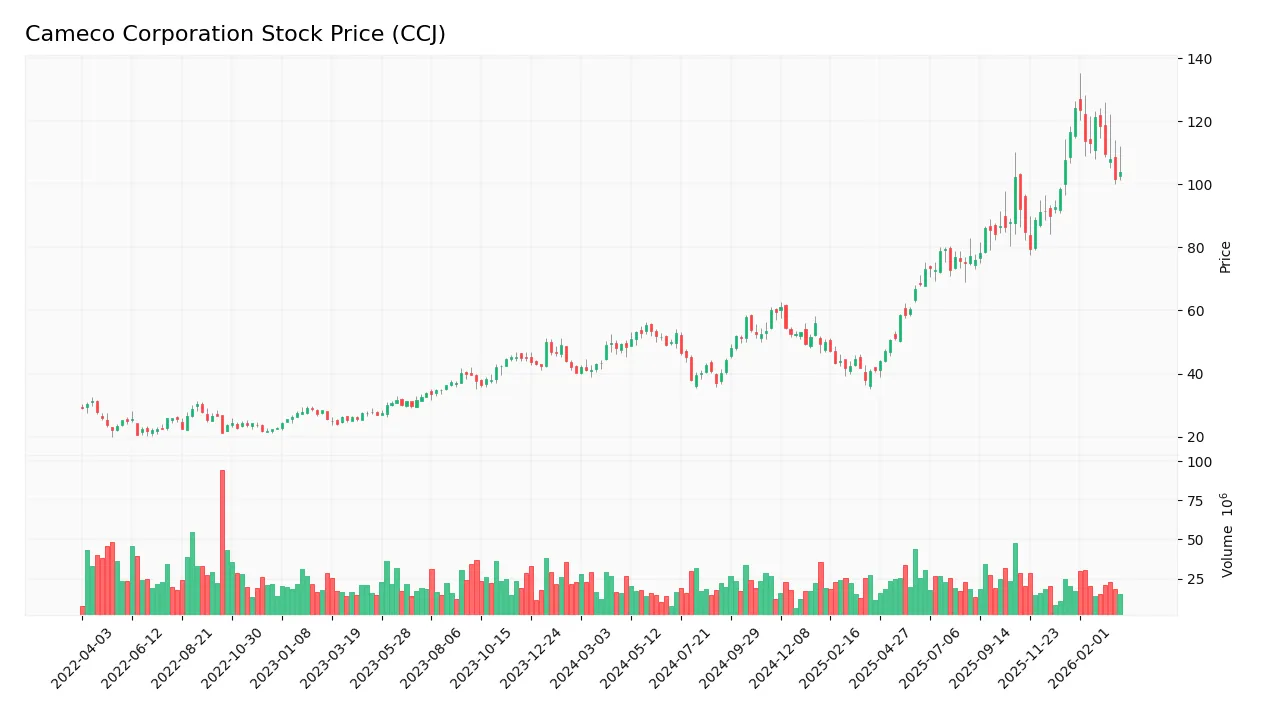
Trend Analysis
Over the past 12 months, Cameco’s stock price surged 114.67%, indicating a strong bullish trend despite decelerating momentum. The price ranged between 36.96 and 124.04, with a high standard deviation of 23.79, reflecting significant volatility. However, the recent 2.5-month trend reversed, declining 3.38%, signaling a short-term bearish phase.
Volume Analysis
Trading volume over the last three months is decreasing, with seller volume (158M) notably exceeding buyer volume (91M). Buyer dominance dropped to 36.68%, indicating a seller-driven market. This suggests waning investor enthusiasm and reduced market participation, consistent with the recent price decline.
Target Prices
Analysts set a consensus target price reflecting moderate upside potential for Cameco Corporation.
| Target Low | Target High | Consensus |
|---|---|---|
| 99.74 | 147 | 125.91 |
The target range signals cautious optimism, with most analysts expecting the stock to appreciate steadily from current levels.
Analyst & Consumer Opinions
This section examines Cameco Corporation’s analyst ratings and consumer feedback to provide a comprehensive sentiment overview.

Don’t Let Luck Decide Your Entry Point
Optimize your entry points with our advanced ProRealTime indicators. You’ll get efficient buy signals with precise price targets for maximum performance. Start outperforming now!
Stock Grades
Below is the latest summary of Cameco Corporation’s stock grades from recognized analysts, showing recent updates and actions taken:
| Grading Company | Action | New Grade | Date |
|---|---|---|---|
| GLJ Research | Maintain | Buy | 2026-02-18 |
| RBC Capital | Maintain | Outperform | 2026-02-17 |
| RBC Capital | Maintain | Outperform | 2025-11-13 |
| RBC Capital | Maintain | Outperform | 2025-10-31 |
| Goldman Sachs | Maintain | Buy | 2025-10-29 |
| RBC Capital | Maintain | Outperform | 2025-08-01 |
| RBC Capital | Maintain | Outperform | 2025-06-20 |
| GLJ Research | Maintain | Buy | 2025-06-12 |
| Goldman Sachs | Maintain | Buy | 2025-06-11 |
| GLJ Research | Maintain | Buy | 2025-03-12 |
The consensus among analysts is stable and positive, with consistent “Buy” and “Outperform” ratings. No downgrades appear, reflecting sustained confidence in the stock’s outlook.
Consumer Opinions
Cameco Corporation’s consumer sentiment reveals a mix of admiration for its industry leadership and concerns over operational challenges.
| Positive Reviews | Negative Reviews |
|---|---|
| Reliable supply of uranium fuels global energy needs. | Customer service response times can be slow. |
| Strong commitment to sustainable mining practices. | Pricing volatility impacts contract stability. |
| Transparent communication about environmental impact. | Some delays in project timelines reported. |
Overall, consumers appreciate Cameco’s sustainability focus and transparency. However, recurring issues with service responsiveness and operational delays temper enthusiasm.
Risk Analysis
Below is a summary table of key risks facing Cameco Corporation, highlighting their likelihood and potential impact:
| Category | Description | Probability | Impact |
|---|---|---|---|
| Market Volatility | Uranium prices are highly cyclical, influenced by geopolitical tensions. | High | High |
| Regulatory Risk | Nuclear energy regulations vary globally and can restrict operations. | Medium | High |
| Valuation Risk | Elevated P/E (92.8) and P/B (7.9) ratios suggest overvaluation risk. | High | Medium |
| Operational Risk | Low asset turnover (0.34) indicates potential inefficiencies. | Medium | Medium |
| Dividend Risk | Very low dividend yield (0.19%) may disappoint income-focused investors. | Medium | Low |
The most pressing risks are uranium market volatility and regulatory uncertainty, both with high potential impact. Cameco’s premium valuation metrics raise caution amid cyclical sector dynamics. However, strong liquidity and a robust Altman Z-score (12.3) support financial stability.
Should You Buy Cameco Corporation?
Cameco appears to be in a very favorable rating category with a strong leverage profile and improving operational efficiency. While its competitive moat seems slightly unfavorable due to value destruction, growing profitability suggests potential value creation.
Strength & Efficiency Pillars
Cameco Corporation posts solid operational efficiency with a net margin of 16.93% and an EBIT margin of 16.68%. Its gross margin of 26.73% reflects strong cost control in a volatile sector. The company’s ROIC stands at 4.77%, below its WACC of 8.61%, indicating it currently destroys value despite improving profitability trends. Nevertheless, a very strong Piotroski score of 8 signals robust financial strength, and a safe Altman Z-Score of 12.34 confirms low bankruptcy risk.
Weaknesses and Drawbacks
Valuation metrics raise red flags. Cameco trades at a stretched P/E of 92.78 and a P/B of 7.92, suggesting a highly premium valuation that may limit upside. While leverage ratios are favorable (debt-to-equity of 0.15), the recent seller dominance with only 36.68% buyer volume highlights short-term market pressure. This seller bias coupled with decelerating bullish momentum signals caution. Asset turnover is weak at 0.34, hinting at suboptimal asset utilization.
Our Final Verdict about Cameco Corporation
Cameco’s long-term fundamentals appear solid, supported by strong margins and a resilient financial position. However, the stretched valuation and recent seller dominance suggest investors might adopt a wait-and-see stance for a more favorable entry point. The profile could appeal to investors seeking exposure to uranium with a tolerance for valuation risk, but market pressure and deceleration warrant prudence.
Disclaimer: This content is for informational purposes only and does not constitute financial, investment, or other professional advice. Investing in financial markets involves a significant risk of loss, and past performance is not indicative of future results.
Additional Resources
- Exchange Traded Concepts LLC Has $66.18 Million Position in Cameco Corporation $CCJ – MarketBeat (Mar 28, 2026)
- Cameco (CCJ) Gains on Long-Term Nuclear Energy Expansion – Yahoo Finance (Mar 26, 2026)
- Cameco Corporation $CCJ Shares Acquired by SG Americas Securities LLC – MarketBeat (Mar 28, 2026)
- Cameco Corp (CCJ) Shares Up 3.99% on Mar 23 – GuruFocus (Mar 24, 2026)
- Cameco (CCJ) Gains on Long-Term Nuclear Energy Expansion – Insider Monkey (Mar 26, 2026)
For more information about Cameco Corporation, please visit the official website: cameco.com