Home > Analyses > Real Estate > Camden Property Trust
Camden Property Trust transforms how Americans live by managing vibrant, well-designed apartment communities nationwide. As a dominant player in the residential REIT sector, Camden operates nearly 57,000 homes, blending innovation with quality to enhance tenant lifestyles. Its reputation for operational excellence and employee satisfaction stands out in a competitive market. As Camden expands its portfolio, I explore whether its strong fundamentals continue to justify its valuation and growth prospects in 2026.

Table of contents
Business Model & Company Overview
Camden Property Trust, founded in 1993 and headquartered in Houston, TX, stands as a leading force in the residential real estate sector. The company owns and operates 167 multifamily apartment communities totaling 56,850 units, forming a cohesive ecosystem of rental living spaces across the United States. Its core mission centers on the development, acquisition, and management of high-quality apartment homes, reinforcing its dominant market position.
The company’s revenue engine balances property ownership with active development, currently expanding its portfolio with seven properties under construction to reach 59,104 units. Camden’s footprint spans key U.S. markets, leveraging recurring rental income alongside strategic redevelopment to enhance asset value. This disciplined approach creates a robust economic moat, positioning Camden as a pivotal player shaping the future of residential real estate investment.
Financial Performance & Fundamental Metrics
I will analyze Camden Property Trust’s income statement, key financial ratios, and dividend payout policy to assess its core financial health and shareholder value.
Income Statement
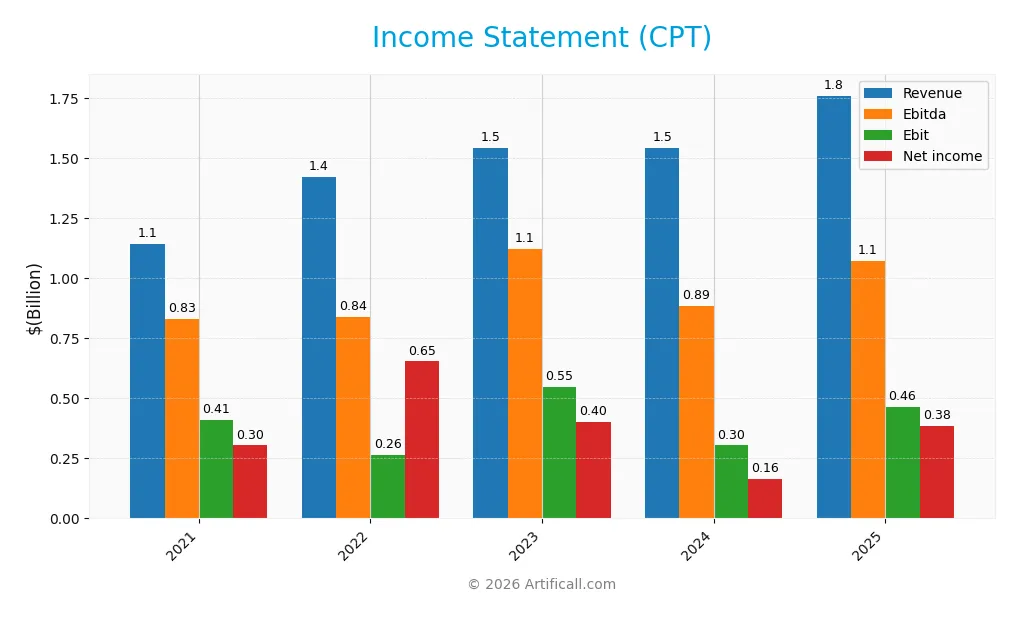
Below is Camden Property Trust’s income statement from 2021 to 2025, showing key profitability and operational metrics in USD.
| 2021 | 2022 | 2023 | 2024 | 2025 | |
|---|---|---|---|---|---|
| Revenue | 1.14B | 1.42B | 1.54B | 1.54B | 1.76B |
| Cost of Revenue | 448M | 529M | 584M | 599M | 1.22B |
| Operating Expenses | 470M | 632M | 634M | 647M | 79M |
| Gross Profit | 696M | 894M | 958M | 945M | 542M |
| EBITDA | 832M | 840M | 1.12B | 886M | 1.07B |
| EBIT | 412M | 263M | 548M | 304M | 463M |
| Interest Expense | 97M | 113M | 133M | 130M | 0 |
| Net Income | 304M | 654M | 404M | 163M | 384M |
| EPS | 2.97 | 6.07 | 3.71 | 1.50 | 3.54 |
| Filing Date | 2022-02-17 | 2023-02-23 | 2024-02-22 | 2025-02-20 | 2026-02-12 |
Income Statement Evolution
From 2021 to 2025, Camden Property Trust’s revenue grew 54% overall, with a 14% jump in 2025 alone. Net income increased 27% over five years, doubling in the last year. Gross profit fell sharply in 2025, causing margins to compress, but EBIT and net margins improved, reflecting better cost control and operational efficiency.
Is the Income Statement Favorable?
The 2025 income statement shows strong fundamentals, with a 21.8% net margin and 26.3% EBIT margin. Revenue and operating expenses grew in tandem, supporting sustainable profit growth. The absence of interest expense enhances profitability. Despite the gross profit decline, the overall income metrics signal a favorable performance for the year.
Financial Ratios
The table below presents key financial ratios for Camden Property Trust (CPT) over the last five fiscal years, offering a snapshot of profitability, valuation, liquidity, leverage, and efficiency metrics:
| Ratios | 2021 | 2022 | 2023 | 2024 | 2025 |
|---|---|---|---|---|---|
| Net Margin | 26.6% | 45.9% | 26.3% | 10.6% | 21.8% |
| ROE | 7.2% | 13.1% | 8.1% | 3.5% | 8.8% |
| ROIC | 2.9% | 2.9% | 3.6% | 3.5% | 4.5% |
| P/E | 60 | 18.4 | 26.7 | 77.1 | 31.0 |
| P/B | 4.34 | 2.41 | 2.17 | 2.69 | 2.73 |
| Current Ratio | 1.84 | 0.07 | 0.65 | 0.10 | 55.5 |
| Quick Ratio | 1.84 | 0.07 | 0.65 | 0.10 | 55.5 |
| D/E | 0.76 | 0.74 | 0.75 | 0.75 | 0.89 |
| Debt-to-Assets | 39.7% | 39.5% | 39.6% | 39.4% | 43.1% |
| Interest Coverage | 2.32 | 2.30 | 2.43 | 2.29 | 0.00 |
| Asset Turnover | 0.14 | 0.15 | 0.16 | 0.17 | 0.19 |
| Fixed Asset Turnover | 166 | 237 | 0.18 | 0.00 | 0.00 |
| Dividend Yield | 1.88% | 3.30% | 4.03% | 3.58% | 3.82% |
Evolution of Financial Ratios
Return on Equity (ROE) declined from 13.1% in 2022 to 8.8% in 2025, showing weakening profitability. The Current Ratio exhibits extreme volatility, jumping from 0.07 in 2022 to 55.5 in 2025, indicating unusual liquidity fluctuations. Debt-to-Equity remained relatively stable around 0.74 to 0.89, reflecting consistent leverage usage over the period.
Are the Financial Ratios Favorable?
In 2025, profitability shows mixed signals: net margin is favorable at 21.8%, but ROE and ROIC fall below the weighted average cost of capital (6.5%), flagging inefficiency. Liquidity metrics diverge, with an unrealistic current ratio but a favorable quick ratio of 55.5. Leverage ratios are neutral, while asset turnover is weak at 0.19. Dividend yield at 3.8% supports shareholder returns. Overall, ratios lean slightly unfavorable.
Shareholder Return Policy
Camden Property Trust (CPT) maintains a stable dividend policy with a payout ratio around 1.08-1.18, reflecting a consistent dividend per share near $4.2 and a dividend yield approximately 3.8%. The company supports distributions with free cash flow coverage, though payout ratios exceeding 1 signal potential sustainability risks.
The firm also engages in share buybacks, complementing dividends as a shareholder return method. This balanced approach aligns with generating steady income while managing capital allocation prudently, supporting sustainable long-term value creation for its investors.
Score analysis
The following radar chart illustrates Camden Property Trust’s key financial scores across valuation, profitability, and leverage metrics:
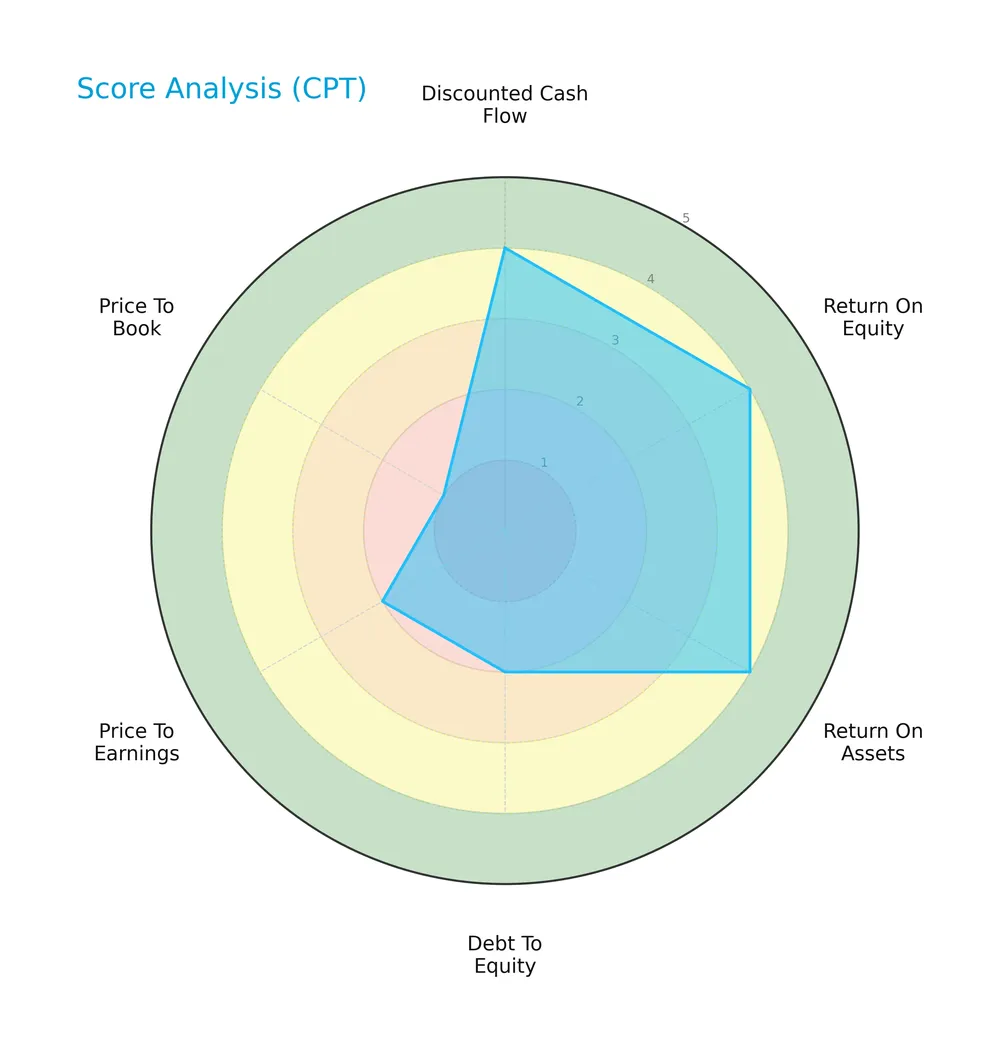
Camden Property Trust shows strong scores in discounted cash flow, return on equity, and return on assets, each rated favorable. However, its debt-to-equity and price-to-earnings scores are unfavorable, with a very unfavorable price-to-book score, indicating valuation concerns despite operational strengths.
Analysis of the company’s bankruptcy risk
Camden Property Trust’s Altman Z-Score places it in the distress zone, signaling a higher risk of financial distress and potential bankruptcy:

Is the company in good financial health?
The Piotroski Score diagram highlights the company’s financial strength based on profitability, leverage, and operational efficiency:

With a very strong Piotroski Score of 8, Camden Property Trust demonstrates robust financial health, reflecting solid fundamentals despite some valuation and leverage challenges.
Competitive Landscape & Sector Positioning
This analysis explores Camden Property Trust’s strategic positioning within the residential REIT sector and its revenue segmentation. I will assess key products, main competitors, and competitive advantages. I aim to determine whether Camden holds a sustainable competitive edge over its rivals.
Strategic Positioning
Camden Property Trust concentrates on multifamily residential real estate, owning 167 properties with 56,850 units across the US. Its portfolio growth targets 174 properties and 59,104 homes, reflecting a focused geographic and product strategy rather than diversification.
Revenue by Segment
The pie chart illustrates Camden Property Trust’s revenue distribution across its main segments for the fiscal year 2018.
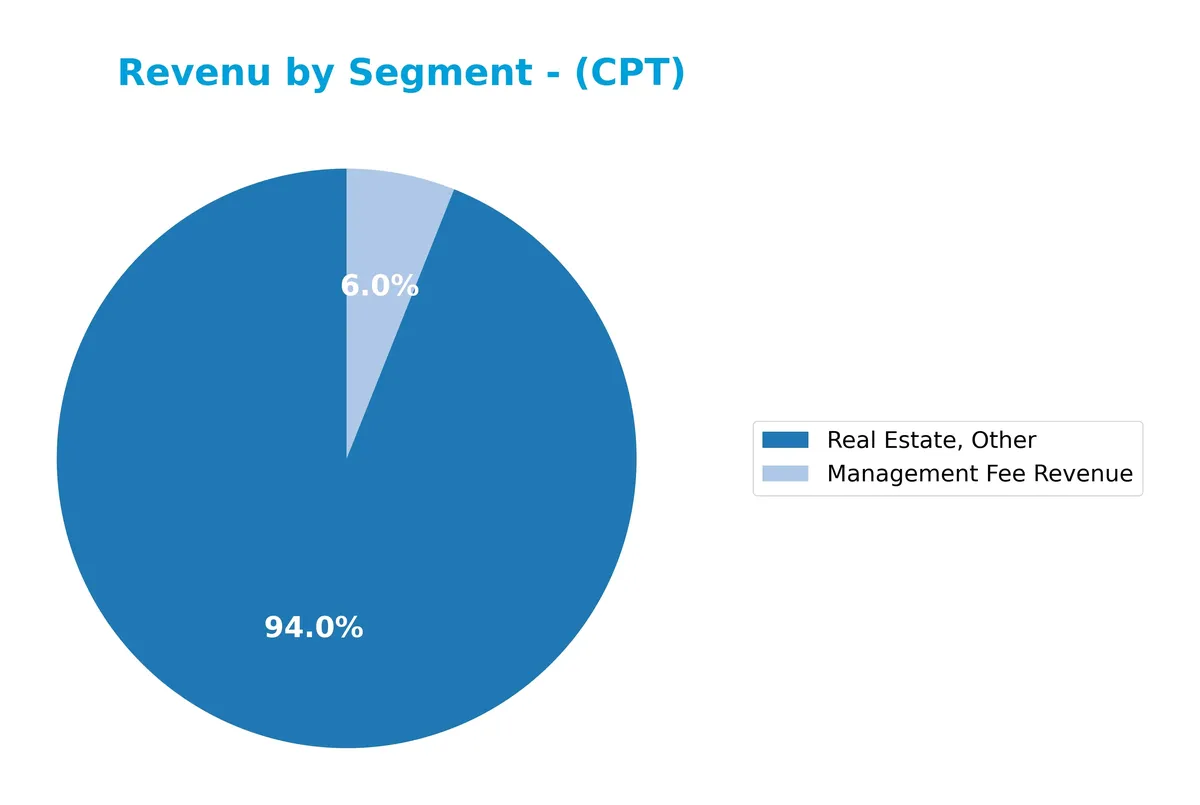
In 2018, “Real Estate, Other” dominated Camden’s revenue at 112.5M, far surpassing “Management Fee Revenue” at 7.2M. This concentration highlights the company’s core dependency on real estate operations. The minimal contribution from fees suggests limited diversification. Investors should watch for shifts in segment revenue to assess evolving business risks or growth avenues.
Key Products & Brands
The following table outlines Camden Property Trust’s primary products and revenue sources:
| Product | Description |
|---|---|
| Management Fee Revenue | Income derived from managing multifamily apartment communities and related property services. |
| Real Estate, Other | Revenue from ownership, leasing, development, and redevelopment of multifamily apartment homes. |
Camden Property Trust generates most revenue from its core real estate operations, focusing on multifamily apartment communities. Management fees provide additional income from property oversight and services.
Main Competitors
There are 7 competitors in the Real Estate REIT – Residential sector; the table below lists the top 7 leaders by market capitalization:
| Competitor | Market Cap. |
|---|---|
| AvalonBay Communities, Inc. | 25.6B |
| Equity Residential | 23.6B |
| Invitation Homes Inc. | 17.0B |
| Essex Property Trust, Inc. | 16.5B |
| Mid-America Apartment Communities, Inc. | 16.3B |
| UDR, Inc. | 12.1B |
| Camden Property Trust | 11.7B |
Camden Property Trust ranks 7th among its peers with a market cap at 45% of the sector leader, AvalonBay Communities. The company’s valuation sits below both the top 10 average (17.6B) and sector median (16.5B). It trails its closest competitor, UDR, by a 5% margin, indicating a modest gap to overcome.
Comparisons with competitors
Check out how we compare the company to its competitors:
Does Camden Property Trust have a competitive advantage?
Camden Property Trust currently shows a competitive disadvantage as its ROIC is below WACC, indicating value destruction despite operational improvements. Its profitability metrics are favorable, yet the company struggles to generate excess returns over its cost of capital.
Looking ahead, Camden is expanding its portfolio with seven new properties under development, increasing apartment homes to 59K across 174 properties. This growth opportunity could improve scale and operational leverage but requires careful monitoring of capital efficiency and market conditions.
SWOT Analysis
This SWOT analysis highlights Camden Property Trust’s core strategic factors to guide investment decisions.
Strengths
- Strong net margin at 21.8%
- Recognized employer with 13 years on Fortune’s top 100
- Robust revenue growth of 53.9% over 5 years
Weaknesses
- ROIC below WACC, indicating value destruction
- High P/E ratio of 31.0 signals expensive valuation
- Low current ratio flags potential liquidity risk
Opportunities
- Expanding portfolio with 7 properties under development
- Growing ROIC trend suggests improving profitability
- Dividend yield of 3.82% attracts income investors
Threats
- Interest rate sensitivity in REIT sector
- Competitive multifamily housing market
- Economic downturn could reduce rental demand
Camden’s strengths in profitability and growth are tempered by value destruction and valuation concerns. The company must leverage its development pipeline and improving ROIC to offset sector risks and liquidity challenges.
Stock Price Action Analysis
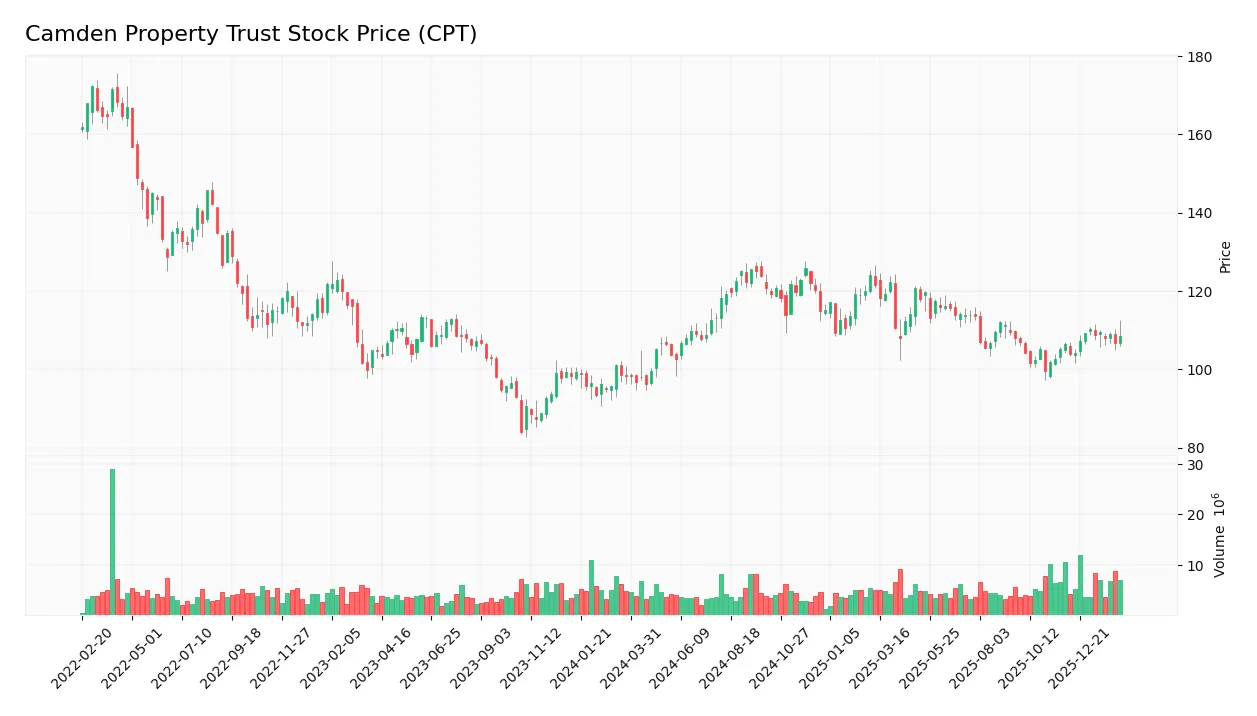
The weekly chart displays Camden Property Trust’s stock price movements over the past 12 months, highlighting key highs and lows:
Trend Analysis
Over the past year, CPT’s stock price rose 10.5%, indicating a bullish trend with clear acceleration. The price fluctuated between 96.29 and 125.8, showing volatility reflected by a 7.45 standard deviation. The recent three-month gain of 2.06% suggests a continued but slower bullish momentum.
Volume Analysis
Trading volume over the last three months shows a buyer-driven market, with buyers accounting for 69.19% of activity. Volume is increasing, signaling strong investor participation and positive sentiment toward the stock during this period. Sellers remain less active, reinforcing the dominant buying pressure.
Target Prices
Analysts present a moderately bullish consensus for Camden Property Trust’s stock price.
| Target Low | Target High | Consensus |
|---|---|---|
| 106 | 133 | 113.71 |
The target range suggests upside potential of about 15% from current levels, reflecting confidence in CPT’s market positioning and growth prospects.

Don’t Let Luck Decide Your Entry Point
Optimize your entry points with our advanced ProRealTime indicators. You’ll get efficient buy signals with precise price targets for maximum performance. Start outperforming now!
Analyst & Consumer Opinions
This section examines analyst grades and consumer feedback related to Camden Property Trust (CPT) for a balanced perspective.
Stock Grades
Here are the latest verified stock grades from leading financial institutions for Camden Property Trust (CPT):
| Grading Company | Action | New Grade | Date |
|---|---|---|---|
| RBC Capital | Maintain | Sector Perform | 2026-02-10 |
| Cantor Fitzgerald | Maintain | Neutral | 2026-02-09 |
| Truist Securities | Maintain | Buy | 2026-01-20 |
| Barclays | Maintain | Equal Weight | 2026-01-13 |
| Mizuho | Maintain | Outperform | 2026-01-12 |
| UBS | Maintain | Neutral | 2026-01-08 |
| JP Morgan | Upgrade | Neutral | 2025-12-18 |
| Truist Securities | Maintain | Buy | 2025-12-15 |
| Wells Fargo | Maintain | Equal Weight | 2025-11-25 |
| Barclays | Downgrade | Equal Weight | 2025-11-25 |
The consensus reflects a stable outlook, with most firms maintaining neutral to buy ratings. Notably, JP Morgan recently upgraded their stance, while Barclays downgraded earlier, indicating some divergence within the sector.
Consumer Opinions
Consumer sentiment around Camden Property Trust (CPT) reflects a mix of satisfaction and areas for improvement. Tenants often praise the company’s community atmosphere but raise concerns about maintenance responsiveness.
| Positive Reviews | Negative Reviews |
|---|---|
| “Friendly staff and well-maintained amenities.” | “Maintenance requests take too long to resolve.” |
| “Great location with convenient access to transit.” | “Rent increases seem steep compared to nearby properties.” |
| “Safe and clean environment with attentive management.” | “Some units experience noise issues from neighboring apartments.” |
Overall, tenants appreciate Camden’s strong community feel and quality amenities. However, delayed maintenance and rent hikes emerge as consistent concerns, suggesting room to improve customer service and pricing strategy.
Risk Analysis
Below is a summary table highlighting key risks Camden Property Trust faces, with their likelihood and potential impact:
| Category | Description | Probability | Impact |
|---|---|---|---|
| Financial Health | Altman Z-Score signals distress zone, risk of financial strain | High | High |
| Valuation | Elevated P/E and weak price-to-book ratios indicate overvaluation risk | Medium | Medium |
| Profitability | ROE and ROIC below WACC suggest inefficiencies in capital use | Medium | Medium |
| Liquidity | Extremely high current and quick ratios could signal asset misallocation | Low | Low |
| Debt Levels | Moderate debt-to-equity and debt-to-assets ratios imply manageable leverage | Medium | Medium |
| Market Volatility | Beta below 1 suggests lower volatility but market swings remain a risk | Medium | Low |
Camden’s most pressing risk lies in its Altman Z-Score of 1.69, placing it in the distress zone. This raises concerns about potential financial instability despite a very strong Piotroski score of 8. Elevated valuation multiples also warrant caution amid uncertain market conditions.
Should You Buy Camden Property Trust?
Camden Property Trust appears to have improving operational efficiency and a slightly unfavorable moat, indicating value destruction despite growing profitability. While its leverage profile raises concerns, the overall B rating suggests a moderate investment profile with notable financial strengths.
Strength & Efficiency Pillars
Camden Property Trust delivers strong operational margins with a gross margin of 30.8% and a net margin of 21.84%, signaling efficient cost management. EBIT margin stands impressively at 26.29%, reflecting robust core profitability. However, the company’s ROIC of 4.54% falls below its WACC of 6.52%, indicating it is currently destroying shareholder value despite improving profitability. The Piotroski Score of 8 reinforces solid financial strength in operational terms.
Weaknesses and Drawbacks
The Altman Z-Score of 1.69 places Camden in the distress zone, signaling a heightened bankruptcy risk despite favorable income metrics. This solvency concern overshadows other positives. Valuation metrics also raise red flags: a high P/E ratio of 31.03 implies premium pricing, while a P/B of 2.73 is neutral but not cheap. The current ratio at 55.52 suggests potential liquidity reporting issues or data anomaly, but it flags caution around short-term asset management.
Our Final Verdict about Camden Property Trust
Despite operational strength and a very strong Piotroski Score, Camden’s Altman Z-Score in the distress zone makes the investment highly speculative. The solvency risk undermines the otherwise favorable profitability profile. Investors should approach with extreme caution, as the risk of financial distress outweighs current income statement strengths.
Disclaimer: This content is for informational purposes only and does not constitute financial, investment, or other professional advice. Investing in financial markets involves a significant risk of loss, and past performance is not indicative of future results.
Additional Resources
- Camden Property Trust (CPT) Valuation After Earnings Beat Sunbelt Shift And $600 Million Buyback – Yahoo Finance (Feb 08, 2026)
- MQS Management LLC Takes $1.01 Million Position in Camden Property Trust $CPT – MarketBeat (Feb 11, 2026)
- Should Camden’s Sunbelt Shift, Buyback Plan, and Dividend Hike Require Action From Camden Property Trust (CPT) Investors? – Sahm (Feb 09, 2026)
- Camden Property Trust (NYSE:CPT) Q4 2025 Earnings Call Transcript – Insider Monkey (Feb 10, 2026)
- RBC Capital Maintains Camden Property Trust(CPT.US) With Hold Rating, Cuts Target Price to $108 – 富途牛牛 (Feb 10, 2026)
For more information about Camden Property Trust, please visit the official website: camdenliving.com