Home > Analyses > Technology > Cadence Design Systems, Inc.
Cadence Design Systems powers the invisible backbone of modern electronics, enabling the creation of chips that drive smartphones, cars, and data centers. As a technology titan, it leads in electronic design automation with flagship platforms like JasperGold and Palladium, renowned for innovation and precision. With semiconductor demand surging, I’m keen to explore whether Cadence’s robust fundamentals still justify its premium valuation and growth ambitions in this evolving market.
Table of contents
Business Model & Company Overview
Cadence Design Systems, Inc., founded in 1987 and headquartered in San Jose, California, leads the software-application industry with a comprehensive ecosystem of design and verification tools. Its portfolio spans functional verification platforms, digital IC design, custom IC simulation, and system design products. This integrated approach supports complex chip and circuit creation across diverse technology sectors, from 5G to aerospace.
The company generates value through a balanced mix of software licenses, hardware emulation, and recurring services, including technical support and hosted design solutions. Cadence maintains a strategic global footprint across the Americas, Europe, and Asia. Its strong economic moat lies in proprietary technology and deep integration within semiconductor workflows, shaping the future of integrated circuit design worldwide.
Financial Performance & Fundamental Metrics
I analyze Cadence Design Systems’ income statement, key financial ratios, and dividend payout policy to assess its core financial health and shareholder returns.
Income Statement
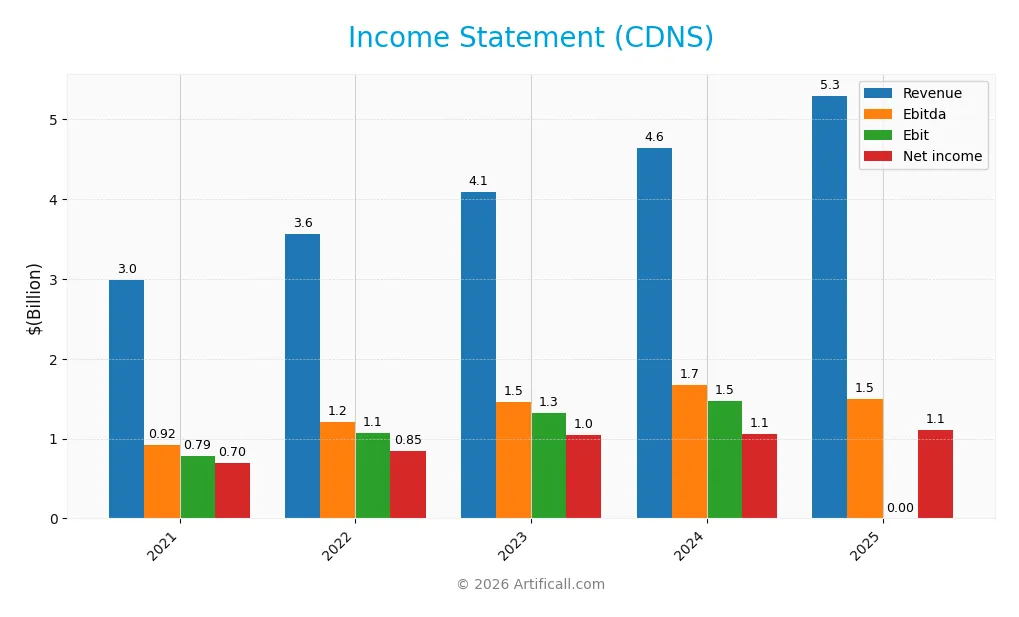
The table below summarizes Cadence Design Systems’ key income statement figures from 2021 to 2025 in USD, highlighting revenue growth and profitability trends.
| 2021 | 2022 | 2023 | 2024 | 2025 | |
|---|---|---|---|---|---|
| Revenue | 2.99B | 3.56B | 4.09B | 4.64B | 5.30B |
| Cost of Revenue | 307M | 372M | 435M | 648M | 762M |
| Operating Expenses | 1.90B | 2.12B | 2.40B | 2.64B | 2.88B |
| Gross Profit | 2.68B | 3.19B | 3.65B | 3.99B | 4.53B |
| EBITDA | 916M | 1.20B | 1.46B | 1.67B | 1.88B |
| EBIT | 785M | 1.07B | 1.32B | 1.47B | 1.65B |
| Interest Expense | 17M | 23M | 36M | 76M | 117M |
| Net Income | 696M | 849M | 1.04B | 1.06B | 1.11B |
| EPS | 2.54 | 3.13 | 3.86 | 3.89 | 4.09 |
| Filing Date | 2022-02-22 | 2023-02-13 | 2024-02-12 | 2025-02-21 | 2026-02-19 |
Income Statement Evolution
Cadence Design Systems showed strong revenue growth from 2021 to 2025, rising 77.25% overall. Net income grew 59.33% over the same period, despite a slight 10.11% decline in net margin. Gross margin remained robust near 85.6%, while EBIT margin held favorably at 31.15%, reflecting stable profitability amidst expanding scale.
Is the Income Statement Favorable?
In 2025, revenue reached $5.3B, up 14.1% year-over-year, with gross profit increasing 13.5% to $4.5B. Operating expenses grew proportionally, supporting an EBIT margin above 31%. Net margin slipped 7.9%, though EPS rose 5.5% to $4.09. Interest expense remained low at 2.2% of revenue. Overall, fundamentals appear favorable, supported by consistent margin strength and solid top-line growth.
Financial Ratios
The following table summarizes key financial ratios for Cadence Design Systems, Inc. over the past five fiscal years:
| Ratios | 2021 | 2022 | 2023 | 2024 | 2025 |
|---|---|---|---|---|---|
| Net Margin | 23% | 24% | 25% | 23% | 21% |
| ROE | 25% | 31% | 31% | 23% | 20% |
| ROIC | 21% | 22% | 23% | 13% | 14% |
| P/E | 73.2 | 51.3 | 70.5 | 77.2 | 76.5 |
| P/B | 18.6 | 15.9 | 21.6 | 17.4 | 15.5 |
| Current Ratio | 1.77 | 1.27 | 1.24 | 2.93 | 2.86 |
| Quick Ratio | 1.65 | 1.17 | 1.13 | 2.74 | 2.67 |
| D/E | 0.17 | 0.32 | 0.22 | 0.55 | 0.45 |
| Debt-to-Assets | 10% | 17% | 13% | 29% | 24% |
| Interest Coverage | 46 | 47 | 35 | 18 | 14 |
| Asset Turnover | 0.68 | 0.69 | 0.72 | 0.52 | 0.52 |
| Fixed Asset Turnover | 6.85 | 6.57 | 7.38 | 7.68 | 10.25 |
| Dividend Yield | 0% | 0% | 0% | 0% | 0% |
Evolution of Financial Ratios
From 2021 to 2025, Cadence Design Systems’ Return on Equity (ROE) fluctuated, peaking in 2023 before moderating by 2025. The Current Ratio improved steadily, rising from 1.77 in 2021 to 2.86 in 2025, indicating stronger liquidity. The Debt-to-Equity Ratio increased from 0.17 in 2021 to 0.45 in 2025, showing a moderate rise in leverage. Profitability margins remained robust but showed slight variation, with net margin around 21% in 2025.
Are the Financial Ratios Fovorable?
In 2025, profitability ratios like ROE (20.3%) and net margin (20.9%) appear favorable against industry norms. Liquidity measures, including a Current Ratio of 2.86 and Quick Ratio of 2.67, also indicate solid short-term financial health. Leverage ratios, such as Debt-to-Equity at 0.45 and Interest Coverage over 14, suggest manageable debt levels. However, valuation multiples like P/E (76.5) and P/B (15.5) are unfavorable, pointing to high market expectations. Overall, the ratio profile is generally favorable with some valuation risks.
Shareholder Return Policy
Cadence Design Systems, Inc. does not pay dividends, reflecting its reinvestment strategy and focus on growth. The company maintains strong free cash flow and has no dividend payout, indicating priority on capital allocation towards innovation or acquisitions.
Despite no dividends, Cadence engages in share buybacks, supporting shareholder value. This approach aligns with sustainable long-term value creation by balancing growth investments and returning capital to investors through buybacks rather than dividends.
Score analysis
The radar chart below presents Cadence Design Systems, Inc.’s key financial scores, which highlight strengths and weaknesses across several valuation and profitability metrics:
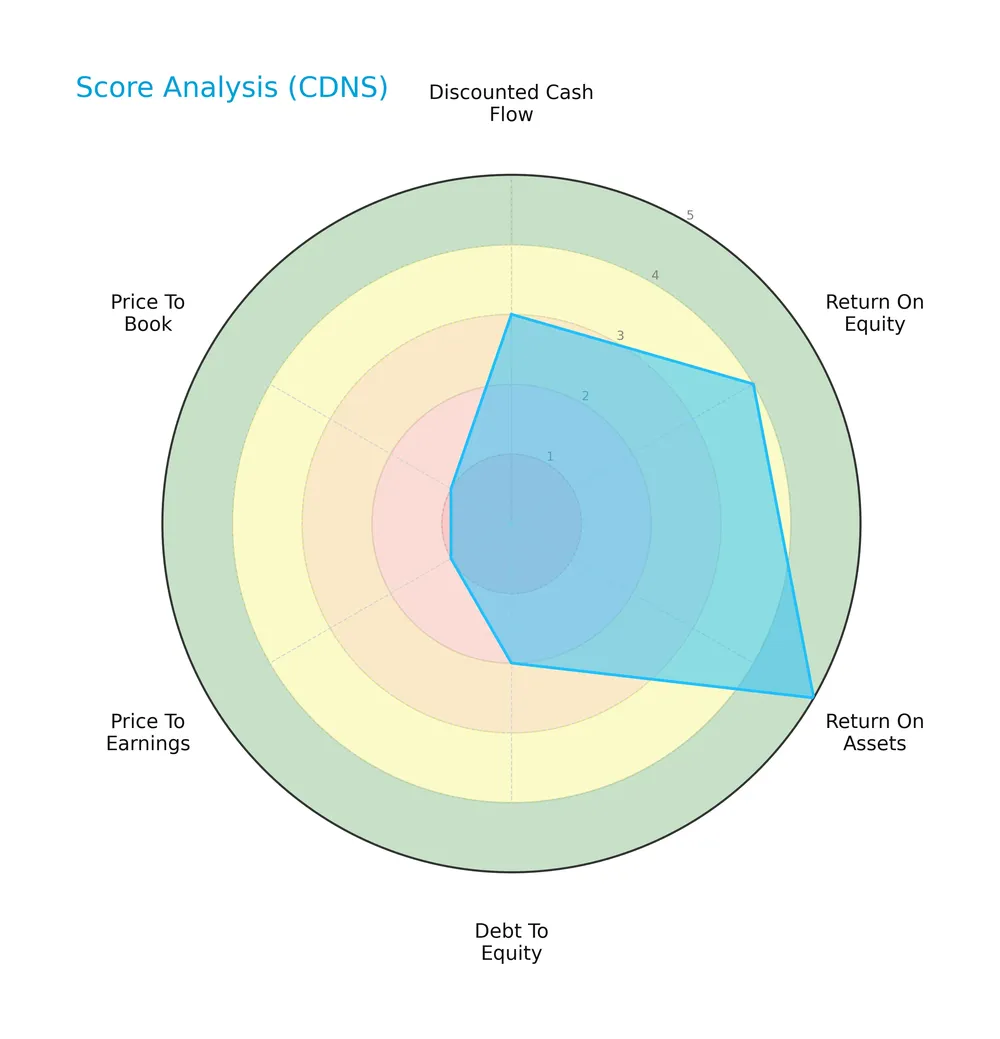
Cadence scores very favorably on return on assets (5) and favorably on return on equity (4). Debt to equity is unfavorable at 2, while valuation metrics price to earnings and price to book are very unfavorable at 1 each. The discounted cash flow score is moderate at 3.
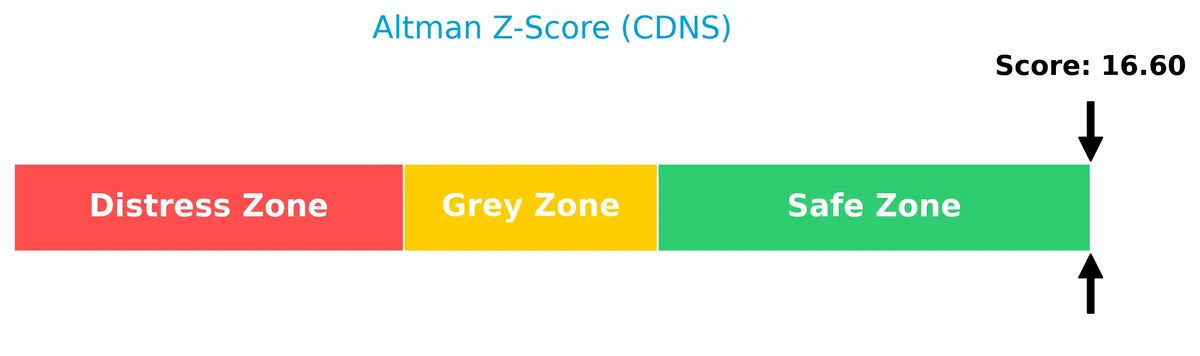
Analysis of the company’s bankruptcy risk
Cadence’s Altman Z-Score places the company firmly in the safe zone, indicating a low risk of bankruptcy and strong financial stability:
Is the company in good financial health?
The Piotroski Score diagram below assesses Cadence’s overall financial health and operational efficiency:
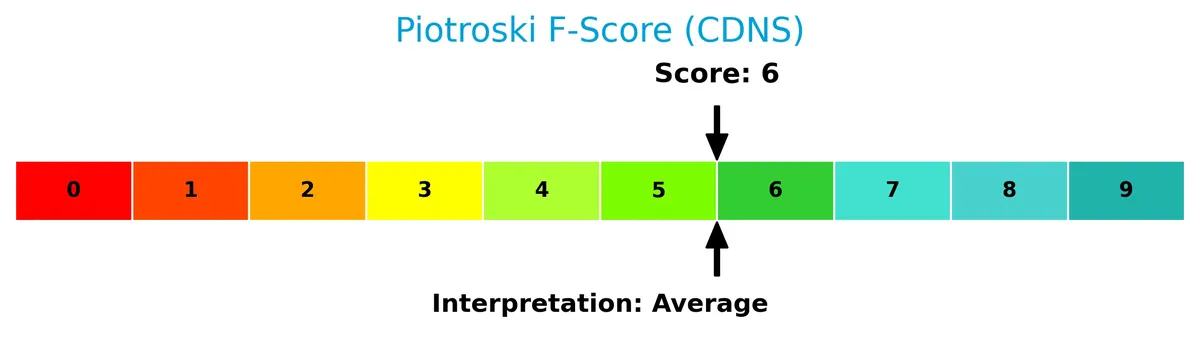
With a Piotroski Score of 6, Cadence is in average financial health. This suggests moderate strength in profitability, leverage, and liquidity, but some room for improvement compared to stronger peers.
Competitive Landscape & Sector Positioning
This section analyzes Cadence Design Systems, Inc.’s position within the technology sector. It explores strategic positioning, revenue breakdown, key products, and primary competitors. I will assess whether Cadence maintains a competitive advantage relative to its peers.
Strategic Positioning
Cadence Design Systems concentrates on software and services for IC design verification and system analysis, with a dominant product and maintenance revenue stream of $4.8B in 2025. Its geographic exposure is diversified, with significant sales across Americas ($2.5B), Asia ($1.7B), and EMEA ($790M), supporting a broad market reach.
Revenue by Segment
This pie chart illustrates Cadence Design Systems’ revenue distribution by segment for fiscal year 2025, highlighting the relative contributions of product and maintenance versus technology services.
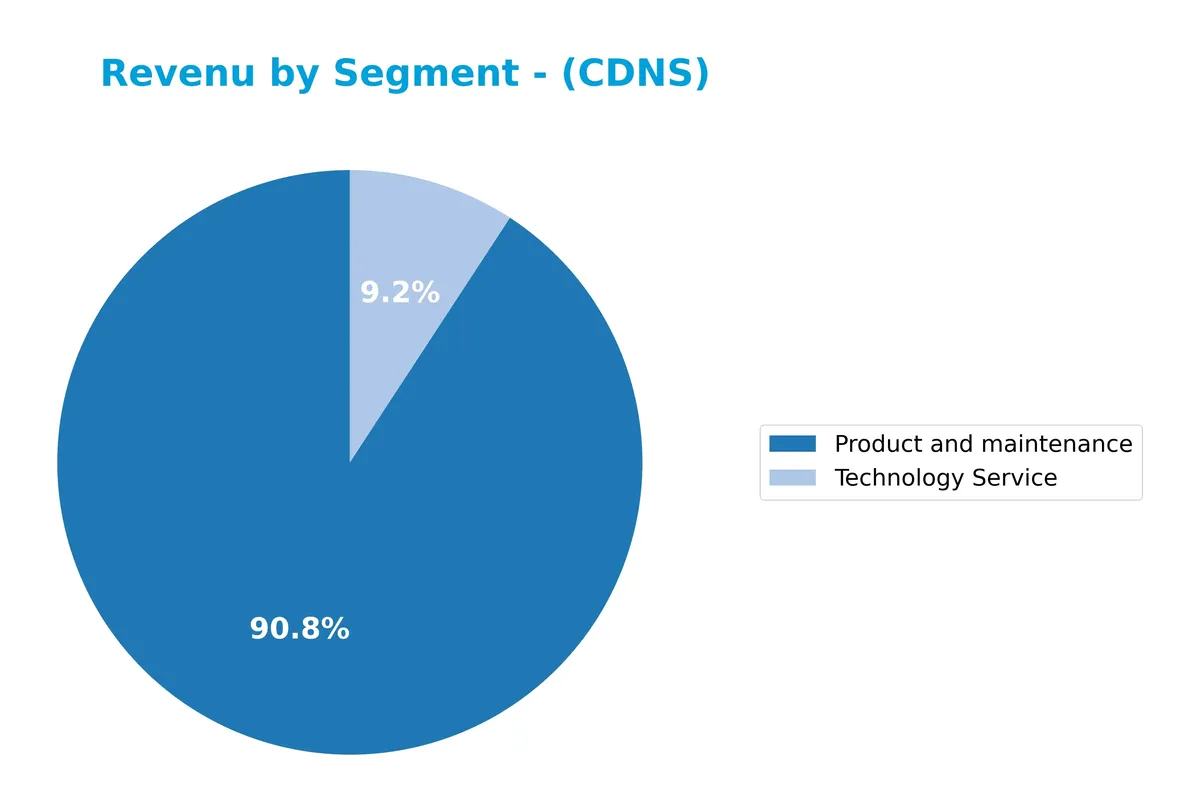
Cadence’s revenue is heavily driven by its product and maintenance segment, which reached $4.82B in 2025, up from $4.21B in 2024. Technology services, while smaller at $475M, also showed steady growth. The strong acceleration in product revenue underlines Cadence’s moat in design software, though reliance on this segment signals some concentration risk if market dynamics shift.
Key Products & Brands
Cadence Design Systems offers a diverse portfolio of software and hardware solutions for IC design verification and implementation:
| Product | Description |
|---|---|
| JasperGold | Formal verification platform used to mathematically prove correctness of chip designs. |
| Xcelium | Parallel logic simulation platform accelerating functional verification. |
| Palladium | Enterprise emulation platform enabling large-scale chip verification at high speeds. |
| Protium | Prototyping platform for hardware chip verification before silicon fabrication. |
| Genus | Logic synthesis tool optimizing digital integrated circuit design. |
| Joules | RTL power analysis solution to estimate and reduce chip power consumption. |
| Modus | Software reducing system-on-chip design-for-test time, improving manufacturing efficiency. |
| Physical Implementation Tools | Includes place and route, optimization, and multiple patterning preparation for chip layout finalization. |
| Signoff Products | Tools certifying design readiness for silicon manufacturing. |
| Custom IC Design & Simulation | Products for schematic and physical circuit representations, covering analog, mixed-signal, and RF designs. |
| System Design & Analysis | Solutions for printed circuit board and IC package development, plus multi-physics effects analysis. |
| Intellectual Property (IP) Products | Pre-verified, customizable blocks integrated into customer ICs to speed development. |
| Verification IP & Memory Models | Emulate and model standard industry interface protocols for system validation. |
| Technology Services | Methodology consulting, education, hosted design, technical support, and maintenance services. |
Cadence’s revenues mainly derive from product sales and maintenance, totaling $4.82B in 2025, complemented by $475M from technology services. Its offerings cover the full chip design lifecycle, addressing key markets like 5G, automotive, and aerospace.
Main Competitors
Cadence Design Systems, Inc. faces competition from 33 companies, with the table below listing the top 10 leaders by market capitalization:
| Competitor | Market Cap. |
|---|---|
| Salesforce, Inc. | 242B |
| Shopify Inc. | 210B |
| AppLovin Corporation | 209B |
| Intuit Inc. | 175B |
| Uber Technologies, Inc. | 172B |
| ServiceNow, Inc. | 153B |
| Cadence Design Systems, Inc. | 84.5B |
| Snowflake Inc. | 73.4B |
| Autodesk, Inc. | 61.2B |
| Workday, Inc. | 54.9B |
Cadence ranks 7th among its competitors, with a market cap about 33% of the leader, Salesforce. It stands below the average top 10 market cap of 144B but above the sector median of 18.8B. Cadence’s market cap is 89.7% lower than the next competitor above, ServiceNow, highlighting a significant gap to its closest rival.
Comparisons with competitors
Check out how we compare the company to its competitors:
Does CDNS have a competitive advantage?
Cadence Design Systems presents a competitive advantage, evidenced by a ROIC exceeding WACC by nearly 6%, indicating value creation. However, its declining ROIC trend signals some erosion in profitability.
Looking ahead, CDNS’s diverse portfolio—including functional verification platforms and digital IC design products—positions it well to capture growth in 5G, automotive, and hyperscale computing markets. Expansion into new geographies and advanced chip verification tools offer further growth opportunities.
SWOT Analysis
This analysis highlights Cadence Design Systems’ key strategic factors to guide investment decisions.
Strengths
- strong 20.94% net margin
- ROIC exceeds WACC, creating value
- global market leadership in chip design software
Weaknesses
- high P/E of 76.5 signals overvaluation risk
- declining ROIC trend
- no dividend yield to attract income investors
Opportunities
- growth in 5G and AI chip demand
- expansion in Asia-Pacific markets
- increasing adoption of advanced verification tools
Threats
- intense competition from Synopsys and Mentor
- cyclical semiconductor industry risks
- potential tech regulation and export limits
Cadence’s strong profitability and market position create a solid foundation, but investors must watch valuation and declining ROIC. The company’s growth depends on capitalizing on emerging tech demand while mitigating competitive and geopolitical risks.
Stock Price Action Analysis
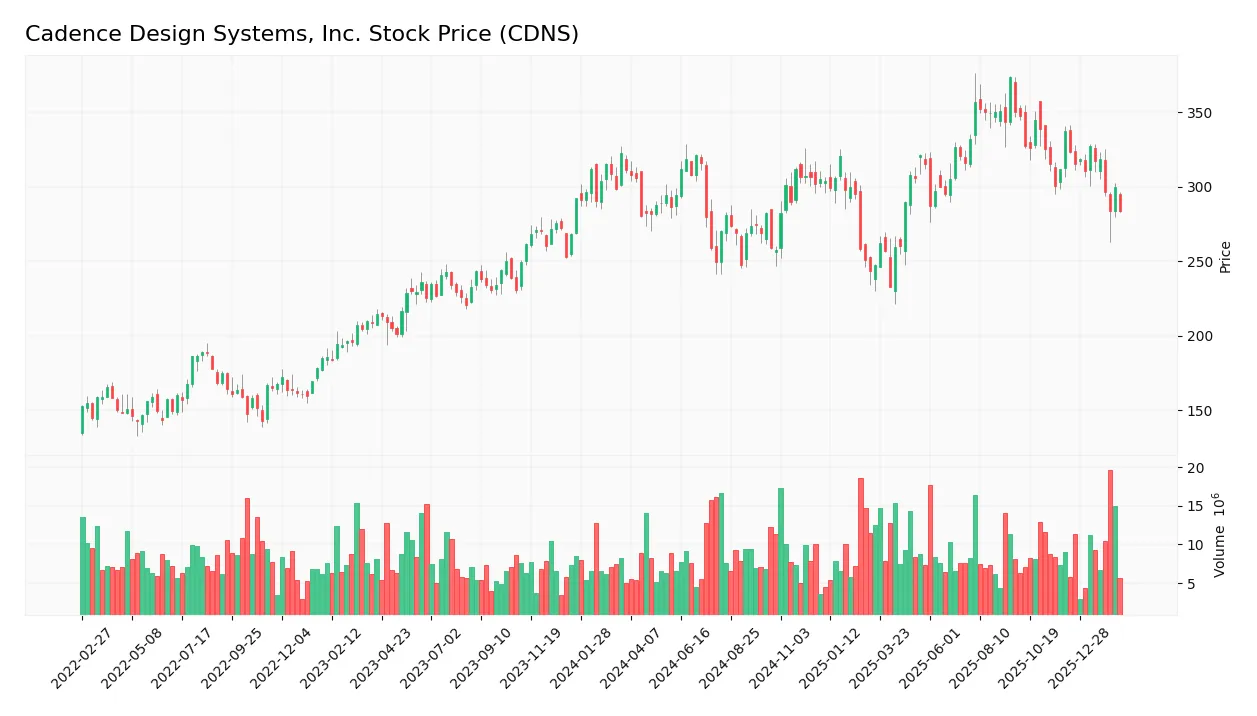
The weekly stock chart for Cadence Design Systems, Inc. (CDNS) illustrates price movements over the last 100 weeks, highlighting key highs and lows:
Trend Analysis
Over the past 12 months, CDNS’s stock price declined by 4.82%, indicating a bearish trend. The highest price reached 373.35, and the lowest hit 232.88, with deceleration in the downward movement. Volatility is high, with a standard deviation of 29.11, reflecting significant price swings.
Volume Analysis
In the last three months, seller volume dominated at 75.3M versus 44.7M buyer volume, with buyer dominance dropping to 37.24%. Trading volume is increasing, signaling heightened market participation but bearish investor sentiment. The seller-driven activity suggests cautious or negative outlook among traders.
Target Prices
Analysts set a confident target price consensus for Cadence Design Systems, Inc. (CDNS).
| Target Low | Target High | Consensus |
|---|---|---|
| 275 | 418 | 377.88 |
The target range reflects optimistic growth expectations, with a consensus suggesting upside potential above current levels.

Don’t Let Luck Decide Your Entry Point
Optimize your entry points with our advanced ProRealTime indicators. You’ll get efficient buy signals with precise price targets for maximum performance. Start outperforming now!
Analyst & Consumer Opinions
This section reviews analyst ratings and consumer feedback regarding Cadence Design Systems, Inc. (CDNS) to gauge market sentiment.
Stock Grades
Here are the latest verified stock grades from leading financial institutions for Cadence Design Systems, Inc.:
| Grading Company | Action | New Grade | Date |
|---|---|---|---|
| Rosenblatt | Upgrade | Buy | 2026-02-18 |
| Morgan Stanley | Maintain | Overweight | 2026-02-18 |
| Piper Sandler | Maintain | Neutral | 2026-02-18 |
| Wells Fargo | Maintain | Overweight | 2026-02-18 |
| Needham | Maintain | Buy | 2026-02-18 |
| Rosenblatt | Maintain | Neutral | 2026-02-17 |
| Needham | Maintain | Buy | 2025-12-22 |
| Rosenblatt | Maintain | Neutral | 2025-10-28 |
| Needham | Maintain | Buy | 2025-10-28 |
| JP Morgan | Maintain | Overweight | 2025-10-28 |
The overall trend shows a solid buy consensus with Rosenblatt recently upgrading to Buy, while major firms maintain Overweight or Buy ratings. Neutral stances remain limited and stable, signaling steady analyst confidence.
Consumer Opinions
Consumers express a mix of enthusiasm and caution toward Cadence Design Systems, reflecting its complex industry position.
| Positive Reviews | Negative Reviews |
|---|---|
| “Powerful tools streamline our design workflow effectively.” | “Steep learning curve for new users.” |
| “Reliable software with frequent updates improving performance.” | “High licensing costs limit smaller firms.” |
| “Excellent customer support and technical resources.” | “Occasional bugs disrupt critical projects.” |
Overall, users praise Cadence for its robust software and support but frequently mention cost and usability challenges. The company’s innovation drives loyalty, yet accessibility remains a concern.
Risk Analysis
Below is a summary of key risks affecting Cadence Design Systems, Inc. with their likelihood and potential impact:
| Category | Description | Probability | Impact |
|---|---|---|---|
| Valuation Risk | Elevated P/E of 76.5 and P/B of 15.5 suggest overvaluation concerns. | High | High |
| Market Volatility | Beta near 1.0 indicates stock moves closely with market swings. | Medium | Medium |
| Competitive Risk | Intense competition in semiconductor software could pressure margins. | Medium | High |
| Debt Risk | Moderate debt-to-equity at 0.45 but favorable interest coverage. | Low | Medium |
| Dividend Policy | No dividend yield may deter income-focused investors. | Medium | Low |
| Operational Risk | Dependence on key industries like 5G and automotive exposes to cyclicality. | Medium | Medium |
The most significant risk lies in valuation stretched well above sector norms, raising concern for correction. Despite a robust Altman Z-Score signaling financial health, the high P/E ratio reflects high growth expectations that may not materialize. Market volatility and industry competition remain persistent threats amid evolving technology cycles.
Should You Buy Cadence Design Systems, Inc.?
Cadence Design Systems appears to be a robustly profitable company with a slightly favorable moat, indicated by positive but declining value creation. Despite a manageable leverage profile, valuation metrics suggest caution. Overall, the firm’s financial health could be seen as stable with a B rating.
Strength & Efficiency Pillars
Cadence Design Systems, Inc. exhibits strong operational efficiency with a net margin of 20.94% and a return on equity of 20.26%. The company’s return on invested capital (ROIC) stands at 14.11%, comfortably above its weighted average cost of capital (WACC) at 8.26%, confirming it as a clear value creator. High gross margin (85.61%) and EBIT margin (31.15%) reinforce robust profitability. These metrics indicate disciplined capital allocation and effective cost management within a competitive semiconductor design sector.
Weaknesses and Drawbacks
Despite solid fundamentals, the valuation metrics signal caution. The price-to-earnings ratio at 76.48x and price-to-book ratio of 15.49x mark a significant premium over industry averages, raising concerns about overvaluation. This exposes investors to downside risk if growth expectations falter. While leverage metrics like debt-to-equity ratio (0.45) and current ratio (2.86) remain favorable, the bearish technical trend and seller dominance (37.24% buyer volume) since December 2025 suggest near-term market pressure and volatility.
Our Final Verdict about Cadence Design Systems, Inc.
The company’s long-term fundamentals appear sound, supported by strong profitability and value creation. However, the recent bearish technical trend and high valuation multiples suggest a cautious stance. Despite its operational strengths, the current market pressure and premium pricing imply that investors might consider waiting for a more attractive entry point. This profile may appeal to those willing to bear volatility for growth potential but suggests prudence for conservative capital.
Disclaimer: This content is for informational purposes only and does not constitute financial, investment, or other professional advice. Investing in financial markets involves a significant risk of loss, and past performance is not indicative of future results.
Additional Resources
- Bank of America Securities Remains Bullish on Cadence Design Systems, Inc. (CDNS) – Yahoo Finance (Feb 19, 2026)
- Cadence Design Systems rises as Wall Street praises results, guidance (CDNS:NASDAQ) – Seeking Alpha (Feb 18, 2026)
- Why Is Cadence Design Systems (CDNS) Stock Soaring Today – Finviz (Feb 18, 2026)
- Rosenblatt Upgrades Cadence Design Systems (CDNS) – Nasdaq (Feb 18, 2026)
- Cadence Design Systems shares pop on earnings beat, custom chip optimism – CNBC (Feb 18, 2026)
For more information about Cadence Design Systems, Inc., please visit the official website: cadence.com