Home > Analyses > Technology > C3.ai, Inc.
C3.ai, Inc. is transforming how enterprises harness artificial intelligence to solve complex business challenges, making AI an integral part of daily operations across diverse industries. As a pioneer in enterprise AI software, it delivers innovative platforms and tailored applications that optimize supply chains, enhance customer retention, and improve predictive maintenance. Renowned for its strategic partnerships and technological edge, C3.ai stands at the forefront of AI-driven digital transformation. The key question now is whether its current fundamentals support sustained growth and justify its market valuation.
Table of contents
Business Model & Company Overview
C3.ai, Inc., founded in 2009 and headquartered in Redwood City, California, is a leading force in the enterprise artificial intelligence software sector. Its integrated platform and suite of AI applications form a cohesive ecosystem that empowers clients across industries like oil and gas, manufacturing, and financial services to harness data-driven insights. The company’s innovative solutions span from predictive maintenance to supply chain risk management, establishing it as a dominant player in the Information Technology Services industry.
The company’s revenue engine balances recurring software licenses and professional services, delivering value through its C3 AI application platform and specialized AI applications tailored to various market segments. C3.ai maintains a strategic global presence, spanning North America, Europe, the Middle East, Africa, and Asia Pacific, supported by partnerships with industry giants like AWS and Microsoft. This competitive advantage cements C3.ai’s role in shaping the future of enterprise AI deployment worldwide.
Financial Performance & Fundamental Metrics
In this section, I analyze C3.ai, Inc.’s income statement, key financial ratios, and dividend payout policy to assess its overall financial health and profitability.
Income Statement
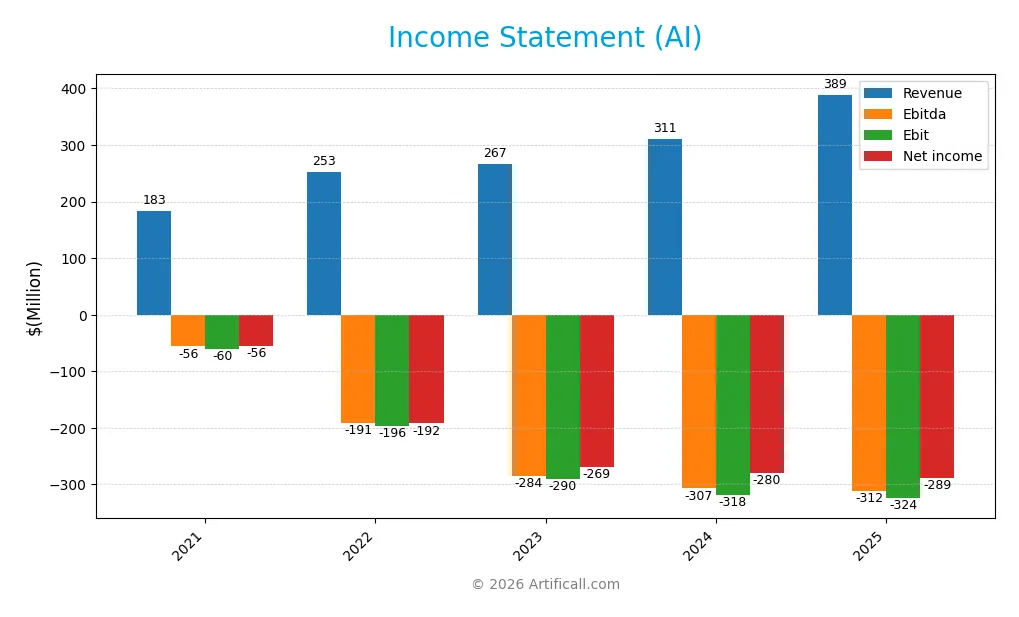
The table below summarizes C3.ai, Inc.’s key income statement figures for fiscal years 2021 through 2025, reported in USD.
| 2021 | 2022 | 2023 | 2024 | 2025 | |
|---|---|---|---|---|---|
| Revenue | 183.2M | 252.8M | 266.8M | 310.6M | 389.1M |
| Cost of Revenue | 44.5M | 63.7M | 86.3M | 132.0M | 153.2M |
| Operating Expenses | 199.0M | 385.2M | 471.0M | 496.9M | 560.3M |
| Gross Profit | 138.7M | 189.0M | 180.5M | 178.6M | 235.9M |
| EBITDA | -56.0M | -190.9M | -284.4M | -306.9M | -311.8M |
| EBIT | -60.3M | -196.1M | -290.5M | -318.3M | -324.4M |
| Interest Expense | 0 | 0 | 0 | 0 | 0 |
| Net Income | -55.7M | -192.1M | -268.8M | -279.7M | -288.7M |
| EPS | -0.90 | -1.84 | -2.45 | -2.34 | -2.24 |
| Filing Date | 2021-06-25 | 2022-06-23 | 2023-06-22 | 2024-06-18 | 2025-06-23 |
Income Statement Evolution
From 2021 to 2025, C3.ai, Inc. showed a strong revenue growth of 112.35%, reaching $389M in 2025. Gross profit also increased favorably by 32.09% in the last year, with a consistent gross margin of 60.62%. However, net income deteriorated by 418.35% over the period, reflecting ongoing losses. Net margin remained unfavorable at -74.21%, highlighting persistent profitability challenges despite revenue gains.
Is the Income Statement Favorable?
In 2025, C3.ai reported $389M revenue with a 25.27% year-over-year increase, demonstrating solid top-line growth. Operating expenses grew proportionally, causing EBIT to decline slightly by 1.91%, resulting in a negative EBIT margin of -83.39%. Interest expenses were zero, a positive factor. Despite a net loss of $289M, net margin improved by 17.6% and EPS grew by 4.27%. Overall, income statement fundamentals are generally favorable, driven by strong revenue growth and margin stability amid ongoing net losses.
Financial Ratios
The table below presents key financial ratios for C3.ai, Inc. over the last five fiscal years, offering a snapshot of profitability, efficiency, leverage, and market valuation:
| Ratios | 2021 | 2022 | 2023 | 2024 | 2025 |
|---|---|---|---|---|---|
| Net Margin | -30% | -76% | -101% | -90% | -74% |
| ROE | -5% | -19% | -29% | -32% | -34% |
| ROIC | -6% | -19% | -30% | -34% | -36% |
| P/E | -67 | -9 | -8 | -10 | -10 |
| P/B | 3.5 | 1.8 | 2.2 | 3.1 | 3.4 |
| Current Ratio | 9.4 | 7.1 | 6.5 | 8.8 | 6.9 |
| Quick Ratio | 9.4 | 7.2 | 6.5 | 8.8 | 6.9 |
| D/E | 0.004 | 0.003 | 0.003 | 0.004 | 0.006 |
| Debt-to-Assets | 0.003 | 0.003 | 0.002 | 0.003 | 0.005 |
| Interest Coverage | 0 | 0 | 0 | 0 | 0 |
| Asset Turnover | 0.15 | 0.22 | 0.24 | 0.30 | 0.38 |
| Fixed Asset Turnover | 29.9 | 17.4 | 3.2 | 3.5 | 4.9 |
| Dividend Yield | 0 | 0 | 0 | 0 | 0 |
Evolution of Financial Ratios
From 2021 to 2025, C3.ai, Inc.’s Return on Equity (ROE) consistently declined, reaching -34.44% in 2025, indicating deteriorating profitability. The Current Ratio fluctuated but remained elevated, around 6.86 in 2025, showing strong liquidity. The Debt-to-Equity Ratio stayed very low near 0.01, reflecting minimal leverage. Profitability margins have remained negative and worsened over this period.
Are the Financial Ratios Favorable?
In 2025, profitability metrics such as net margin (-74.21%) and ROE (-34.44%) are unfavorable, highlighting sustained losses. Liquidity appears mixed: the quick ratio (6.86) is favorable, while the current ratio is not. Efficiency is weak with asset turnover at 0.38 unfavorable, but fixed asset turnover is strong at 4.91. Leverage ratios, including debt-to-equity (0.01) and debt-to-assets (0.47%), are favorable due to low debt. Market valuation ratios show a mixed picture, with a favorable PE ratio (-9.84) but unfavorable price-to-book (3.39). Overall, 64% of ratios are unfavorable, leading to an overall unfavorable financial ratio evaluation.
Shareholder Return Policy
C3.ai, Inc. does not pay dividends, reflecting sustained negative net income and a focus on reinvestment and growth. The company maintains no dividend payout ratio or yield, and no share buyback programs are reported.
This approach prioritizes long-term value creation through growth rather than immediate shareholder returns. While risk exists due to consistent losses, the policy aligns with reinvesting capital to potentially enhance future shareholder value over time.
Score analysis
The radar chart below presents a comprehensive overview of the company’s key financial scores:
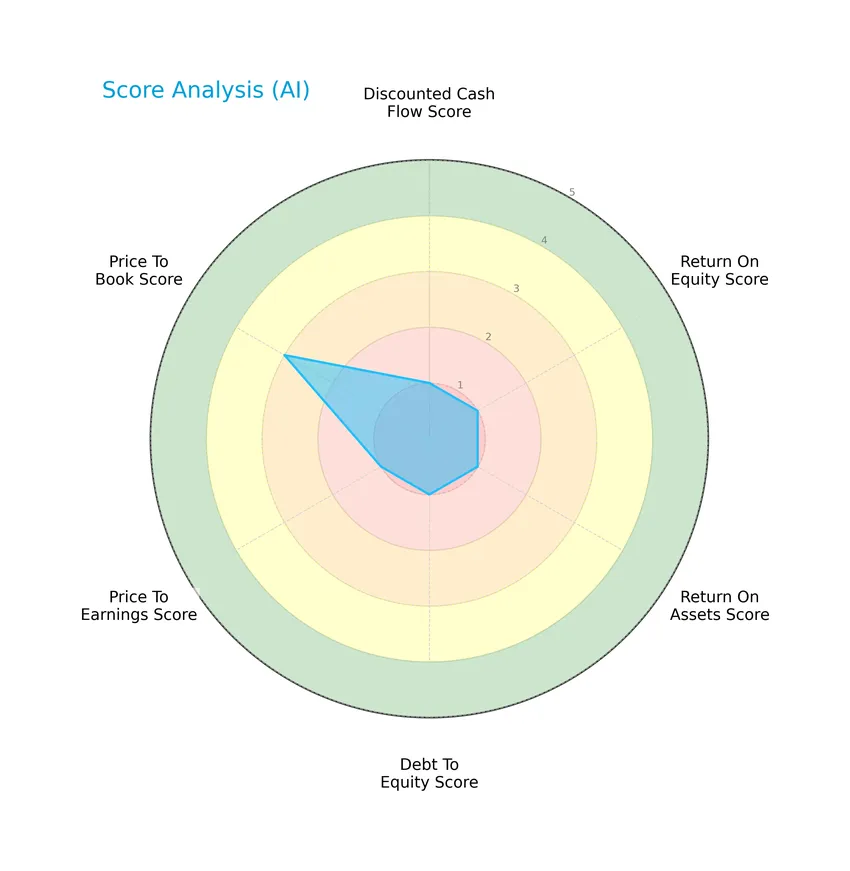
The company scores very low across most financial metrics, including discounted cash flow, return on equity, return on assets, debt to equity, and price to earnings, all rated as very unfavorable. Only the price to book score is moderate, indicating some relative valuation strength.
Analysis of the company’s bankruptcy risk
The Altman Z-Score places the company in the safe zone, indicating a low risk of bankruptcy and financial distress at this time:

Is the company in good financial health?
The Piotroski F-Score diagram below illustrates the company’s financial strength based on nine criteria:

With a Piotroski Score of 2, the company is classified as very weak, suggesting poor financial health and limited operational efficiency despite its low bankruptcy risk.
Competitive Landscape & Sector Positioning
This sector analysis will examine C3.ai, Inc.’s strategic positioning, revenue segments, key products, and main competitors within the technology industry. I will assess whether C3.ai holds a competitive advantage over its peers based on its offerings and market presence.
Strategic Positioning
C3.ai, Inc. maintains a concentrated product portfolio focused on enterprise AI software, primarily generating revenue from License and Service (278M in 2024) and Professional Services (32M in 2024). Geographically, it has diversified exposure across North America (270M), EMEA (36M), Asia Pacific (3.6M), and other regions.
Revenue by Segment
This pie chart illustrates the revenue distribution of C3.ai, Inc. across its main business segments for the fiscal year 2024.
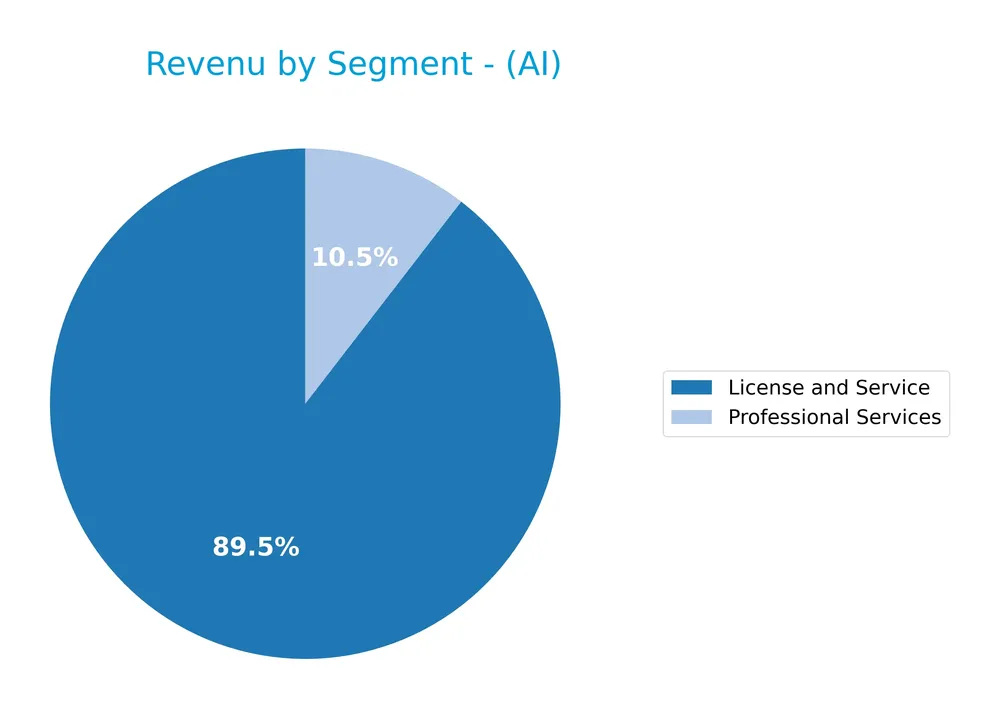
C3.ai’s revenue is primarily driven by the “License and Service” segment, which grew from $157M in 2021 to $278M in 2024, showing robust expansion. The “Professional Services” segment is smaller and has fluctuated, declining to $32M in 2024 after peaking above $45M in 2022. The recent year highlights a strong acceleration in core licensing and services, indicating concentration in this primary segment.
Key Products & Brands
The table below outlines C3.ai, Inc.’s key products and brands with their descriptions:
| Product | Description |
|---|---|
| C3 AI Application Platform | An application development and runtime environment enabling design, development, and deployment of enterprise AI applications. |
| C3 AI Ex Machina | A tool for analysis-ready data preparation. |
| C3 AI CRM | Industry-specific customer relationship management solution. |
| C3 AI Data Vision | Visualizes and leverages relationships between data entities. |
| C3 AI Inventory Optimization | Optimizes raw material, in-process, and finished goods inventory levels. |
| C3 AI Supply Network Risk | Provides visibility into risks of disruption across supply chain operations. |
| C3 AI Customer Churn Management | Enables monitoring of customer satisfaction and prevention of churn with AI-based predictions. |
| C3 AI Production Schedule Optimization | Solution for scheduling production efficiently. |
| C3 AI Predictive Maintenance | Offers insight into asset risk for maintenance planning and equipment operation. |
| C3 AI Fraud Detection | Identifies revenue leakage and maintenance or safety issues. |
| C3 AI Energy Management | Provides energy management solutions. |
C3.ai generates most of its revenue from License and Service offerings, supported by Professional Services. Its portfolio covers a broad spectrum of AI applications tailored to various industries such as oil and gas, manufacturing, financial services, and more.
Main Competitors
There are 16 competitors in total, with the following table listing the top 10 leaders by market capitalization:
| Competitor | Market Cap. |
|---|---|
| International Business Machines Corporation | 272B |
| Accenture plc | 162B |
| Cognizant Technology Solutions Corporation | 40B |
| Fiserv, Inc. | 36B |
| Fidelity National Information Services, Inc. | 34B |
| Wipro Limited | 30B |
| Leidos Holdings, Inc. | 23B |
| Gartner, Inc. | 18B |
| CDW Corporation | 17B |
| Jack Henry & Associates, Inc. | 13B |
C3.ai, Inc. ranks 16th among 16 competitors, with a market capitalization just 0.64% of the leader, IBM. The company’s market cap is below both the average of the top 10 competitors (approximately 64.6B) and the sector median (about 17.8B). There is a 14.97% gap to the next competitor above, highlighting a measurable distance in scale within the competitive landscape.
Comparisons with competitors
Check out how we compare the company to its competitors:
Does C3.ai have a competitive advantage?
C3.ai does not present a competitive advantage as its return on invested capital (ROIC) is significantly below its weighted average cost of capital (WACC), indicating value destruction and declining profitability. The company’s negative EBIT and net margins further reflect challenges in translating revenue growth into sustainable profits.
Looking ahead, C3.ai aims to expand its portfolio with industry-specific AI applications and leverage strategic partnerships across oil and gas, financial services, and technology sectors. Growth opportunities exist in international markets, particularly North America and EMEA, supported by ongoing innovation in enterprise AI solutions.
SWOT Analysis
This SWOT analysis highlights C3.ai, Inc.’s key strengths, weaknesses, opportunities, and threats to help investors understand its strategic position.
Strengths
- Strong revenue growth with 25% increase in 2025
- Leading enterprise AI software platform
- Strategic partnerships with AWS, Intel, Google, Microsoft
Weaknesses
- Negative net and EBIT margins indicate ongoing losses
- Declining ROIC and value destruction
- Weak Piotroski score signals financial fragility
Opportunities
- Expanding AI adoption across industries globally
- Growth potential in EMEA and Asia Pacific markets
- Increasing demand for AI-driven supply chain and predictive maintenance
Threats
- Intense competition in AI and cloud software
- High beta (1.96) implies stock volatility
- Economic downturns impacting IT spending
Overall, C3.ai shows strong top-line growth and market positioning but faces significant profitability and financial health challenges. Investors should weigh growth potential against risks from persistent losses and competitive pressure when considering this stock.
Stock Price Action Analysis
The following chart illustrates the weekly price movements of C3.ai, Inc. (ticker: AI) over the past 12 months:
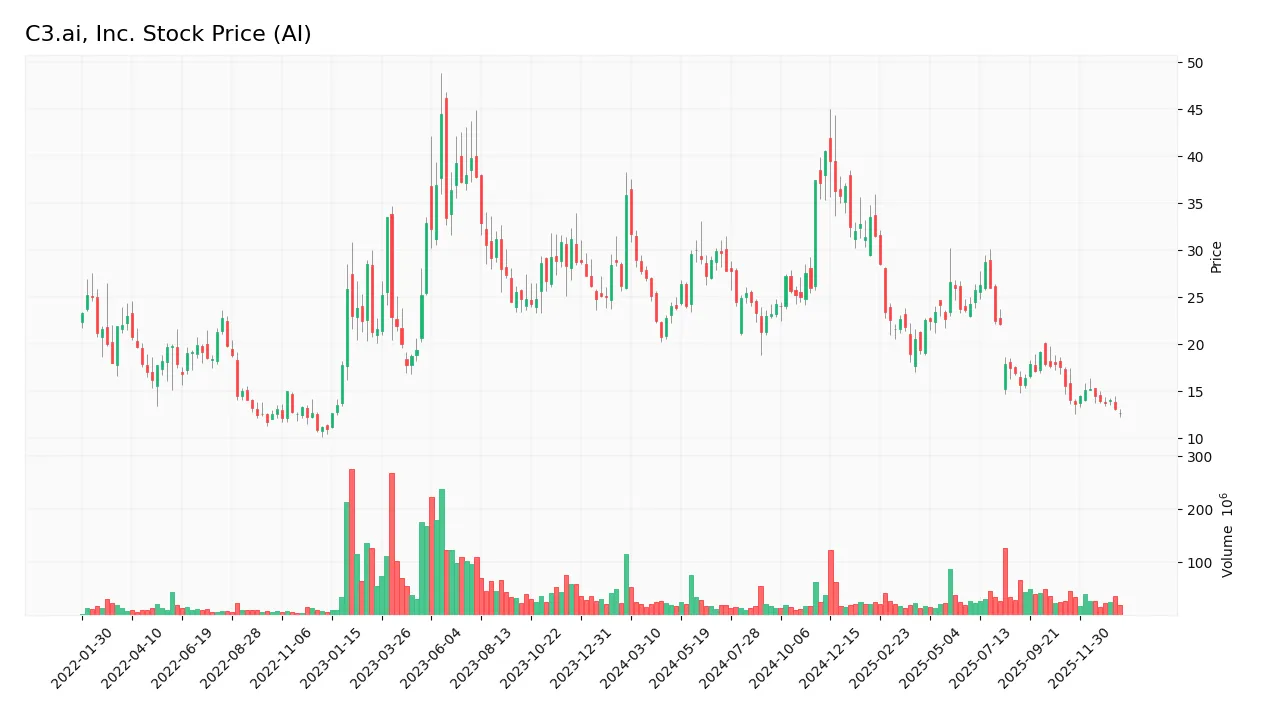
Trend Analysis
Over the past 12 months, the stock price of C3.ai, Inc. decreased by 64.62%, indicating a bearish trend. The price has shown deceleration in its downward movement, with a high of 40.52 and a low of 12.69. Volatility remains moderate with a standard deviation of 6.41.
Volume Analysis
Trading volume over the last three months has been decreasing, with sellers dominating 67.63% of activity. This seller-driven volume suggests waning investor interest and increased selling pressure, reflecting cautious or bearish sentiment in the market.
Target Prices
The consensus target prices for C3.ai, Inc. (AI) reflect moderate upside potential based on current analyst estimates.
| Target High | Target Low | Consensus |
|---|---|---|
| 16 | 11 | 13.5 |
Analysts expect the stock price to range between $11 and $16, with a consensus target around $13.5, indicating cautious optimism for future performance.

Don’t Let Luck Decide Your Entry Point
Optimize your entry points with our advanced ProRealTime indicators. You’ll get efficient buy signals with precise price targets for maximum performance. Start outperforming now!
Analyst & Consumer Opinions
This section reviews recent analyst ratings and consumer feedback regarding C3.ai, Inc. to gauge market sentiment.
Stock Grades
Here is the latest summary of stock grades for C3.ai, Inc. from several reputable financial firms:
| Grading Company | Action | New Grade | Date |
|---|---|---|---|
| DA Davidson | Maintain | Underperform | 2025-12-04 |
| Canaccord Genuity | Maintain | Hold | 2025-12-04 |
| Needham | Maintain | Hold | 2025-12-04 |
| Wedbush | Maintain | Outperform | 2025-12-04 |
| UBS | Maintain | Neutral | 2025-09-12 |
| Morgan Stanley | Maintain | Underweight | 2025-09-09 |
| Canaccord Genuity | Maintain | Hold | 2025-09-05 |
| Keybanc | Maintain | Underweight | 2025-09-04 |
| UBS | Maintain | Neutral | 2025-09-04 |
| Needham | Maintain | Hold | 2025-09-04 |
The overall grading trend for C3.ai indicates a predominance of Hold and Neutral ratings, with a few Underperform and Underweight assessments, balanced by a single Outperform grade, reflecting mixed analyst sentiment.
Consumer Opinions
Consumer sentiment around C3.ai, Inc. reflects a mix of enthusiasm for its innovative technology and concerns about execution.
| Positive Reviews | Negative Reviews |
|---|---|
| “Impressed by C3.ai’s cutting-edge AI solutions, which have improved our operational efficiency significantly.” | “Customer support response times can be slow, causing delays in critical implementations.” |
| “The platform’s scalability and integration capabilities are top-notch, enabling seamless data management.” | “Pricing is on the higher side, which may deter smaller enterprises from adopting their services.” |
| “Regular updates and feature enhancements show the company’s commitment to innovation.” | “Some users report a steep learning curve when first using the system, requiring extensive training.” |
Overall, consumers appreciate C3.ai’s advanced technology and commitment to innovation, while common criticisms focus on customer support delays, pricing, and usability challenges for newcomers.
Risk Analysis
Below is a summary table highlighting the primary risk categories for C3.ai, Inc., focusing on probability and potential impact:
| Category | Description | Probability | Impact |
|---|---|---|---|
| Financial Performance | Negative net margin (-74.21%) and unfavorable returns on equity and invested capital | High | High |
| Market Volatility | High beta of 1.964 indicating above-average stock price fluctuations | High | Medium |
| Liquidity & Solvency | Mixed liquidity ratios; very favorable low debt but unfavorable interest coverage | Medium | Medium |
| Operational Risk | Dependency on strategic partnerships and AI adoption pace in various industries | Medium | High |
| Valuation & Sentiment | Unfavorable price-to-book ratio and very weak Piotroski score (2), despite Altman Z-score safe | High | Medium |
C3.ai’s most pressing risks arise from its weak profitability and financial health, reflected in poor net margin and returns, despite a safe Altman Z-score. Its high beta amplifies market risk, while operational dependency on partnerships and AI industry adoption add uncertainty. Investors should carefully weigh these factors before investing.
Should You Buy C3.ai, Inc.?
C3.ai, Inc. appears to be characterized by deteriorating profitability and a very unfavorable competitive moat, suggesting value destruction and declining operational efficiency. Despite a manageable leverage profile and a safe Altman Z-score, the overall C- rating and weak financial strength indicate significant investment caution.
Strength & Efficiency Pillars
C3.ai, Inc. presents a mixed financial profile with strong liquidity and low leverage, as reflected by a current ratio of 6.86 and a debt-to-equity ratio of 0.01. The Altman Z-Score of 3.23 places the company in the safe zone, indicating low bankruptcy risk. However, profitability metrics are weak, with a negative net margin of -74.21%, ROE at -34.44%, and ROIC at -36.1%, all signaling operational inefficiencies. The company is not a value creator, given its ROIC is significantly below the WACC of 13.08%.
Weaknesses and Drawbacks
The valuation and profitability indicators raise concerns. Despite a favorable P/E ratio of -9.84 due to negative earnings, the P/B ratio stands at 3.39, indicating a premium valuation relative to book value. The firm’s financial health is challenged by persistent negative margins and a seller-dominant market sentiment with only 32.37% buyer dominance recently. Operating inefficiencies and a declining stock price (-64.62% over the overall period) underscore significant near-term market pressure and risk.
Our Verdict about C3.ai, Inc.
The long-term fundamental profile of C3.ai appears unfavorable due to persistent profitability challenges and value destruction. Coupled with a bearish overall stock trend and recent seller dominance, this suggests caution. Despite some strong liquidity and balance sheet metrics, the current market dynamics and underlying financial weaknesses might appear to warrant a wait-and-see approach before considering exposure.
Disclaimer: This content is for informational purposes only and does not constitute financial, investment, or other professional advice. Investing in financial markets involves a significant risk of loss, and past performance is not indicative of future results.
Additional Resources
- C3 AI Supply Network Risk – bak – C3 AI (Jan 16, 2026)
- Why C3.ai, Inc. (AI) Dipped More Than Broader Market Today – Yahoo Finance (Jan 20, 2026)
- Why C3.ai, Inc. (AI) Outpaced the Stock Market Today – Nasdaq (Jan 22, 2026)
- C3AI (AI) Considers Sale: Potential Buyout Boost for Investors – GuruFocus (Jan 23, 2026)
- 10 Information Technology Stocks With Whale Alerts In Today’s Session – Benzinga (Jan 23, 2026)
For more information about C3.ai, Inc., please visit the official website: C3.ai