Home > Analyses > Real Estate > BXP, Inc.
BXP, Inc. shapes urban skylines with its commanding portfolio of Class A office properties. As the largest publicly held developer and owner in its sector, BXP dominates key U.S. markets like Boston, New York, and San Francisco. Its integrated approach spans development, management, and acquisition, setting high standards for quality and innovation. Yet, with evolving work trends, I ask: does BXP’s valuation still reflect its growth potential and operational strength?

Table of contents
Business Model & Company Overview
BXP, Inc., founded in 1997 and headquartered in Boston, MA, stands as the largest publicly-held developer and owner of Class A office properties in the U.S. Its core business integrates development, management, and ownership of a diverse portfolio totaling 51.2M sq ft across 196 properties. Concentrated in five major markets—Boston, Los Angeles, New York, San Francisco, and Washington, DC—BXP operates a cohesive ecosystem of premium office real estate assets.
The company’s revenue engine balances property leasing with active redevelopment and construction projects, ensuring steady income alongside growth opportunities. Its integrated REIT model capitalizes on strong demand in key U.S. urban centers, maintaining a strategic presence across critical economic hubs. BXP’s competitive advantage lies in its scale and market concentration, creating a durable economic moat that shapes the future landscape of American office real estate.
Financial Performance & Fundamental Metrics
I analyze BXP, Inc.’s income statement, key financial ratios, and dividend payout policy to evaluate its core financial health and shareholder returns.
Income Statement
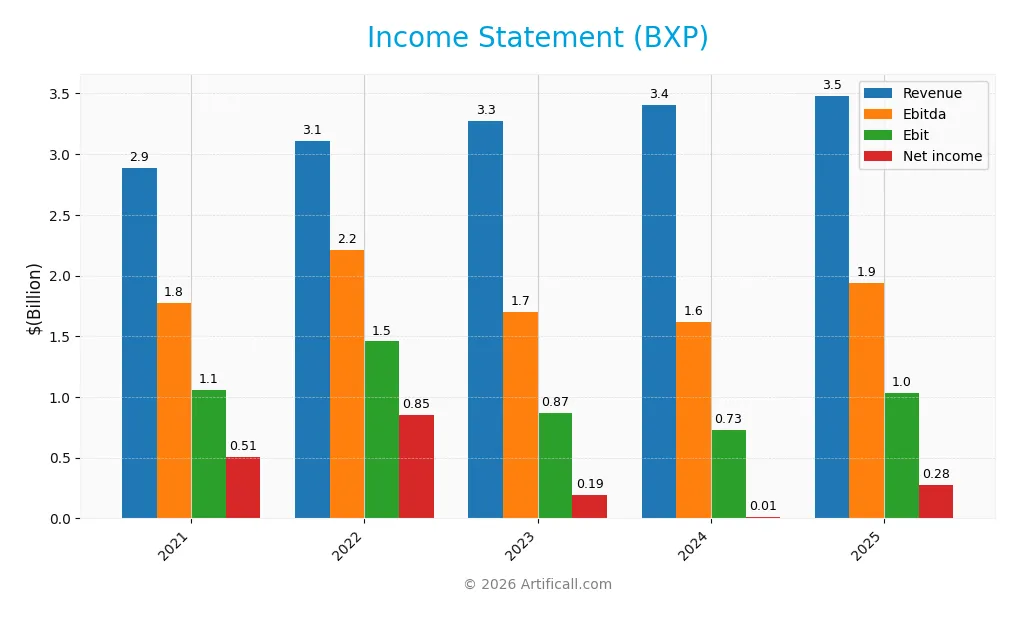
The table below summarizes BXP, Inc.’s key income statement figures for the fiscal years 2021 through 2025, reflecting revenue growth, expense structure, and profitability trends.
| 2021 | 2022 | 2023 | 2024 | 2025 | |
|---|---|---|---|---|---|
| Revenue | 2.89B | 3.11B | 3.27B | 3.41B | 3.48B |
| Cost of Revenue | 1.03B | 1.14B | 1.22B | 1.32B | 1.37B |
| Operating Expenses | 881M | 912M | 1.02B | 1.06B | 169M |
| Gross Profit | 1.85B | 1.97B | 2.06B | 2.09B | 2.11B |
| EBITDA | 1.78B | 2.21B | 1.70B | 1.62B | 1.94B |
| EBIT | 1.06B | 1.46B | 871M | 729M | 1.03B |
| Interest Expense | 423M | 437M | 573M | 645M | 648M |
| Net Income | 505M | 849M | 190M | 14M | 277M |
| EPS | 3.18 | 5.42 | 1.21 | 0.09 | 1.75 |
| Filing Date | 2022-02-25 | 2023-02-27 | 2024-02-27 | 2025-02-27 | 2026-02-27 |
Income Statement Evolution
BXP’s revenue grew 20.55% from 2021 to 2025, but slowed to 2.19% in 2025. Gross profit remained stable with a slight 1.12% rise in 2025, maintaining a favorable gross margin of 60.56%. EBIT surged 41.46% in 2025, driving net income growth of 1797.94% that year, despite a 45.21% decline over the full period. Net margins improved notably in 2025.
Is the Income Statement Favorable?
In 2025, BXP reported $3.48B revenue and $277M net income, yielding a 7.95% net margin—favorable by industry standards. EBIT margin reached 29.63%, reflecting operational efficiency. However, interest expense remained high at 18.6% of revenue, a clear risk factor. Overall, fundamentals appear favorable, supported by strong margin expansion and earnings growth despite elevated financing costs.
Financial Ratios
The following table presents key financial ratios for BXP, Inc. over the last five fiscal years to facilitate year-over-year comparison:
| Ratios | 2021 | 2022 | 2023 | 2024 | 2025 |
|---|---|---|---|---|---|
| Net Margin | 17% | 27% | 6% | 0.4% | 8% |
| ROE | 8.6% | 14% | 3.2% | 0.3% | 5.4% |
| ROIC | 4.5% | 4.5% | 4.1% | 4.0% | 7.6% |
| P/E | 36 | 12 | 58 | 820 | 39 |
| P/B | 3.1 | 1.7 | 1.9 | 2.2 | 2.1 |
| Current Ratio | 2.6 | 3.2 | 4.2 | 2.6 | 2.3 |
| Quick Ratio | 2.6 | 3.2 | 4.2 | 2.6 | 2.3 |
| D/E | 2.3 | 2.4 | 2.8 | 3.2 | 3.4 |
| Debt-to-Assets | 60% | 61% | 64% | 66% | 66% |
| Interest Coverage | 2.3 | 2.4 | 1.8 | 1.6 | 3.0 |
| Asset Turnover | 0.13 | 0.13 | 0.13 | 0.13 | 0.13 |
| Fixed Asset Turnover | 0 | 7.7 | 0 | 4.8 | 0.17 |
| Dividend Yield | 3.8% | 6.5% | 6.2% | 5.9% | 5.4% |
All figures are rounded for clarity.
Evolution of Financial Ratios
From 2021 to 2025, BXP’s Return on Equity (ROE) declined sharply from 8.65% to 5.38%, signaling weakening profitability. The Current Ratio decreased from 4.19 to 2.28, suggesting reduced liquidity but remaining above 2. The Debt-to-Equity Ratio rose from 2.28 to 3.37, indicating increased leverage and financial risk over the period.
Are the Financial Ratios Favorable?
In 2025, profitability metrics such as ROE (5.38%) and net margin (7.95%) appear neutral to unfavorable versus market standards. Liquidity ratios like the Current and Quick Ratios (both 2.28) are favorable, reflecting solid short-term financial health. However, high leverage is a concern, with Debt-to-Equity at 3.37 and interest coverage below 2. Asset turnover ratios are weak, and valuation multiples like P/E at 38.78 are elevated. Overall, the ratios paint a slightly unfavorable financial profile.
Shareholder Return Policy
BXP, Inc. maintains a consistent dividend payout, with yields around 5.4%-6.5% over recent years and payout ratios fluctuating significantly, reaching above 200% in 2025. The dividend per share remains near $3.64-$4.38, supported by free cash flow coverage but signals possible distribution strain in 2025.
The company also engages in share buybacks, complementing dividend returns. Despite solid dividend yields, the elevated payout ratio in 2025 and high leverage metrics suggest caution. This policy balances shareholder income with financial risks, impacting sustainable long-term value creation.
Score analysis
The radar chart below summarizes key financial scores for a comprehensive company overview:
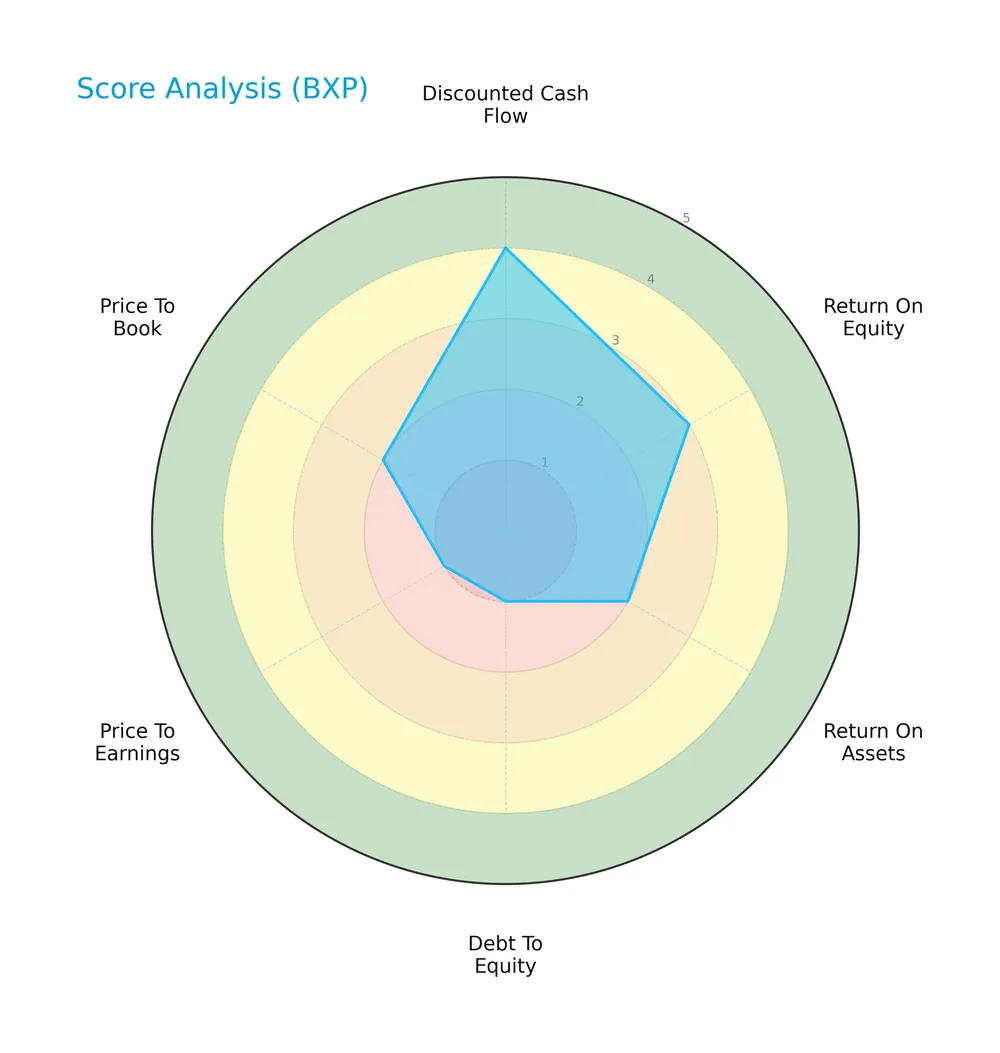
BXP, Inc. shows a favorable discounted cash flow score of 4 and a moderate return on equity score of 3. However, return on assets, debt to equity, price to earnings, and price to book scores are all very unfavorable or unfavorable, signaling financial challenges.
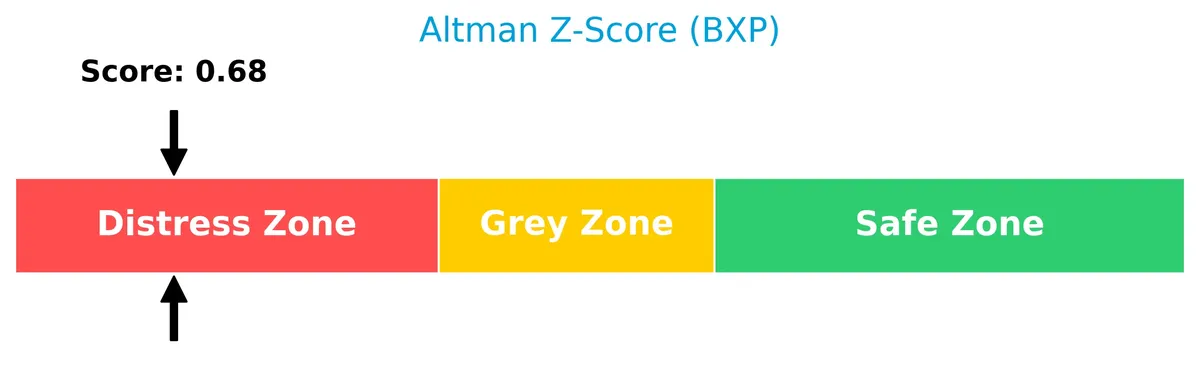
Analysis of the company’s bankruptcy risk
BXP, Inc. falls in the distress zone with an Altman Z-Score of 0.65, indicating a high risk of bankruptcy and financial distress:
Is the company in good financial health?
The Piotroski Score diagram illustrates the company’s moderate financial health status:

With a Piotroski Score of 5, BXP, Inc. is in an average financial condition. This score reflects mixed signals about profitability, leverage, and efficiency, suggesting neither strong nor weak financial health.
Competitive Landscape & Sector Positioning
This analysis explores BXP, Inc.’s strategic positioning, revenue segments, key products, and main competitors. I will assess whether BXP holds competitive advantages over its industry peers.
Strategic Positioning
BXP, Inc. focuses on Class A office properties across six major U.S. markets, with over 51M sq ft and 196 properties. Its revenue streams diversify modestly into management services, hotels, parking, and other real estate, while geographic exposure remains concentrated in Boston, New York, and San Francisco.
Revenue by Segment
The pie chart illustrates BXP, Inc.’s revenue distribution by segment for the fiscal year 2025, highlighting the contribution of each business line.
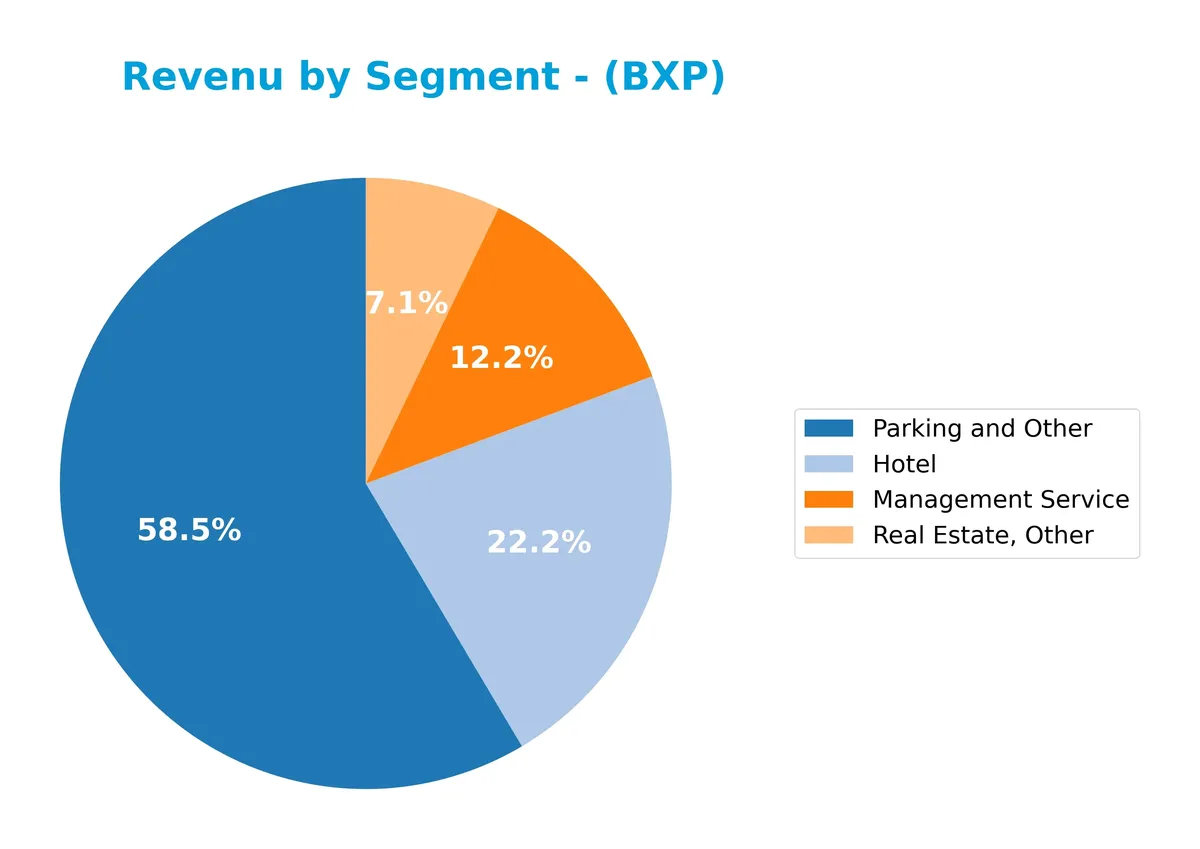
In 2025, “Parking and Other” leads with $143M, showing consistent growth since 2019 and solidifying its role as the core driver. “Hotel” revenue, at $50M, rebounded slightly after fluctuations, while “Management Service” increased to $37M, indicating steady operational expansion. “Real Estate, Other” remains a minor contributor at $16M. The latest year reveals a concentration risk in parking-related income but also signals resilience in diversified streams.
Key Products & Brands
The table below outlines BXP, Inc.’s main revenue-generating products and services:
| Product | Description |
|---|---|
| Management Service | Revenue from property management services, including leasing and operational oversight. |
| Hotel | Income generated from hotel operations within the company’s property portfolio. |
| Parking and Other | Earnings from parking facilities and ancillary services connected to office properties. |
| Real Estate, Other | Additional real estate-related revenues beyond core office leasing and management activities. |
BXP’s portfolio focuses on Class A office properties, with diversified income streams from management, hotel operations, parking, and other real estate services. This mix supports stable cash flow within its core markets.
Main Competitors
In the Real Estate sector, specifically REIT – Office, there are 3 main competitors, with the table below listing the top 3 leaders by market capitalization:
| Competitor | Market Cap. |
|---|---|
| Digital Realty Trust, Inc. | 53.3B |
| BXP, Inc. | 10.7B |
| Alexandria Real Estate Equities, Inc. | 8.5B |
BXP, Inc. ranks 2nd among its competitors with a market cap at 17.13% of the leader, Digital Realty Trust. The company is below both the average market cap of the top 10 (24.2B) and the median sector cap (10.7B). It holds a significant 483.61% gap above its closest competitor.
Comparisons with competitors
Check out how we compare the company to its competitors:
Does BXP have a competitive advantage?
BXP, Inc. demonstrates a clear competitive advantage as the largest publicly-held developer and owner of Class A office properties in key U.S. markets. Its very favorable moat status reflects a 3.2% ROIC above WACC and a strong 71% ROIC growth trend, signaling efficient capital use and value creation.
The company’s future outlook includes ongoing development with six properties under construction or redevelopment. Concentration in major markets like Boston, New York, and San Francisco presents opportunities for revenue growth and portfolio expansion in a recovering office real estate sector.
SWOT Analysis
This SWOT analysis highlights BXP, Inc.’s strategic position by examining internal capabilities and external market factors.
Strengths
- largest publicly-held Class A office REIT
- strong presence in top U.S. markets
- favorable gross and EBIT margins
Weaknesses
- high debt-to-equity ratio (3.37)
- low interest coverage (1.59)
- weak ROE (5.38%) signals capital inefficiency
Opportunities
- expanding redevelopment projects
- increasing ROIC trend indicates value creation
- stable dividend yield (~5.4%) attracts income investors
Threats
- high office sector leverage risks
- declining net income over 5 years
- pressure from changing work patterns post-pandemic
BXP demonstrates a durable competitive advantage with strong profitability and market reach. However, elevated leverage and sector headwinds require cautious capital management. Strategic focus on redevelopment and maintaining financial discipline will be critical to sustaining growth and shareholder value.
Stock Price Action Analysis
The weekly stock chart for BXP, Inc. illustrates price movements and volatility trends over the past 12 months:
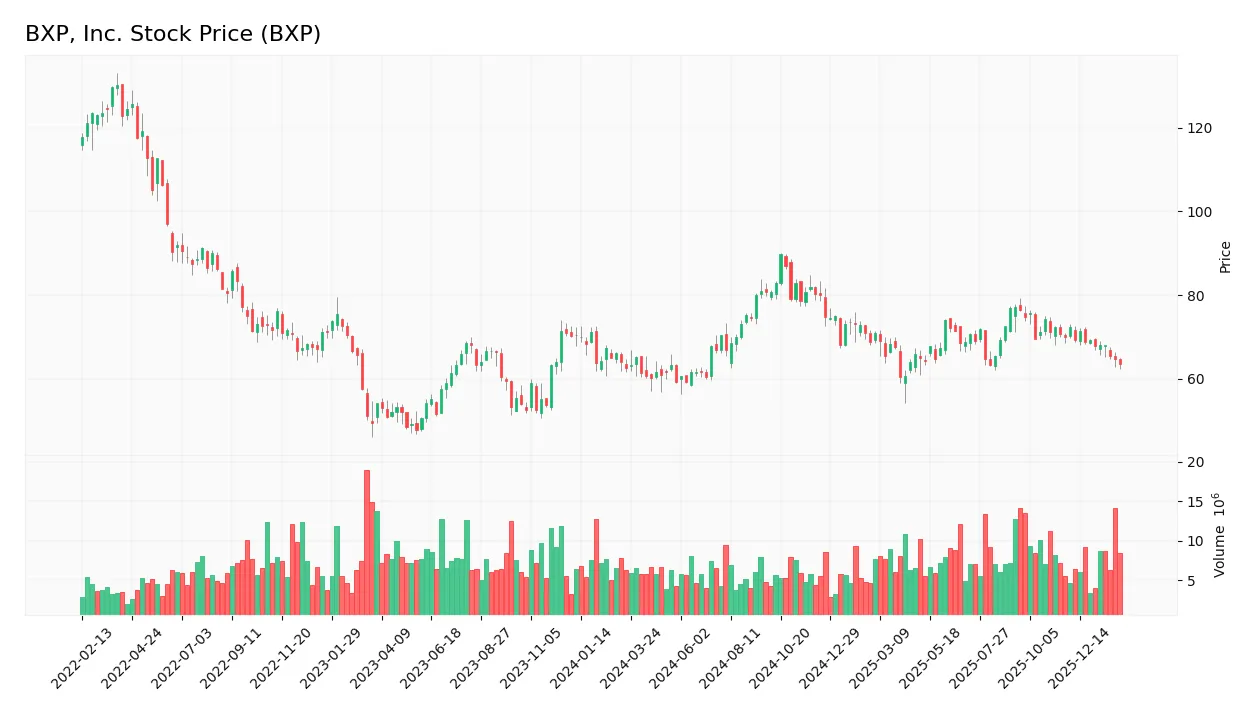
Trend Analysis
Over the past 12 months, BXP’s stock price declined by 6.15%, indicating a bearish trend. The trend shows deceleration despite a relatively high standard deviation of 6.76. The price ranged between 89.72 at its peak and 57.58 at its lowest, reflecting notable volatility in this period.
Volume Analysis
Trading volume increased overall, with sellers dominating at 55.17% of the total 880M shares traded. In the recent three months, seller dominance strengthened further, with buyers representing only 24.14% of volume, signaling bearish investor sentiment and heightened market participation on the sell side.
Target Prices
Analysts set a clear consensus target price for BXP, Inc., reflecting solid expectations for the stock’s near-term performance.
| Target Low | Target High | Consensus |
|---|---|---|
| 62 | 85 | 75.86 |
The consensus target of $75.86 suggests analysts anticipate moderate upside potential, with a range from $62 to $85 signaling balanced optimism.

Don’t Let Luck Decide Your Entry Point
Optimize your entry points with our advanced ProRealTime indicators. You’ll get efficient buy signals with precise price targets for maximum performance. Start outperforming now!
Analyst & Consumer Opinions
This section examines analyst ratings and consumer feedback to provide a comprehensive view of BXP, Inc.’s market perception.
Stock Grades
Below is a summary of recent analyst grades from leading financial institutions for BXP, Inc.:
| Grading Company | Action | New Grade | Date |
|---|---|---|---|
| Mizuho | Downgrade | Neutral | 2026-02-24 |
| Citigroup | Maintain | Neutral | 2026-02-03 |
| Truist Securities | Maintain | Hold | 2026-02-02 |
| Evercore ISI Group | Maintain | In Line | 2026-01-29 |
| Cantor Fitzgerald | Maintain | Overweight | 2026-01-29 |
| Barclays | Maintain | Overweight | 2026-01-23 |
| Scotiabank | Maintain | Sector Perform | 2026-01-14 |
| JP Morgan | Maintain | Overweight | 2026-01-13 |
| Barclays | Upgrade | Overweight | 2026-01-13 |
| UBS | Maintain | Neutral | 2026-01-08 |
The analyst consensus leans towards a Buy rating with 23 Buy and 18 Hold recommendations. Recent actions show mostly stable or positive views, though Mizuho’s downgrade to Neutral suggests some caution.
Consumer Opinions
Consumer sentiment around BXP, Inc. reveals a mixed but generally favorable impression of its services and management.
| Positive Reviews | Negative Reviews |
|---|---|
| Responsive customer service enhances client trust. | Some tenants report occasional maintenance delays. |
| Properties maintain strong cleanliness and safety. | Limited on-site amenities in some locations. |
| Competitive leasing rates attract diverse tenants. | Parking availability issues frustrate residents. |
Overall, consumers appreciate BXP’s reliable management and well-maintained properties. However, maintenance responsiveness and amenity offerings remain areas for improvement. These recurring themes suggest operational focus could boost tenant satisfaction further.
Risk Analysis
Below is a table summarizing the key risks facing BXP, Inc. with their likelihood and potential impact:
| Category | Description | Probability | Impact |
|---|---|---|---|
| Financial Health | Altman Z-Score in distress zone signals high bankruptcy risk | High | Severe |
| Leverage | Debt-to-equity ratio extremely high at 3.37, raising risk | High | High |
| Interest Coverage | Low interest coverage ratio of 1.59 threatens debt servicing | Medium | High |
| Valuation | High P/E ratio (38.78) may indicate overvaluation | Medium | Medium |
| Profitability | Low ROE (5.38%) points to weak shareholder returns | Medium | Medium |
| Market Volatility | Beta near 1 suggests stock moves with market, risk of swings | Medium | Medium |
The most alarming risk is financial distress, as the Altman Z-Score below 1.8 flags bankruptcy danger. High leverage compounds vulnerability amid rising interest rates. Despite a stable dividend yield, profitability metrics remain weak. Investors must weigh these factors carefully before committing capital.
Should You Buy BXP, Inc.?
BXP, Inc. appears to be creating value through a durable competitive moat and growing ROIC, suggesting operational efficiency. Despite substantial leverage and a distress-zone Altman Z-score, the company’s overall rating of C+ reflects a cautiously favorable profile.
Strength & Efficiency Pillars
BXP, Inc. delivers solid operational margins, with a gross margin of 60.56% and an EBIT margin of 29.63%, reflecting efficient core business management. The company’s net margin stands at a moderate 7.95%, and though its ROE is weak at 5.38%, the ROIC at 7.63% exceeds the WACC of 4.41%. This signals that BXP is a value creator, generating returns above its capital cost. The growing ROIC trend further supports a sustainable competitive advantage, enhancing long-term profitability prospects.
Weaknesses and Drawbacks
BXP is in financial distress with an Altman Z-Score of 0.65, signaling a high bankruptcy risk. This solvency concern overshadows profitability metrics. The firm’s leverage is elevated, with a debt-to-equity ratio at 3.37 and debt-to-assets at 66.34%, stressing financial flexibility. Market valuation appears stretched, as the P/E ratio hits 38.78, suggesting premium pricing. Recent trading is seller-dominant, with only 24.14% buyer volume, intensifying near-term downside risks amid bearish momentum.
Our Final Verdict about BXP, Inc.
Despite operational efficiency and value creation, BXP’s distressed financial position makes this investment highly speculative. The low Altman Z-Score warns of severe solvency risk, which investors must weigh heavily. Coupled with unfavorable leverage and market pressures, the profile appears too risky for conservative capital. Caution is paramount until solvency improves and market sentiment stabilizes.
Disclaimer: This content is for informational purposes only and does not constitute financial, investment, or other professional advice. Investing in financial markets involves a significant risk of loss, and past performance is not indicative of future results.
Additional Resources
- Citigroup Inc. Has $13.85 Million Stake in BXP, Inc. $BXP – MarketBeat (Feb 28, 2026)
- BXP Inc. stock underperforms Friday when compared to competitors – MarketWatch (Feb 27, 2026)
- Hilary Jo Spann plans sale of 5,495 BXP shares (NYSE: BXP) – Stock Titan (Feb 27, 2026)
- Why Is Boston Properties (BXP) Down 6% Since Last Earnings Report? – Nasdaq (Feb 26, 2026)
- BXP to Present at the 2026 Citi Global Property CEO Conference – Business Wire (Feb 24, 2026)
For more information about BXP, Inc., please visit the official website: bxp.com