Home > Analyses > Industrials > BWX Technologies, Inc.
BWX Technologies powers the backbone of nuclear propulsion and energy, shaping defense and clean energy sectors worldwide. It commands leadership through cutting-edge naval reactors, nuclear fuel, and critical components that serve both military and commercial clients. Renowned for precision and innovation, BWXT blends legacy expertise with modern technology. As the nuclear landscape evolves, I explore whether BWXT’s strong fundamentals justify its premium valuation and sustained growth potential.

Table of contents
Business Model & Company Overview
BWX Technologies, Inc., founded in 1867 and headquartered in Lynchburg, Virginia, commands a dominant position in the aerospace and defense sector. The company delivers a cohesive ecosystem of nuclear components, fuel, and reactor services across military, commercial, and research applications. Its legacy and innovation enable critical support for naval propulsion, nuclear power production, and advanced nuclear technologies worldwide.
BWXT’s revenue engine blends precision manufacturing with recurring services, spanning three segments: Nuclear Operations, Power, and Services. This balanced mix drives value through hardware sales, fuel supply, and long-term maintenance contracts. Its strategic footprint covers the Americas, Europe, and Asia, underpinning a resilient global presence. BWXT’s enduring economic moat lies in its specialized expertise and indispensable role in national security and energy infrastructure.
Financial Performance & Fundamental Metrics
I analyze BWX Technologies, Inc.’s income statement, key financial ratios, and dividend payout policy to assess its core financial health and shareholder value.
Income Statement
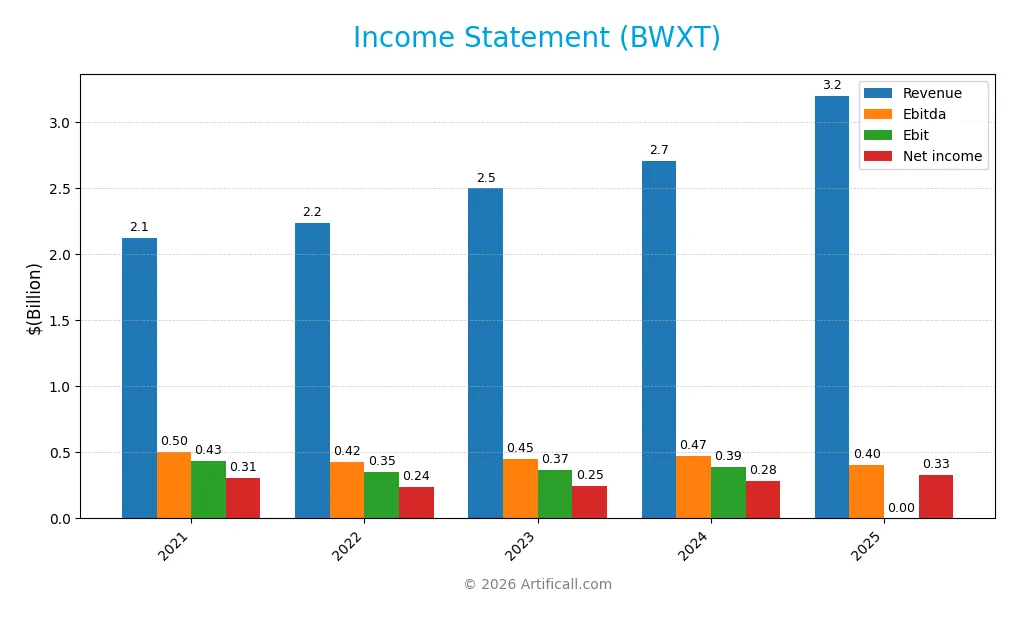
The table below summarizes BWX Technologies, Inc.’s key income statement figures for the fiscal years 2021 through 2025, reported in millions of USD where applicable.
| 2021 | 2022 | 2023 | 2024 | 2025 | |
|---|---|---|---|---|---|
| Revenue | 2.12B | 2.23B | 2.50B | 2.70B | 3.20B |
| Cost of Revenue | 1.57B | 1.68B | 1.88B | 2.05B | 0 |
| Operating Expenses | 204M | 203M | 238M | 275M | 408M |
| Gross Profit | 550M | 552M | 621M | 655M | 0 |
| EBITDA | 501M | 425M | 447M | 474M | 404M |
| EBIT | 431M | 351M | 368M | 388M | 0 |
| Interest Expense | 36M | 36M | 47M | 39M | 44M |
| Net Income | 306M | 238M | 246M | 282M | 330M |
| EPS | 3.24 | 2.60 | 2.68 | 3.08 | 3.60 |
| Filing Date | 2022-02-22 | 2023-02-23 | 2024-02-27 | 2025-02-24 | 2026-02-23 |
Income Statement Evolution
BWXT’s revenue grew steadily from $2.12B in 2021 to $3.2B in 2025, marking a 50.6% increase. Net income showed more modest growth, rising 7.8% over the period to $330M in 2025. Despite revenue gains, gross and EBIT margins fell sharply in 2025, signaling margin pressure and cost challenges.
Is the Income Statement Favorable?
In 2025, BWXT posted $3.2B revenue, an 18.3% rise year-over-year, with net income at $330M, up 16.9% in EPS. However, the absence of reported gross profit and EBIT figures in 2025 raises concerns. Interest expense improved favorably, and net margin held at 10.3%, but margin contraction and rising operating expenses temper optimism. Overall, the fundamentals appear neutral.
Financial Ratios
The table below summarizes key financial ratios for BWX Technologies, Inc. over the past five fiscal years, providing insight into profitability, valuation, liquidity, leverage, and operational efficiency:
| Ratios | 2021 | 2022 | 2023 | 2024 | 2025 |
|---|---|---|---|---|---|
| Net Margin | 14% | 11% | 10% | 10% | 10% |
| ROE | 48% | 32% | 26% | 26% | 27% |
| ROIC | 13% | 12% | 12% | 13% | -50% |
| P/E | 15 | 22 | 29 | 36 | 48 |
| P/B | 7.1 | 7.1 | 7.5 | 9.4 | 12.8 |
| Current Ratio | 1.68 | 2.10 | 2.18 | 1.96 | 0 |
| Quick Ratio | 1.68 | 2.09 | 2.11 | 1.88 | 0 |
| D/E | 1.87 | 1.72 | 1.30 | 0.98 | 1.64 |
| Debt-to-Assets | 0.48 | 0.49 | 0.44 | 0.37 | 0 |
| Interest Coverage | 9.7 | 9.6 | 8.1 | 9.6 | -9.1 |
| Asset Turnover | 0.85 | 0.85 | 0.91 | 0.94 | 0 |
| Fixed Asset Turnover | 2.03 | 1.97 | 2.03 | 2.12 | 0 |
| Dividend Yield | 1.76% | 1.53% | 1.21% | 0.87% | 0.58% |
Note: Zero or missing values indicate unavailable data for that year.
Evolution of Financial Ratios
Return on Equity (ROE) remained strong, hovering around 26-32% before slightly easing to 26.75% in 2025. The Current Ratio showed a declining trend, ending at zero in 2025, indicating liquidity stress. Debt-to-Equity (D/E) increased over the years, rising to 1.64 in 2025, reflecting higher leverage. Profitability margins stayed relatively stable near 10%.
Are the Financial Ratios Fovorable?
In 2025, profitability is favorable with a 10.31% net margin and 26.75% ROE. However, liquidity ratios are unfavorable, with Current and Quick Ratios at zero. Leverage is high, as D/E stands at 1.64, a red flag. Market valuation ratios like P/E at 48 and P/B over 12 appear stretched. Overall, 71% of ratios are unfavorable, suggesting caution.
Shareholder Return Policy
BWX Technologies maintains a dividend payout ratio near 28-34%, with a stable dividend per share growing modestly to about $1.01 in 2025. The annual dividend yield hovers below 1%, supported by free cash flow coverage, indicating prudent capital allocation without overextending distributions.
The company also engages in share buybacks, complementing dividends while managing leverage ratios around 0.62. This balanced approach aligns with sustainable long-term value creation, reflecting disciplined returns amid moderate profitability and stable cash flow generation.
Score analysis
The following radar chart presents BWX Technologies, Inc.’s key financial scores for evaluation:
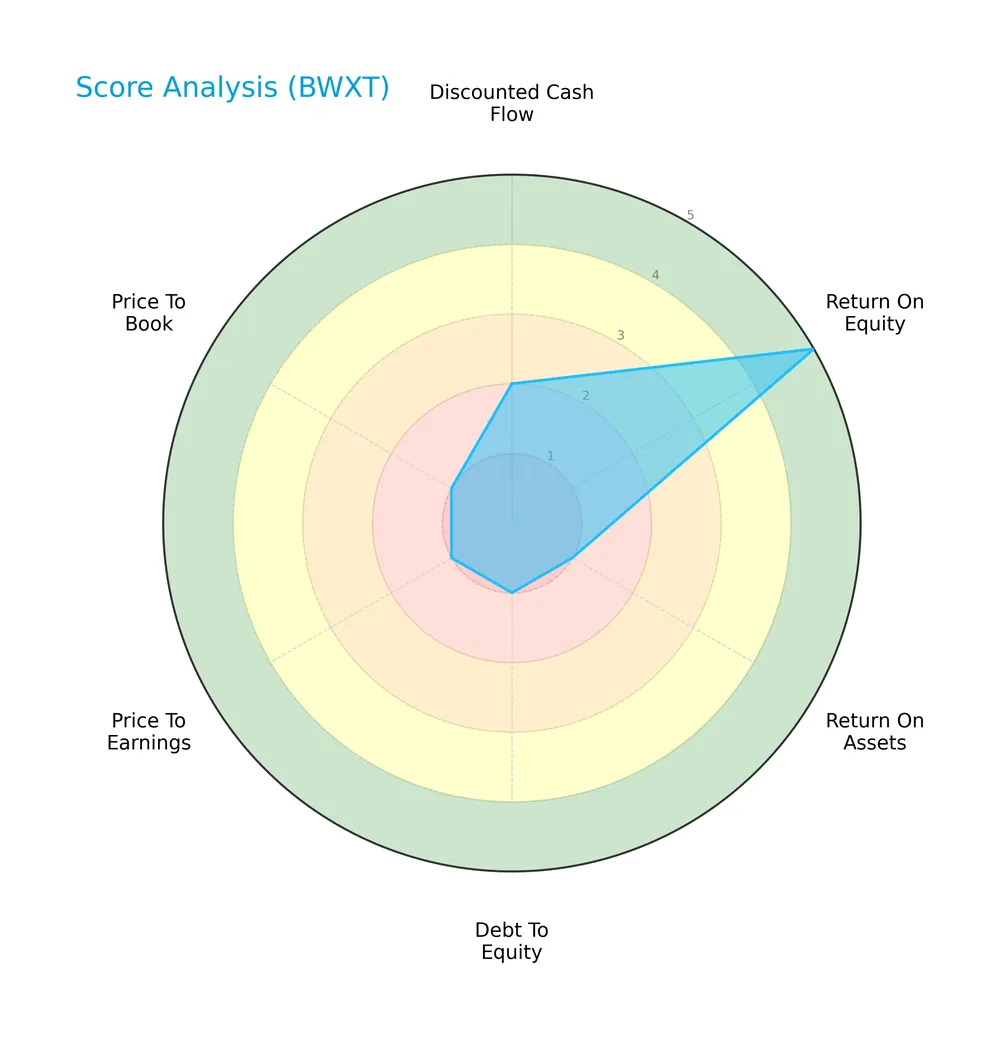
The company shows a strong return on equity with a score of 5, signaling effective shareholder value creation. However, low scores in return on assets, debt to equity, price to earnings, and price to book indicate weaknesses in asset efficiency, leverage, and valuation metrics. The discounted cash flow score also remains unfavorable at 2.
Is the company in good financial health?
Here is the Piotroski Score diagram illustrating BWX Technologies’ financial health:

With a Piotroski Score of 4, BWXT falls into the average category. This suggests moderate financial strength but highlights areas requiring improvement, especially in profitability, leverage, and operational efficiency metrics.
Competitive Landscape & Sector Positioning
This analysis explores BWX Technologies, Inc.’s strategic positioning, revenue by segment, key products, and main competitors. I will assess whether BWXT holds a competitive advantage over its peers in aerospace and defense.
Strategic Positioning
BWX Technologies concentrates heavily on nuclear components and services, primarily serving the U.S. government with $2.35B in 2025 revenue. It maintains significant operations in Canada ($689M) and limited exposure internationally, focusing on aerospace and defense with specialized product segments.
Revenue by Segment
The pie chart illustrates BWX Technologies’ revenue distribution by segment for fiscal year 2025, highlighting the relative contribution of government and commercial operations.
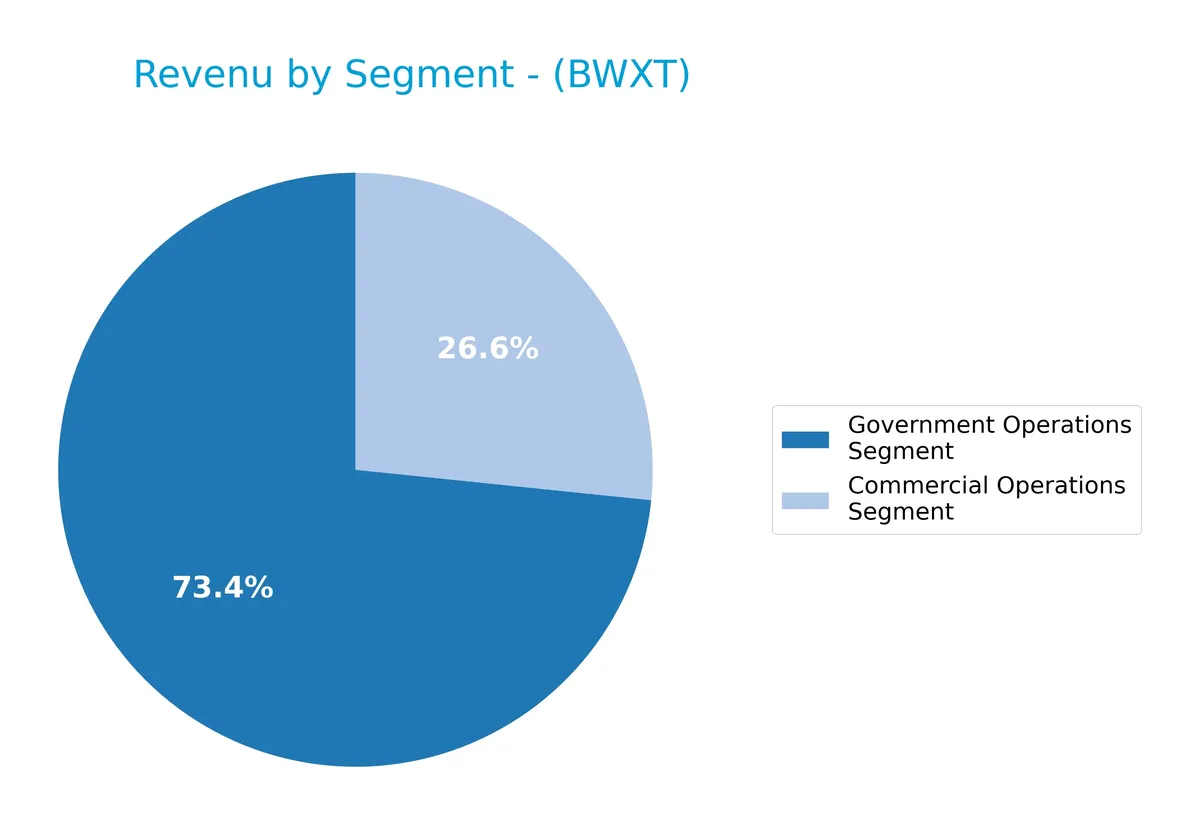
Government Operations segment leads with $2.35B in revenue, showing steady growth since 2022. Commercial Operations increased to $853M, nearly doubling from 2024, signaling rising diversification. The government segment remains the core revenue driver, but accelerating commercial sales reduce concentration risk and suggest strategic expansion beyond the traditional base.
Key Products & Brands
The table below summarizes BWX Technologies, Inc.’s core products and brands across its business segments:
| Product | Description |
|---|---|
| Nuclear Operations Group | Precision naval and critical nuclear components, reactors, nuclear fuel, missile launch tubes, and uranium processing for government and defense use. |
| Nuclear Power Group | Commercial nuclear steam generators, fuel, reactor components, engineering services, and medical radioisotopes for research and therapeutic use. |
| Nuclear Services Group | Nuclear materials processing, environmental site restoration, nuclear reactor design, licensing, and manufacturing services. |
BWXT’s product portfolio spans government-focused nuclear components and fuel to commercial nuclear power equipment and services. Its offerings support critical defense and energy infrastructure with specialized engineering and nuclear technology.
Main Competitors
There are 12 competitors in total, with the table below listing the top 10 leaders by market capitalization:
| Competitor | Market Cap. |
|---|---|
| GE Aerospace | 338.3B |
| RTX Corporation | 250.7B |
| The Boeing Company | 171.4B |
| Lockheed Martin Corporation | 116.3B |
| General Dynamics Corporation | 92.6B |
| Northrop Grumman Corporation | 83.6B |
| TransDigm Group Incorporated | 76.5B |
| L3Harris Technologies, Inc. | 57.0B |
| Axon Enterprise, Inc. | 44.5B |
| BWX Technologies, Inc. | 17.3B |
BWX Technologies ranks 10th among its peers. Its market cap stands at just 5.36% of the leader, GE Aerospace. The company is below both the average market cap of the top 10 competitors (125B) and the sector median (80B). BWXT maintains a significant 145% gap above its next closest rival, highlighting a notable scale difference within this competitive landscape.
Comparisons with competitors
Check out how we compare the company to its competitors:
Does BWXT have a competitive advantage?
BWX Technologies does not exhibit a competitive advantage as it consistently destroys value, with ROIC significantly below WACC and a sharply declining profitability trend from 2021 to 2025. Historically, such a profile signals challenges in efficient capital allocation and sustained economic profits.
Looking ahead, BWXT’s diverse segments—including nuclear components and services for naval, commercial, and medical uses—offer opportunities to expand in international markets like Canada and other regions. However, these prospects will require improved operational efficiency to translate into durable competitive strength.
SWOT Analysis
This SWOT analysis highlights BWX Technologies, Inc.’s core competitive position and strategic challenges.
Strengths
- Strong US government contracts
- Leading nuclear components expertise
- Solid revenue growth of 50% over five years
Weaknesses
- Negative ROIC vs. WACC indicates value destruction
- High debt-to-equity ratio of 1.64
- Elevated P/E and P/B ratios signal overvaluation
Opportunities
- Expansion in nuclear power and medical isotopes
- Growing demand for clean energy technologies
- Increasing international sales, especially in Canada
Threats
- Regulatory risks in nuclear industry
- Intense competition in defense sector
- Volatile operational margins and declining profitability
BWXT’s strengths in government contracts and nuclear expertise underpin growth but are offset by value destruction and financial leverage. Strategic focus should target margin improvement and disciplined capital allocation to mitigate risks.
Stock Price Action Analysis
The following weekly stock chart illustrates BWX Technologies, Inc.’s price movement and volatility over the past 12 months:
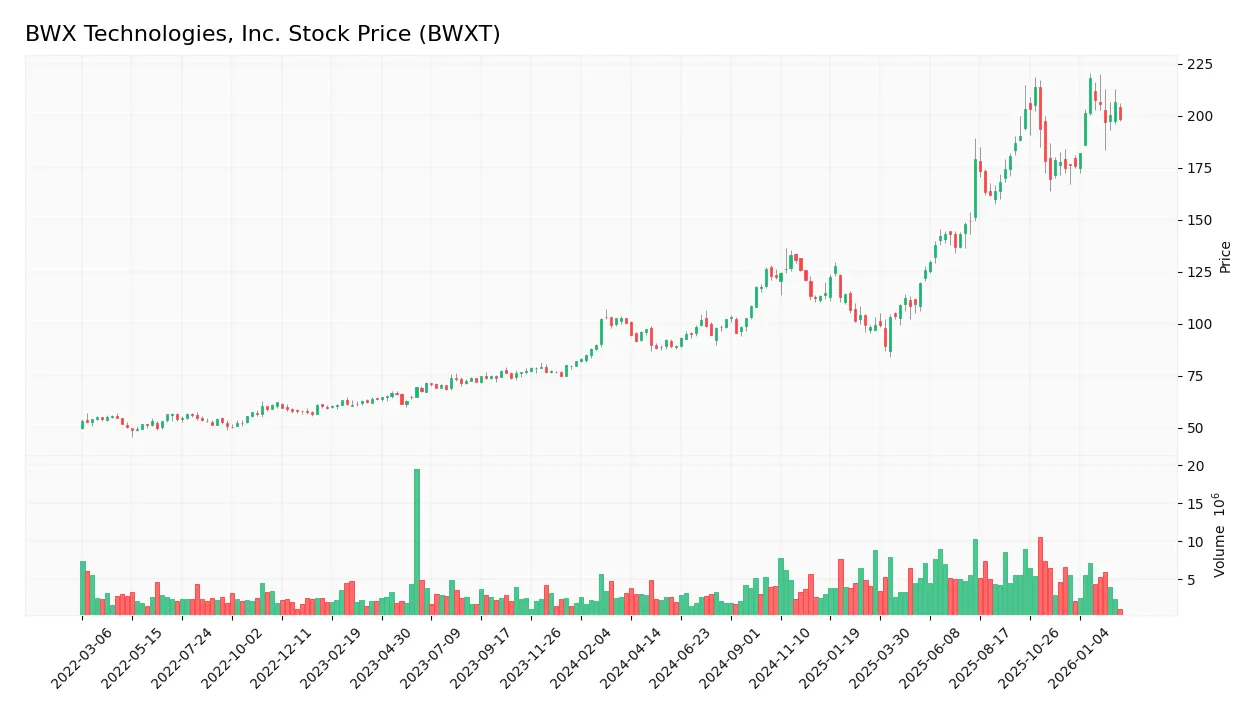
Trend Analysis
BWXT’s stock price rose 97.45% over the past year, signaling a bullish trend with clear acceleration. The price ranged between 88.41 and 217.89, showing strong upward momentum despite a high 38.42 volatility level. Recent months confirm ongoing strength with a 13.34% gain and a 2.72 trend slope since December 2025.
Volume Analysis
Trading volume is increasing, with buyers accounting for 61.16% of total activity over the year, indicating buyer-driven momentum. In the recent three months, buyer dominance drops to 51.88%, reflecting neutral sentiment and balanced market participation between buyers and sellers.
Target Prices
Analysts present a confident target consensus for BWX Technologies, reflecting solid upside potential.
| Target Low | Target High | Consensus |
|---|---|---|
| 180 | 225 | 204 |
The target range suggests bullish sentiment with a 225 high, indicating strong growth expectations for BWXT.

Don’t Let Luck Decide Your Entry Point
Optimize your entry points with our advanced ProRealTime indicators. You’ll get efficient buy signals with precise price targets for maximum performance. Start outperforming now!
Analyst & Consumer Opinions
I will review BWX Technologies, Inc.’s recent analyst ratings and consumer feedback to provide a balanced perspective.
Stock Grades
Here is a summary of recent analyst grades for BWX Technologies, Inc. reflecting varied sentiment across top firms:
| Grading Company | Action | New Grade | Date |
|---|---|---|---|
| Seaport Global | Downgrade | Neutral | 2026-01-20 |
| B of A Securities | Maintain | Buy | 2025-11-13 |
| BTIG | Maintain | Buy | 2025-11-07 |
| Truist Securities | Maintain | Hold | 2025-11-04 |
| Truist Securities | Maintain | Hold | 2025-10-15 |
| Deutsche Bank | Maintain | Hold | 2025-10-08 |
| B of A Securities | Maintain | Buy | 2025-08-13 |
| Maxim Group | Downgrade | Hold | 2025-08-06 |
| Deutsche Bank | Maintain | Hold | 2025-08-06 |
| Truist Securities | Maintain | Hold | 2025-08-05 |
Analyst sentiment for BWXT shows a balanced mix of Buy and Hold ratings, with few downgrades recently. The overall consensus remains Buy, reflecting moderate optimism tempered by caution.
Consumer Opinions
Consumers of BWX Technologies, Inc. express a mix of respect for product quality and concerns about customer service responsiveness.
| Positive Reviews | Negative Reviews |
|---|---|
| “Reliable and efficient nuclear components.” | “Support response times can be frustrating.” |
| “High safety standards and precision.” | “Pricing feels steep compared to competitors.” |
| “Strong commitment to innovation.” | “Delays in order fulfillment reported.” |
Overall, BWX Technologies earns praise for its technical excellence and safety focus. However, customers frequently cite service delays and pricing as key drawbacks.
Risk Analysis
Below is a summary table outlining key risks facing BWX Technologies, Inc. and their likelihood and impact on the company’s performance:
| Category | Description | Probability | Impact |
|---|---|---|---|
| Financial Health | Negative ROIC of -49.87% signals poor capital efficiency, risking shareholder value erosion. | High | High |
| Liquidity | Current and quick ratios at zero indicate severe short-term liquidity issues and operational risk. | High | High |
| Leverage | Debt-to-equity ratio of 1.64 suggests substantial leverage, increasing financial vulnerability. | Medium | Medium |
| Valuation | Elevated P/E (47.98) and P/B (12.84) ratios indicate overvaluation and potential price correction. | Medium | Medium |
| Profitability | Despite a solid ROE (26.75%) and net margin (10.31%), inconsistent asset turnover raises concerns. | Medium | Medium |
| Dividend Yield | Low yield at 0.58% reduces appeal to income-focused investors amid market volatility. | Low | Low |
The most pressing risks are BWXT’s liquidity shortfall and negative ROIC, which historically in aerospace and defense sectors correlate with operational stress and shareholder value destruction. The company’s heavy reliance on debt amid volatile defense budgets adds to financial strain. Investors should monitor liquidity improvements and capital allocation efficiency closely.
Should You Buy BWX Technologies, Inc.?
BWX Technologies appears to show improving operational efficiency with robust return on equity but suffers from a very unfavorable moat due to declining ROIC and negative value creation. Despite substantial leverage, the overall rating suggests a cautious profile, rated C.
Strength & Efficiency Pillars
BWX Technologies, Inc. delivers solid profitability with a net margin of 10.31% and a return on equity of 26.75%. These figures reflect competent operational management and shareholder value generation. However, the company’s return on invested capital (ROIC) stands at -49.87%, significantly below its weighted average cost of capital (WACC) of 7.03%. This negative spread signals value destruction, undermining the firm’s long-term capital efficiency despite favorable net margins.
Weaknesses and Drawbacks
Financial health shows pronounced weaknesses. The company’s price-to-earnings ratio of 47.98 and price-to-book ratio of 12.84 indicate a highly elevated valuation, exposing investors to market correction risks. Leverage is notably high with a debt-to-equity ratio of 1.64, stressing balance sheet resilience. Liquidity concerns surface with a zero current and quick ratio, flagging potential short-term solvency issues. Interest coverage is negative, intensifying risk amid rising debt costs.
Our Final Verdict about BWX Technologies, Inc.
BWXT’s profile suggests operational profitability but is marred by severe capital inefficiency and financial fragility. Despite a bullish long-term stock trend and accelerating price momentum, elevated valuation and balance sheet risks counsel caution. The recent market shows neutral buyer dominance, implying a balanced short-term outlook. Overall, BWXT may appear speculative and better suited for investors with high risk tolerance seeking growth exposure.
Disclaimer: This content is for informational purposes only and does not constitute financial, investment, or other professional advice. Investing in financial markets involves a significant risk of loss, and past performance is not indicative of future results.
Additional Resources
- BWX Technologies (BWXT) Q4 Earnings and Revenues Beat Estimates – Yahoo Finance (Feb 24, 2026)
- BWX Technologies Inc (NYSE:BWXT) Reports Strong Q4 2025 Earnings, Beats Estimates and Provides Robust 2026 Outlook – ChartMill (Feb 23, 2026)
- BWX Technologies Inc (BWXT): A Strategic SWOT Insight – GuruFocus (Feb 24, 2026)
- BWX Technologies, Inc. Profit Advances In Q4 – Nasdaq (Feb 23, 2026)
- BWX: Q4 Earnings Snapshot – KVUE (Feb 23, 2026)
For more information about BWX Technologies, Inc., please visit the official website: bwxt.com