Home > Analyses > Consumer Defensive > Bunge Global S.A.
Bunge Global S.A. powers global food systems by transforming raw agricultural commodities into essential products. It dominates the agribusiness sector with flagship offerings in oilseeds, grains, refined oils, and bioenergy. Known for its integrated supply chain and innovation in sustainable food production, Bunge shapes how millions access nutrition daily. As market dynamics shift and sustainability demands grow, I ask: does Bunge’s strong foundation still justify its current valuation and growth prospects?
Table of contents
Business Model & Company Overview
Bunge Global S.A., founded in 1818 and headquartered in Chesterfield, MO, leads the global Agricultural Farm Products sector. It operates a cohesive ecosystem spanning agribusiness, refined oils, milling, and sugar & bioenergy. This integrated approach drives its mission to connect farmers, food producers, and consumers worldwide with essential agricultural commodities and value-added products.
The company’s revenue engine balances commodity trading with refined product sales and bioenergy production. It sources, processes, and markets oilseeds, grains, packaged oils, flours, and ethanol across the Americas, Europe, and Asia. Bunge’s extensive global footprint and diversified product portfolio create a formidable economic moat, anchoring its role in shaping the future of agribusiness.
Financial Performance & Fundamental Metrics
I analyze Bunge Global S.A.’s income statement, key financial ratios, and dividend payout policy to assess its profitability, efficiency, and shareholder returns.
Income Statement
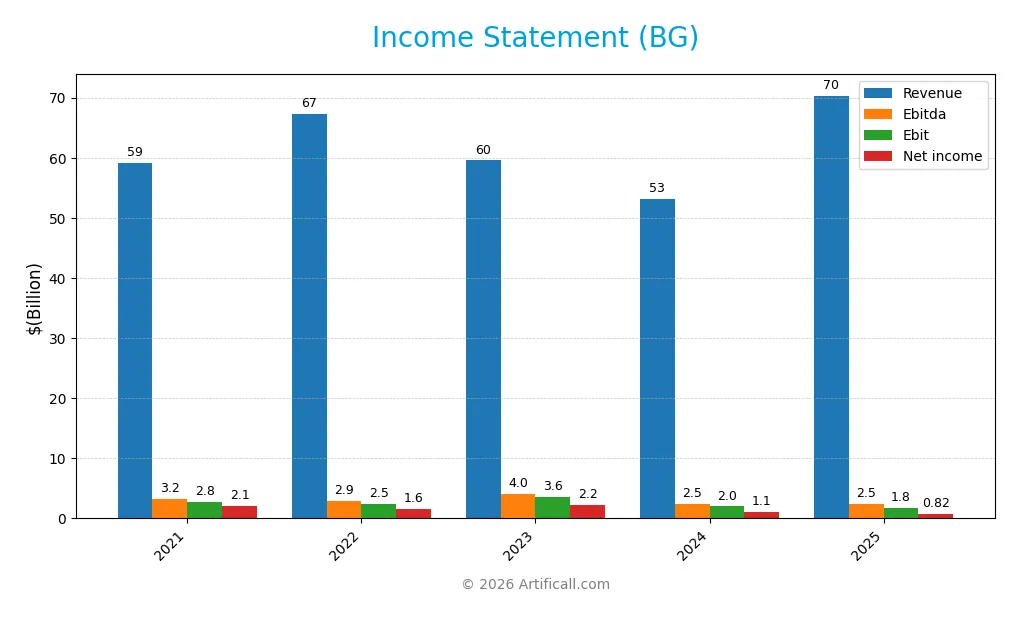
Below is the Income Statement for Bunge Global S.A. covering fiscal years 2021 through 2025, showing key financial performance indicators in USD.
| 2021 | 2022 | 2023 | 2024 | 2025 | |
|---|---|---|---|---|---|
| Revenue | 59.2B | 67.2B | 59.5B | 53.1B | 70.3B |
| Cost of Revenue | 55.8B | 63.6B | 54.7B | 49.7B | 66.9B |
| Operating Expenses | 1.23B | 1.37B | 1.72B | 1.78B | 2.11B |
| Gross Profit | 3.36B | 3.68B | 4.85B | 3.39B | 3.41B |
| EBITDA | 3.23B | 2.88B | 4.02B | 2.46B | 2.47B |
| EBIT | 2.81B | 2.47B | 3.57B | 1.99B | 1.76B |
| Interest Expense | 243M | 403M | 516M | 471M | 628M |
| Net Income | 2.08B | 1.61B | 2.24B | 1.14B | 816M |
| EPS | 14.49 | 10.74 | 15.07 | 8.09 | 4.91 |
| Filing Date | 2022-02-24 | 2023-02-08 | 2024-02-22 | 2025-02-20 | 2026-02-19 |
Income Statement Evolution
From 2021 to 2025, Bunge Global’s revenue grew 19%, reaching $70.3B in 2025. However, net income declined sharply by 61%, falling to $816M. Gross margin held steady around 4.8%, but EBIT and net margins contracted significantly. The company faced margin pressure despite revenue gains, reflecting rising costs and weaker profitability.
Is the Income Statement Favorable?
In 2025, fundamentals appear mixed. Revenue surged 32%, driven by volume or pricing gains, while operating expenses grew proportionally. Yet EBIT fell 12%, and net income dropped 46%, signaling margin compression. Interest expense improved favorably at 0.9% of revenue. Overall, the income statement shows strain on profitability despite top-line strength, resulting in a generally unfavorable evaluation.
Financial Ratios
The table below presents key financial ratios for Bunge Global S.A. over the fiscal years 2021 to 2025:
| Ratios | 2021 | 2022 | 2023 | 2024 | 2025 |
|---|---|---|---|---|---|
| Net Margin | 3.5% | 2.4% | 3.8% | 2.1% | 1.2% |
| ROE | 27.1% | 17.5% | 20.7% | 11.5% | 4.7% |
| ROIC | 11.2% | 11.2% | 12.8% | 6.5% | 2.7% |
| P/E | 6.3 | 9.2 | 6.7 | 9.5 | 18.1 |
| P/B | 1.7 | 1.6 | 1.4 | 1.1 | 0.9 |
| Current Ratio | 1.8 | 1.7 | 2.1 | 2.1 | 1.6 |
| Quick Ratio | 0.9 | 0.9 | 1.2 | 1.3 | 0.7 |
| D/E | 0.9 | 0.6 | 0.5 | 0.7 | 1.0 |
| Debt-to-Assets | 29% | 23% | 23% | 29% | 38% |
| Interest Coverage | 8.8 | 5.7 | 6.1 | 3.4 | 2.1 |
| Asset Turnover | 2.5 | 2.7 | 2.3 | 2.1 | 1.6 |
| Fixed Asset Turnover | 13.4 | 14.5 | 10.9 | 8.6 | 5.3 |
| Dividend Yield | 2.5% | 2.4% | 2.5% | 3.5% | 3.1% |
Evolution of Financial Ratios
From 2021 to 2025, Bunge Global’s Return on Equity (ROE) declined sharply from 27.1% to 4.7%, signaling weakened profitability. The Current Ratio displayed moderate fluctuation, peaking above 2.1 in 2023–2024 before easing to 1.61 in 2025. Debt-to-Equity rose steadily, nearing parity at 0.98 in 2025, indicating increased leverage over the period.
Are the Financial Ratios Favorable?
In 2025, profitability ratios such as ROE (4.7%) and net margin (1.16%) appear unfavorable, underperforming typical industry benchmarks. Liquidity metrics show a favorable Current Ratio (1.61) but an unfavorable Quick Ratio (0.74), suggesting some short-term liquidity concerns. Leverage and coverage ratios are neutral, with a Debt-to-Equity near 1. Asset efficiency and dividend yield are favorable, contributing to an overall slightly favorable ratio profile.
Shareholder Return Policy
Bunge Global S.A. pays dividends with a payout ratio rising to 56.3% in 2025, yielding about 3.1%. Dividend per share increased steadily from $2.29 in 2021 to $2.77 in 2025. The company also conducts share buybacks, though free cash flow coverage remains negative in 2025, signaling caution.
While the dividend yield aligns with industry norms, the negative free cash flow per share raises sustainability concerns. Combined dividend and buyback strategies require monitoring to ensure long-term shareholder value, given the company’s pressured cash flow and capital expenditure demands.
Score analysis
Below is a radar chart illustrating the multiple financial scores evaluating the company’s valuation and performance:
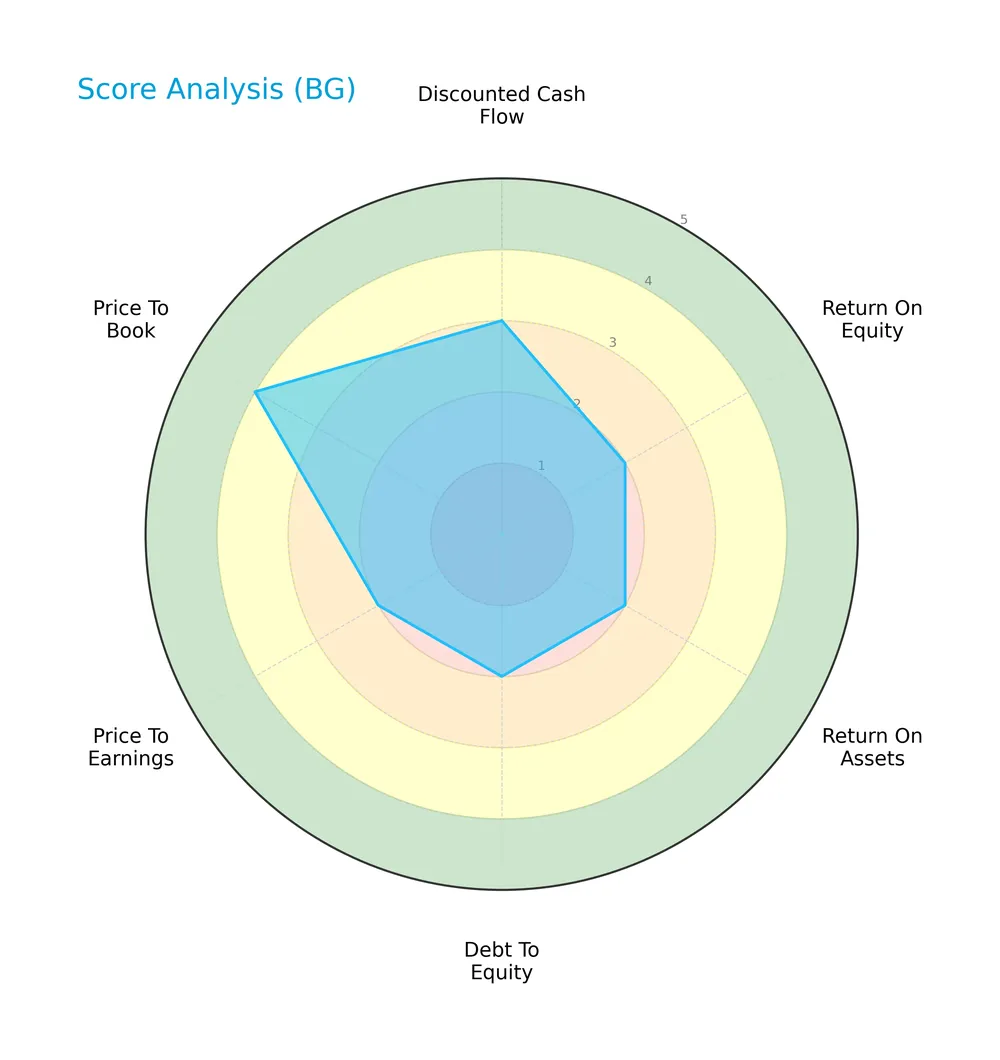
The scores reveal moderate confidence in discounted cash flow, but weaknesses in profitability, leverage, and valuation metrics. Only the price-to-book ratio shows a favorable status, signaling some asset undervaluation.
Analysis of the company’s bankruptcy risk
The Altman Z-Score places the company in the grey zone, indicating moderate bankruptcy risk and financial uncertainty:

Is the company in good financial health?
This Piotroski diagram highlights the company’s overall financial health based on nine key criteria:

A Piotroski score of 4 suggests average financial strength, reflecting mixed signals on profitability and operational efficiency that warrant cautious interpretation.
Competitive Landscape & Sector Positioning
This analysis assesses Bunge Global S.A.’s strategic positioning within the agricultural farm products sector. It examines revenue streams, key products, and major competitors shaping the market. I will evaluate whether Bunge Global holds a competitive advantage over its peers in this industry.
Strategic Positioning
Bunge Global S.A. maintains a diversified portfolio across agribusiness, edible oils, milling, and bioenergy. Geographically, it spans major markets including the US, Europe, Asia Pacific, and South America, reflecting broad global exposure and reducing reliance on any single region or product line.
Revenue by Segment
This pie chart illustrates Bunge Global S.A.’s revenue distribution by product segment for the fiscal year 2025, highlighting the relative contribution of each segment during that period.
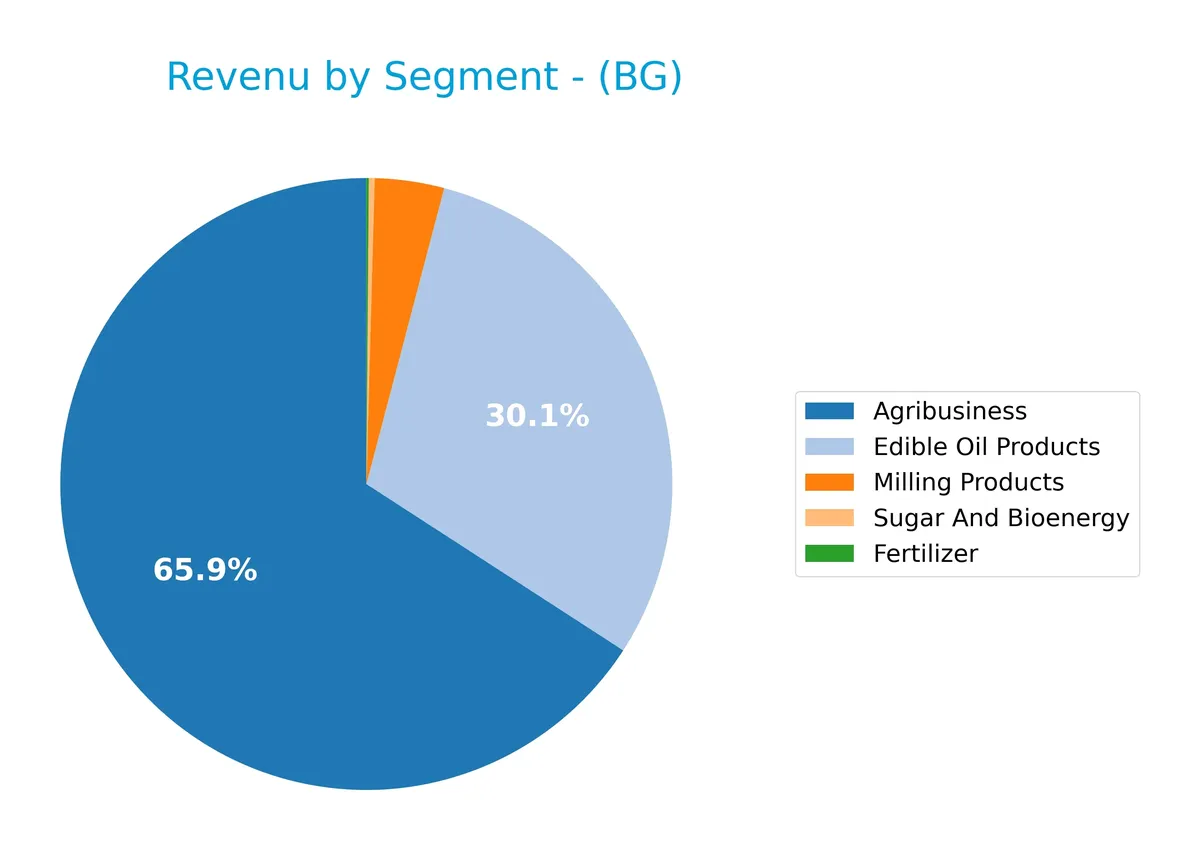
In 2025, Milling Products generated $1.55B, dominating the segment revenue picture. Other Products contributed a minimal $3M, indicating a concentrated revenue base. Compared to prior years, the absence of larger segments like Agribusiness or Edible Oil Products in 2025 suggests a notable structural shift or segment reclassification, signaling increased concentration risk and possible volatility in top-line performance.
Key Products & Brands
The following table outlines Bunge Global S.A.’s key products and brand segments with concise descriptions:
| Product | Description |
|---|---|
| Agribusiness | Purchases, stores, transports, processes, and sells agricultural commodities including oilseeds and grains. Serves animal feed, livestock, millers, and biofuel companies. |
| Refined and Specialty Oils | Sells packaged and bulk oils and fats like cooking oils, shortenings, margarines, and mayonnaise for food manufacturers and retailers. |
| Milling Products | Provides wheat flours, bakery mixes, corn milling products, whole grains, fiber ingredients, quinoas, millets, pellets, and non-GMO products. |
| Sugar and Bioenergy | Produces sugar and ethanol and generates electricity from sugarcane bagasse burning. |
| Fertilizer | Fertilizer products supporting agricultural activities. |
| Other Products | Miscellaneous products with minimal revenue contribution. |
Bunge Global’s portfolio spans across agricultural commodities, edible oils, milling, sugar, bioenergy, and fertilizers. This diverse product mix supports multiple food and industrial markets worldwide.
Main Competitors
In total, 4 competitors operate in the Consumer Defensive sector’s Agricultural Farm Products industry; the table lists the top 4 leaders by market capitalization:
| Competitor | Market Cap. |
|---|---|
| Archer-Daniels-Midland Company | 28.4B |
| Tyson Foods, Inc. | 20.7B |
| Bunge Global S.A. | 17.9B |
| SMITHFIELD FOODS INC | 8.8B |
Bunge Global ranks 3rd among its competitors with a market cap at 83.1% of the leader’s size. It stands above both the average market cap of the top 10 (18.9B) and the sector median (19.3B). The 12.13% gap to Tyson Foods indicates a moderate distance to its nearest competitor above.
Comparisons with competitors
Check out how we compare the company to its competitors:
Does BG have a competitive advantage?
Bunge Global S.A. lacks a competitive advantage, as its ROIC trails WACC by 2.5% and shows a steep declining trend, indicating value destruction and deteriorating profitability. The company’s agricultural commodity focus faces intense competition, limiting its ability to generate excess returns over capital costs.
Future outlook includes opportunities in expanding refined oils, milling, and bioenergy segments, targeting diverse markets such as the US and Europe. However, sustained improvements in capital efficiency and profitability are needed to convert these opportunities into a durable competitive edge.
SWOT Analysis
This analysis highlights Bunge Global S.A.’s core strengths, weaknesses, opportunities, and threats to guide strategic decisions.
Strengths
- strong revenue growth of 18.9% CAGR (2021-2025)
- diversified geographic footprint
- favorable debt to equity ratio (0.98)
Weaknesses
- declining ROIC below WACC indicates value destruction
- weak net margin at 1.16%
- unfavorable earnings and net income growth trends
Opportunities
- expanding demand for sustainable bioenergy
- potential margin improvement via operational efficiencies
- growth in emerging markets agriculture
Threats
- commodity price volatility
- regulatory risks in multiple jurisdictions
- intensifying global competition
Bunge’s robust revenue growth and geographic diversity provide a solid foundation. However, persistent profitability erosion and value destruction demand urgent strategic focus on operational excellence and cost control. The company must leverage bioenergy trends while mitigating commodity and regulatory risks.
Stock Price Action Analysis
The following weekly stock chart illustrates Bunge Global S.A.’s price movements and key levels over the past 12 months:
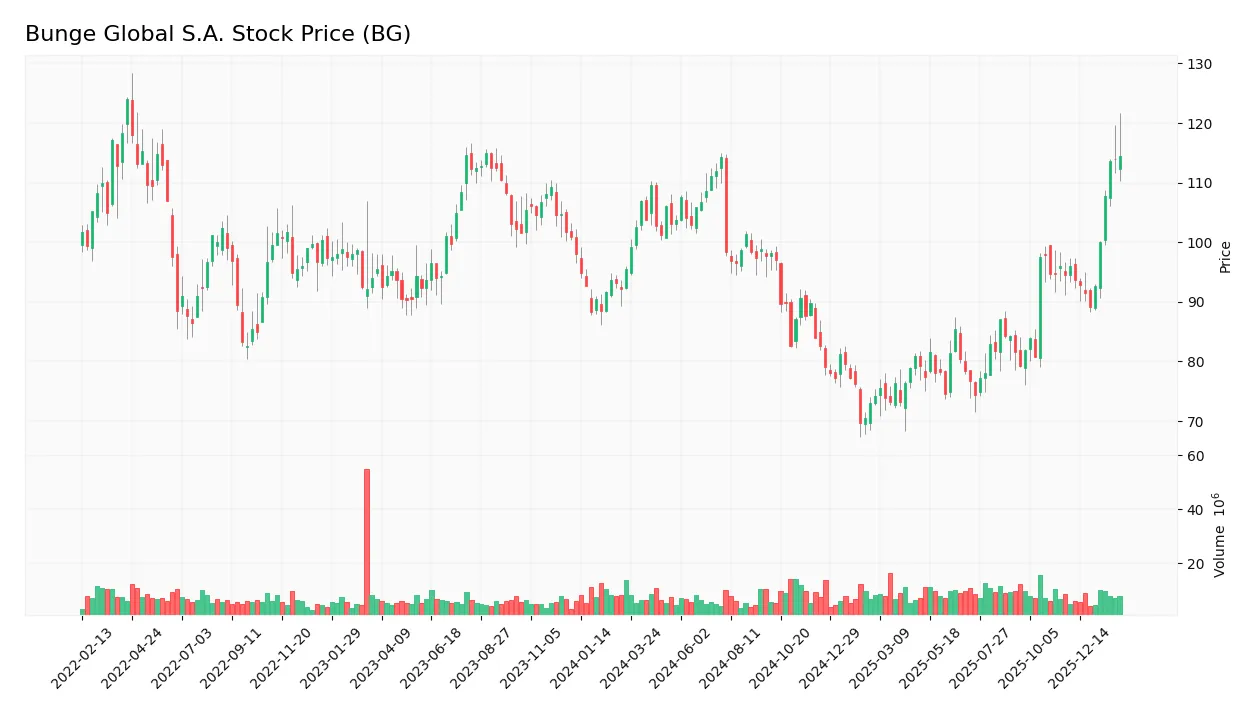
Trend Analysis
Over the past year, BG’s stock rose 18.95%, signaling a bullish trend with accelerating momentum. The price ranged from a low of 69.6 to a high of 122.53. Volatility, measured by a 12.96 standard deviation, remains elevated, reflecting dynamic market conditions and strong investor interest.
Volume Analysis
Trading volume for BG has increased, driven by buyer dominance. Over the recent three months, buyers accounted for 66.45% of volume, signaling positive investor sentiment and heightened market participation. This buyer-driven activity supports the bullish price trend observed in the stock.
Target Prices
Analysts set a clear target consensus for Bunge Global S.A. (BG), signaling moderate upside potential.
| Target Low | Target High | Consensus |
|---|---|---|
| 95 | 145 | 120.33 |
The target range suggests cautious optimism, with a consensus price pointing to steady growth expectations.

Don’t Let Luck Decide Your Entry Point
Optimize your entry points with our advanced ProRealTime indicators. You’ll get efficient buy signals with precise price targets for maximum performance. Start outperforming now!
Analyst & Consumer Opinions
This section examines analyst ratings and consumer feedback related to Bunge Global S.A. (BG) for investment insights.
Stock Grades
Here are the latest verified stock grades for Bunge Global S.A. from leading financial institutions:
| Grading Company | Action | New Grade | Date |
|---|---|---|---|
| JP Morgan | Maintain | Overweight | 2026-02-05 |
| Barclays | Maintain | Overweight | 2026-02-05 |
| UBS | Maintain | Buy | 2026-02-05 |
| Morgan Stanley | Maintain | Overweight | 2026-02-05 |
| JP Morgan | Maintain | Overweight | 2026-01-21 |
| Morgan Stanley | Upgrade | Overweight | 2025-12-16 |
| B of A Securities | Maintain | Buy | 2025-12-02 |
| Barclays | Upgrade | Overweight | 2025-11-06 |
| Barclays | Maintain | Equal Weight | 2025-10-21 |
| Stephens & Co. | Maintain | Overweight | 2025-10-17 |
The consensus reflects a clear positive momentum, with multiple upgrades to Overweight and consistent Buy ratings. This pattern indicates sustained analyst confidence with no recent downgrades.
Consumer Opinions
Bunge Global S.A. receives mixed consumer sentiment, reflecting its complex presence in global markets.
| Positive Reviews | Negative Reviews |
|---|---|
| Reliable supply chain and product quality. | Occasional delays in delivery schedules. |
| Strong commitment to sustainable sourcing. | Customer service responsiveness needs improvement. |
| Competitive pricing in commodity markets. | Limited transparency on pricing models. |
Overall, consumers praise Bunge’s quality and sustainability efforts but express frustration with delivery timing and customer support. These issues could impact loyalty if not addressed promptly.
Risk Analysis
Below is a summary of key risks facing Bunge Global S.A., highlighting their likelihood and potential impact:
| Category | Description | Probability | Impact |
|---|---|---|---|
| Market Volatility | Exposure to commodity price swings affects revenue and margins. | High | High |
| Operational Risk | Supply chain disruptions could impair processing and delivery capabilities. | Medium | Medium |
| Financial Health | Low ROIC (2.74%) vs. WACC (5.2%) indicates capital inefficiency. | Medium | High |
| Liquidity Risk | Quick ratio of 0.74 signals possible short-term liquidity stress. | Medium | Medium |
| Regulatory Risk | Changes in agricultural and bioenergy regulations may increase compliance costs. | Low | Medium |
| Credit Risk | Moderate interest coverage ratio (2.81) may constrain financial flexibility. | Medium | Medium |
I observe that market volatility remains the most likely and impactful risk due to Bunge’s commodity-dependent business. The company’s ROIC below WACC signals a fundamental capital allocation challenge. Additionally, a quick ratio under 1 is a red flag for near-term liquidity pressure. These factors warrant caution despite a stable Altman Z-score in the grey zone.
Should You Buy Bunge Global S.A.?
Bunge Global appears to be in a grey zone with moderate financial strength and a B- rating reflecting mixed signals. Despite manageable liquidity, the company shows declining profitability and a very unfavorable moat, suggesting operational efficiency challenges and value erosion risks.
Strength & Efficiency Pillars
Bunge Global S.A. exhibits operational resilience with moderate gross (4.85%) and EBIT margins (2.51%). Interest expense remains controlled at 0.89%, supporting financial flexibility. The company maintains a favorable weighted average cost of capital (WACC) at 5.2%, but its return on invested capital (ROIC) of 2.74% trails this benchmark, indicating value erosion rather than creation. Despite this, solid asset turnover (1.58) and fixed asset turnover (5.26) reflect efficient asset use. Dividend yield at 3.1% further signals shareholder returns amid mixed profitability.
Weaknesses and Drawbacks
Bunge Global operates in the Altman Z-Score grey zone at 2.48, signaling moderate bankruptcy risk that demands caution. Profitability metrics remain weak with a net margin of 1.16% and ROE of 4.7%, both unfavorable. The price-to-earnings ratio of 18.12 is neutral, but the price-to-book ratio of 0.85 is favorable, implying undervaluation relative to book value. Liquidity is mixed: a strong current ratio of 1.61 contrasts with a weak quick ratio of 0.74. Debt-to-equity sits near one (0.98), reflecting moderate leverage without excessive risk.
Our Final Verdict about Bunge Global S.A.
Bunge Global’s financial profile is cautious due to its Altman Z-Score in the grey zone, suggesting moderate solvency risk despite operational strengths. The company’s declining ROIC versus WACC and weak profitability metrics temper enthusiasm. However, recent buyer dominance and a bullish long-term trend might appear to offer upside potential. Investors should consider this a highly speculative opportunity and may prefer a wait-and-see stance until clearer financial stability emerges.
Disclaimer: This content is for informational purposes only and does not constitute financial, investment, or other professional advice. Investing in financial markets involves a significant risk of loss, and past performance is not indicative of future results.
Additional Resources
- Winners And Losers Of Q4: Bunge Global (NYSE:BG) Vs The Rest Of The Ingredients, Flavors & Fragrances Stocks – Finviz (Feb 20, 2026)
- Decoding Bunge Global SA (BG): A Strategic SWOT Insight – GuruFocus (Feb 20, 2026)
- Bunge Global Stock Outlook: Is Wall Street Bullish or Bearish? – Yahoo Finance (Feb 17, 2026)
- Bunge Global SA SEC 10-K Report – TradingView (Feb 19, 2026)
- Bunge Global (BG) Is Up 6.8% After Revenue Surges But Profitability Slips Amid Viterra Integration – Sahm (Feb 18, 2026)
For more information about Bunge Global S.A., please visit the official website: bunge.com