Home > Analyses > Consumer Defensive > Brown-Forman Corporation
Brown-Forman Corporation crafts some of the world’s most iconic spirits, shaping social moments and consumer tastes globally. With flagship brands like Jack Daniel’s and Herradura, it stands out as a titan in the beverages industry, combining tradition with innovation to maintain market dominance. Renowned for quality and broad international reach, Brown-Forman’s performance prompts a critical question: does its current valuation fully reflect its growth prospects and resilient fundamentals?
Table of contents
Business Model & Company Overview
Brown-Forman Corporation, founded in 1870 and headquartered in Louisville, Kentucky, stands as a dominant player in the beverages industry, specializing in wineries and distilleries. Its diverse portfolio spans spirits, wines, and ready-to-drink products, unified by a core mission to deliver premium alcoholic beverages globally. Iconic brands like Jack Daniel’s and Herradura form an interconnected ecosystem that captivates consumers and retailers alike.
The company’s revenue engine balances manufacturing, distilling, bottling, and marketing across multiple product lines, supported by contract bottling and bulk sales. With operations spanning the United States, Germany, Australia, the UK, Mexico, and beyond, Brown-Forman leverages a strategic global footprint to drive growth. Its strong brand equity and integrated supply chain create a robust economic moat, shaping the future of the alcoholic beverage market.
Financial Performance & Fundamental Metrics
In this section, I will analyze Brown-Forman Corporation’s income statement, key financial ratios, and dividend payout policy to assess its overall financial health.
Income Statement
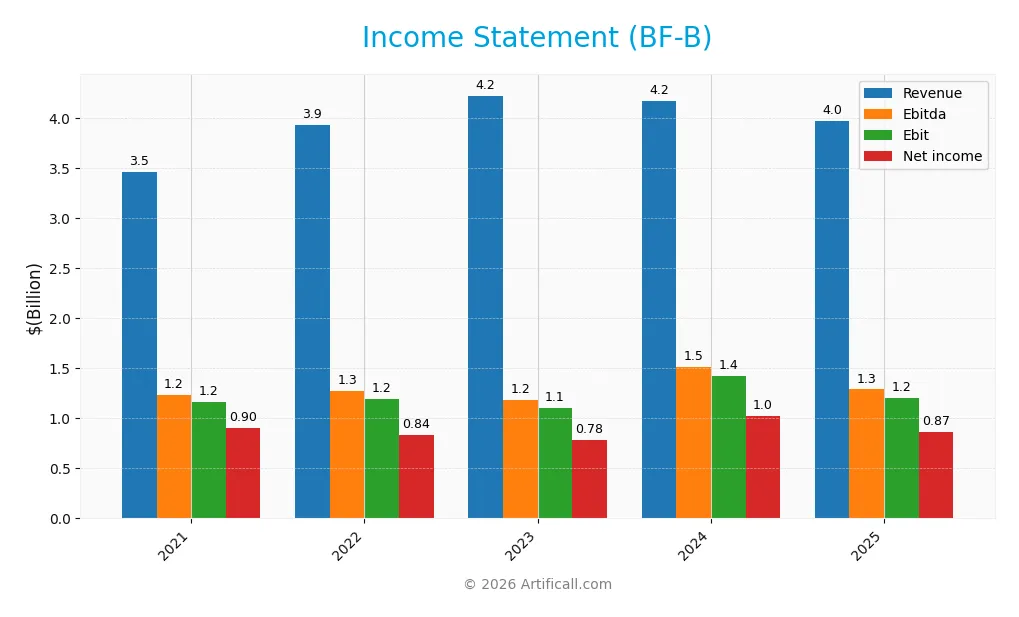
The table below summarizes Brown-Forman Corporation’s key income statement figures for the last five fiscal years, reflecting its financial performance in USD.
| 2021 | 2022 | 2023 | 2024 | 2025 | |
|---|---|---|---|---|---|
| Revenue | 3.46B | 3.93B | 4.23B | 4.18B | 3.98B |
| Cost of Revenue | 1.37B | 1.54B | 1.73B | 1.65B | 1.63B |
| Operating Expenses | 928M | 1.19B | 1.37B | 1.11B | 1.24B |
| Gross Profit | 2.09B | 2.39B | 2.49B | 2.53B | 2.34B |
| EBITDA | 1.24B | 1.28B | 1.19B | 1.51B | 1.29B |
| EBIT | 1.16B | 1.20B | 1.11B | 1.43B | 1.20B |
| Interest Expense | 81M | 82M | 90M | 127M | 122M |
| Net Income | 903M | 838M | 783M | 1.02B | 869M |
| EPS | 1.89 | 1.75 | 1.63 | 2.15 | 1.84 |
| Filing Date | 2021-06-21 | 2022-06-17 | 2023-06-16 | 2024-06-14 | 2025-06-13 |
Income Statement Evolution
Between 2021 and 2025, Brown-Forman Corporation’s revenue increased by 14.85%, indicating moderate top-line growth, but it declined by 4.86% in the most recent year. Net income showed a slight overall decrease of 3.77% over the period, with a sharper 10.8% drop in net margin last year. Gross and EBIT margins remain favorable at 58.94% and 30.26%, respectively, though margins slightly contracted recently.
Is the Income Statement Favorable?
In 2025, Brown-Forman reported revenue of $3.98B and net income of $869M, translating to a net margin of 21.86%, which is considered favorable. However, key metrics including revenue, gross profit, EBIT, net margin, and EPS all declined compared to 2024, reflecting recent operational pressures. Interest expense as a percentage of revenue remains low at 3.07%, but the overall income statement assessment for 2025 is unfavorable due to the majority of negative growth indicators.
Financial Ratios
The following table presents key financial ratios for Brown-Forman Corporation (BF-B) over the last five fiscal years, illustrating profitability, valuation, liquidity, leverage, and efficiency metrics:
| Ratios | 2021 | 2022 | 2023 | 2024 | 2025 |
|---|---|---|---|---|---|
| Net Margin | 26% | 21% | 19% | 25% | 22% |
| ROE | 34% | 31% | 24% | 29% | 22% |
| ROIC | 17% | 16% | 13% | 15% | 12% |
| P/E | 40.4 | 38.5 | 40.0 | 22.3 | 18.9 |
| P/B | 13.7 | 11.8 | 9.6 | 6.5 | 4.1 |
| Current Ratio | 4.3 | 3.7 | 3.5 | 2.6 | 3.9 |
| Quick Ratio | 2.4 | 1.9 | 1.4 | 0.9 | 1.6 |
| D/E | 0.96 | 0.83 | 0.89 | 0.88 | 0.68 |
| Debt-to-Assets | 39% | 36% | 37% | 38% | 34% |
| Interest Coverage | 14.4 | 14.7 | 12.5 | 11.1 | 9.1 |
| Asset Turnover | 0.53 | 0.62 | 0.54 | 0.51 | 0.49 |
| Fixed Asset Turnover | 4.2 | 4.5 | 4.1 | 3.9 | 3.6 |
| Dividend Yield | 0.93% | 2.57% | 1.21% | 1.77% | 2.55% |
Evolution of Financial Ratios
Brown-Forman’s Return on Equity (ROE) declined from 34.0% in 2021 to 21.8% in 2025, indicating a slowing growth in profitability. The Current Ratio generally decreased from 4.27 in 2021 to 3.88 in 2025, reflecting a slight reduction in liquidity but remaining above 1. The Debt-to-Equity Ratio improved from 0.96 in 2021 to 0.68 in 2025, showing a decrease in financial leverage over the period.
Are the Financial Ratios Favorable?
In 2025, profitability ratios such as net margin (21.9%) and ROE (21.8%) are favorable, supported by a strong interest coverage ratio of 9.86. Liquidity is mixed with a high current ratio of 3.88 deemed unfavorable, while the quick ratio at 1.56 is favorable. Leverage ratios including debt-to-equity (0.68) and debt-to-assets (33.8%) are neutral. Market valuation shows a neutral P/E of 18.95 but an unfavorable price-to-book ratio of 4.12. Overall, the financial ratios present a generally favorable profile.
Shareholder Return Policy
Brown-Forman Corporation consistently pays dividends with a payout ratio around 48%, supported by a dividend yield near 2.55% in 2025. Dividend coverage by free cash flow and capital expenditure is adequate, and the company also engages in share buybacks, indicating balanced capital returns to shareholders.
This distribution approach appears sustainable given the company’s solid profitability and cash flow metrics, suggesting a prudent balance between rewarding shareholders and maintaining financial flexibility for future growth and stability.
Score analysis
The following radar chart provides an overview of Brown-Forman Corporation’s key financial scores for investment evaluation:
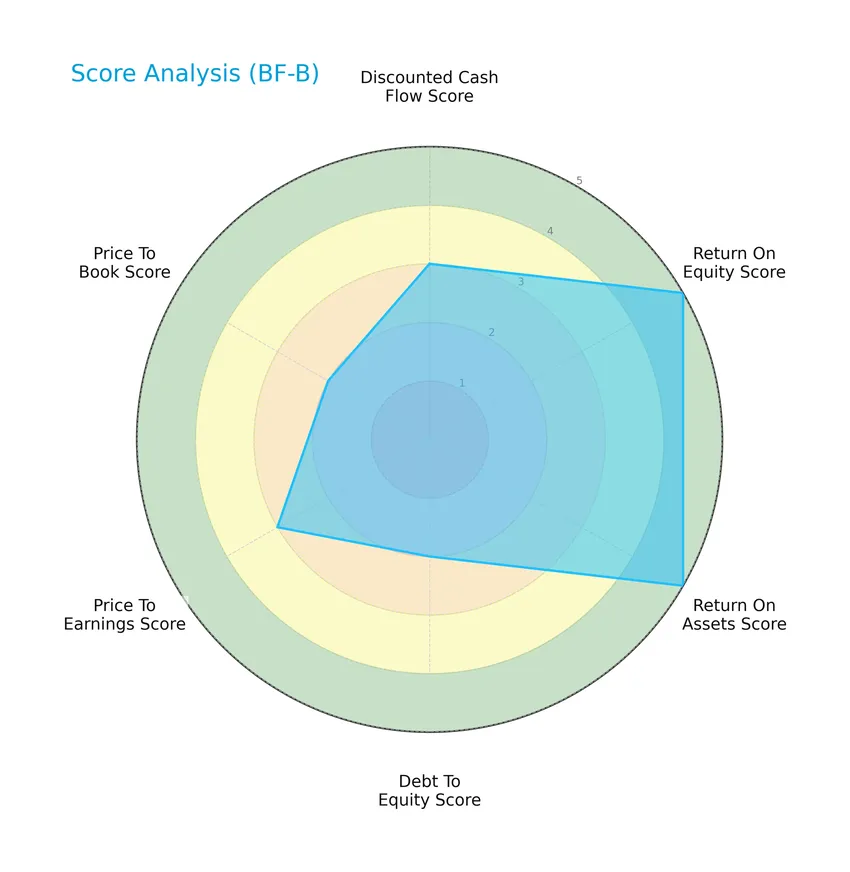
Brown-Forman shows strong profitability with high return on equity and assets scores of 5 each. Its discounted cash flow and price to earnings scores are moderate at 3, while debt to equity and price to book scores are lower at 2, indicating some leverage and valuation considerations.
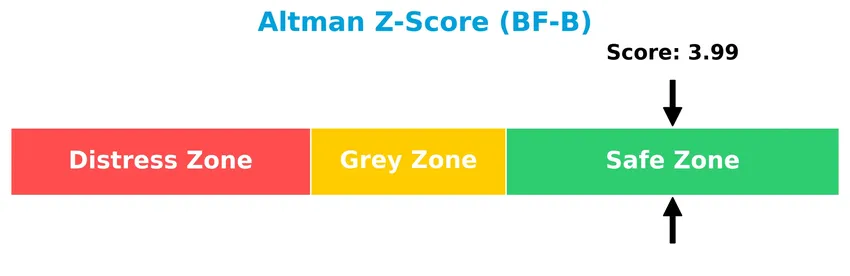
Analysis of the company’s bankruptcy risk
Brown-Forman’s Altman Z-Score positions it firmly in the safe zone, indicating a low likelihood of bankruptcy and strong financial stability:
Is the company in good financial health?
This Piotroski diagram highlights the company’s financial strength based on nine fundamental criteria:

With a Piotroski Score of 7, Brown-Forman is classified as financially strong, reflecting solid profitability, liquidity, and operational efficiency.
Competitive Landscape & Sector Positioning
This sector analysis will explore Brown-Forman Corporation’s strategic positioning, revenue segments, key products, main competitors, competitive advantages, and SWOT. I will examine whether the company holds a competitive advantage over its industry peers in the beverages sector.
Strategic Positioning
Brown-Forman maintains a diversified product portfolio focused heavily on whiskey, generating $2.8B in 2025, complemented by tequila, ready-to-drink, and other spirits. Geographically, it operates broadly, with significant exposure in the US ($1.77B), Europe, Mexico, Australia, and the UK, reflecting balanced international reach.
Revenue by Segment
This pie chart illustrates Brown-Forman Corporation’s revenue distribution by product segment for the fiscal year 2025.
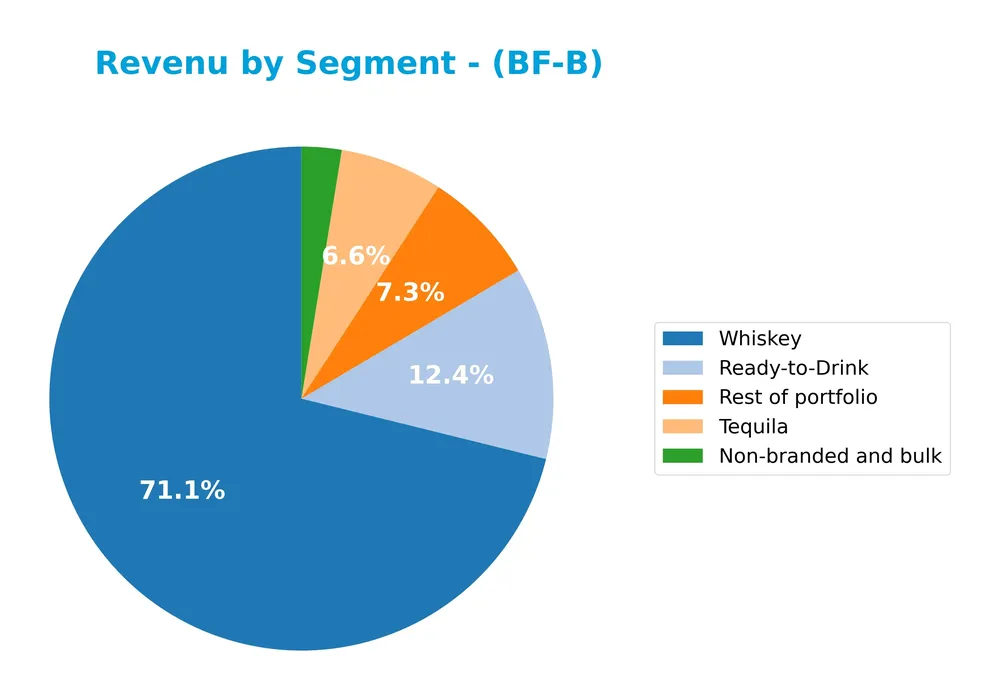
In 2025, Whiskey remains the dominant revenue driver with $2.83B, showing stable strength in the portfolio. Ready-to-Drink and Tequila segments contribute significantly, with $491M and $262M respectively, though Ready-to-Drink saw a slight decline from previous years. The Rest of portfolio and Non-branded and bulk segments show moderate size increases. Overall, the company’s revenue is concentrated in Whiskey, highlighting both robust performance and potential concentration risk.
Key Products & Brands
The table below presents Brown-Forman Corporation’s main products and brands with their respective descriptions:
| Product | Description |
|---|---|
| Jack Daniel’s | Leading whiskey brand known for Tennessee whiskey and flavored liqueurs. |
| Reserve | Premium whiskey offerings within the portfolio. |
| Old Forester | Historic bourbon whiskey brand. |
| Coopers’ Craft | Whiskey brand contributing to the whiskey segment. |
| Herradura | Tequila brand part of the company’s tequila portfolio. |
| el Jimador | Another key tequila brand under Brown-Forman. |
| New Mix | Ready-to-Drink cocktails and ready-to-pour products. |
| Korbel Champagnes | Champagne brand in the wine segment. |
| Sonoma-Cutrer | Wine brand within the portfolio. |
| Finlandia | Vodka brand included in the spirits segment. |
| GlenDronach | Whiskey brand focused on Scotch whiskey. |
| Benriach | Scotch whiskey brand. |
| Glenglassaugh | Another Scotch whiskey brand in the portfolio. |
| Chambord | Liqueur brand offered by the company. |
| Slane | Whiskey brand within the spirits portfolio. |
| Fords Gin | Gin brand included in the spirits offerings. |
| Non-branded and bulk | Sales of bulk whiskey, wine, and used barrels. |
| Ready-to-Drink | Ready-to-Drink cocktails and related products. |
| Tequila | Includes Herradura, el Jimador, and other tequila products. |
| Whiskey | Core segment including Jack Daniel’s, Old Forester, and others. |
| Vodka | Includes Finlandia and other vodka offerings. |
| Wine | Portfolio includes Korbel Champagnes, Sonoma-Cutrer, and other wines. |
| Rest of portfolio | Other alcoholic beverages and related products not classified above. |
Brown-Forman’s key products focus heavily on whiskey, which generates the largest revenue, supported by tequila, ready-to-drink beverages, and wine. The portfolio is diversified across several premium brands and categories.
Main Competitors
There are 4 competitors in the Consumer Defensive sector, with the table listing the top 4 leaders by market capitalization:
| Competitor | Market Cap. |
|---|---|
| Diageo plc | 47.9B |
| Constellation Brands, Inc. | 24.7B |
| Brown-Forman Corporation (BF-A) | 12.4B |
| Brown-Forman Corporation (BF-B) | 12.3B |
Brown-Forman Corporation’s BF-B shares the 4th position among its sector peers, holding about 27% of the market cap of leader Diageo plc. It stands below both the average market cap of the top competitors (24.4B) and the sector median (18.6B). The company is closely trailing its next competitor above by approximately 4.57%, indicating a relatively tight market cap gap at its rank.
Comparisons with competitors
Check out how we compare the company to its competitors:
Does BF-B have a competitive advantage?
Brown-Forman Corporation demonstrates a competitive advantage by consistently generating a ROIC 6.76% above its WACC, indicating value creation despite a declining ROIC trend. The company maintains favorable margins, with gross margin at 58.94% and net margin at 21.86%, supporting its profitability.
Looking ahead, Brown-Forman’s extensive product portfolio and international presence across key markets including the US, Germany, Mexico, and the UK offer opportunities for growth. Continued innovation in ready-to-drink cocktails and expansion in emerging markets could support future revenue streams.
SWOT Analysis
This SWOT analysis highlights Brown-Forman Corporation’s key internal strengths and weaknesses alongside external opportunities and threats to inform strategic investment decisions.
Strengths
- strong brand portfolio including Jack Daniel’s
- favorable profitability margins with 21.86% net margin
- solid financial stability reflected by Altman Z-Score in safe zone
Weaknesses
- recent 4.86% revenue decline in past year
- declining net margin trend over 5 years
- relatively high price-to-book ratio at 4.12
Opportunities
- growth potential in emerging international markets
- innovation in ready-to-drink and premium spirits segments
- leverage strong distribution channels globally
Threats
- intense competition in alcoholic beverages industry
- regulatory changes impacting alcohol sales
- currency fluctuations affecting international revenue
Brown-Forman shows solid brand strength and profitability but faces recent revenue and margin pressures. The company’s strategy should focus on revitalizing growth via international expansion and product innovation while managing competitive and regulatory risks carefully.
Stock Price Action Analysis
The weekly stock chart for Brown-Forman Corporation (BF-B) illustrates price movements and volume trends over the analyzed period:
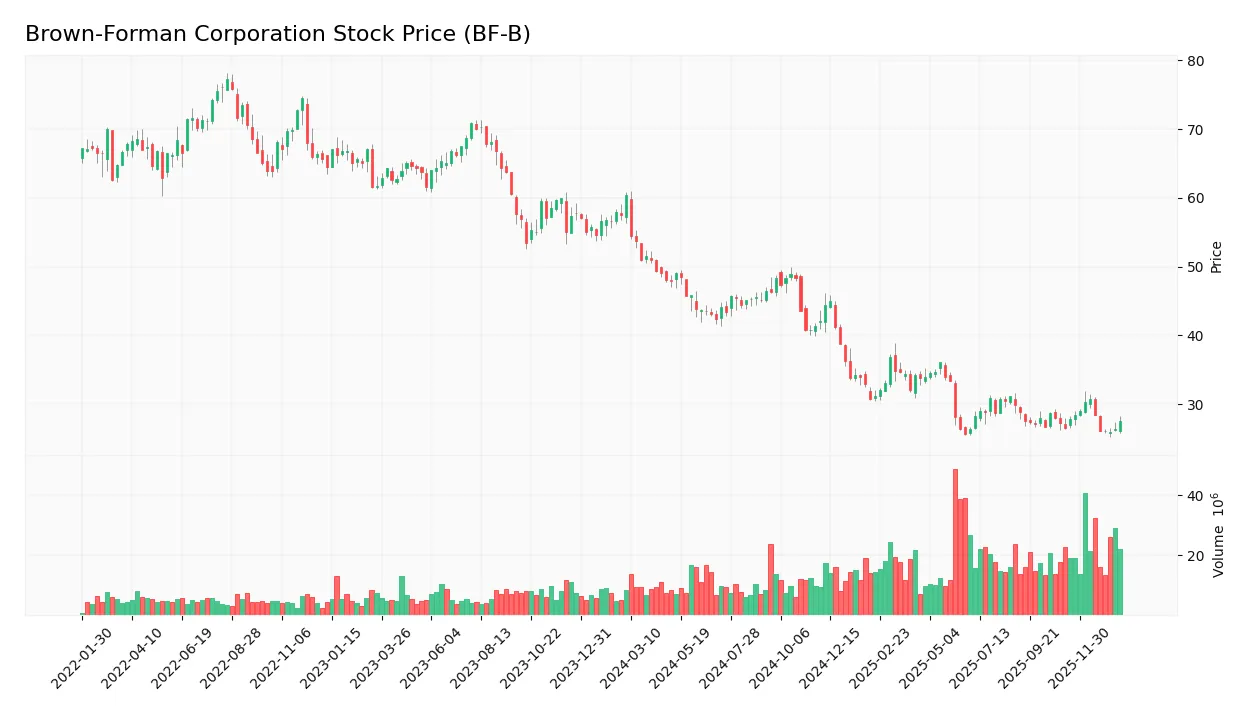
Trend Analysis
Over the past 12 months, BF-B’s stock price declined by 54.33%, indicating a bearish trend with accelerating downward momentum. The price fluctuated between a high of 60.37 and a low of 25.68, reflecting significant volatility with a standard deviation of 8.67. Recent weeks show a modest 3.65% price increase but with a slightly negative slope, suggesting a short-term neutral to mildly bearish trend.
Volume Analysis
Trading volume has been increasing overall, totaling approximately 1.69B shares traded. Sellers dominated with 56% of volume historically, but in the recent period from November 2025 to January 2026, buyer volume slightly surpassed sellers at 60%, indicating a somewhat buyer-driven market. This shift suggests improving investor interest and growing participation.
Target Prices
No verified target price data is available from recognized analysts for Brown-Forman Corporation (BF-B). Investors should monitor market developments and company performance for updated guidance.

Don’t Let Luck Decide Your Entry Point
Optimize your entry points with our advanced ProRealTime indicators. You’ll get efficient buy signals with precise price targets for maximum performance. Start outperforming now!
Analyst & Consumer Opinions
This section provides an overview of analyst ratings and consumer feedback related to Brown-Forman Corporation (BF-B).
Stock Grades
Here is the latest overview of Brown-Forman Corporation’s stock ratings from leading financial institutions:
| Grading Company | Action | New Grade | Date |
|---|---|---|---|
| Citigroup | Maintain | Sell | 2026-01-14 |
| Citigroup | Downgrade | Sell | 2025-12-17 |
| Evercore ISI Group | Maintain | In Line | 2025-12-05 |
| JP Morgan | Maintain | Underweight | 2025-12-05 |
| Barclays | Maintain | Overweight | 2025-11-28 |
| Needham | Maintain | Hold | 2025-10-16 |
| Barclays | Maintain | Overweight | 2025-10-07 |
| Barclays | Maintain | Overweight | 2025-09-02 |
| JP Morgan | Maintain | Underweight | 2025-09-02 |
| Needham | Maintain | Hold | 2025-08-29 |
Overall, the grades show a mixed sentiment with Citigroup notably downgrading to Sell, while Barclays consistently maintains an Overweight stance. The consensus remains a Hold, reflecting moderate caution among analysts.
Consumer Opinions
Consumers have expressed a mix of enthusiasm and concerns about Brown-Forman Corporation, reflecting varied experiences with the brand.
| Positive Reviews | Negative Reviews |
|---|---|
| “Brown-Forman offers consistently high-quality spirits with excellent flavor profiles.” | “Pricing is on the higher side compared to competitors.” |
| “Strong brand heritage and reliable product availability worldwide.” | “Some products have limited innovation and variety.” |
| “Customer service is responsive and helpful with order issues.” | “Occasional delays in shipping and distribution noted.” |
Overall, consumers appreciate Brown-Forman’s quality and brand reliability, though some highlight pricing and product innovation as areas for improvement. Shipping logistics also appear to be a recurring concern.
Risk Analysis
Below is a summary table presenting key risk categories, their descriptions, probabilities, and potential impacts for Brown-Forman Corporation (BF-B):
| Category | Description | Probability | Impact |
|---|---|---|---|
| Market Volatility | Fluctuations in consumer demand for alcoholic beverages due to economic cycles and trends. | Medium | High |
| Regulatory Changes | Changes in alcohol laws, taxes, or import/export restrictions affecting operations globally. | Medium | High |
| Supply Chain Disruptions | Interruptions in raw materials or logistics impacting production and distribution. | Medium | Medium |
| Competition | Increasing competition from craft distilleries and alternative beverage producers. | High | Medium |
| Currency Fluctuation | Exchange rate volatility impacting international revenue and costs. | Medium | Medium |
| Financial Leverage | Moderate debt levels could pose risk if interest rates rise or earnings decline. | Low | Medium |
The most significant risks for Brown-Forman are regulatory changes and market volatility, which could substantially affect revenue given the company’s global footprint and consumer sensitivity. Their strong financial health, including a safe Altman Z-Score (~4.0) and a robust Piotroski Score (7), helps mitigate these risks but does not eliminate exposure to external factors.
Should You Buy Brown-Forman Corporation?
Brown-Forman Corporation appears to be a profitable company with robust operational efficiency and a slightly favorable competitive moat despite a declining ROIC trend. Its leverage profile could be seen as moderate, while the overall rating suggests a very favorable investment profile with cautious optimism.
Strength & Efficiency Pillars
Brown-Forman Corporation exhibits solid profitability with a net margin of 21.86% and a return on equity (ROE) of 21.76%, signaling strong operational efficiency. Its return on invested capital (ROIC) stands at 12.16%, comfortably exceeding the weighted average cost of capital (WACC) at 5.4%, confirming the company as a clear value creator. Financial health indicators reinforce this profile: an Altman Z-Score of 3.99 places it well within the safe zone, and a Piotroski score of 7 denotes strong financial strength. These pillars collectively underscore Brown-Forman’s capacity to generate sustainable shareholder value.
Weaknesses and Drawbacks
Despite its strengths, Brown-Forman faces notable headwinds. The price-to-book ratio is elevated at 4.12, reflecting a premium valuation that may constrain upside potential. The current ratio of 3.88 is flagged as unfavorable, suggesting possible inefficiencies in working capital management or excess liquidity that could weigh on returns. Additionally, the stock has endured a severe bearish trend with a -54.33% price decline overall, though recent periods show slight buyer dominance at 59.87%. These factors introduce valuation and market pressure risks that investors should weigh carefully.
Our Verdict about Brown-Forman Corporation
Brown-Forman’s long-term fundamental profile appears favorable due to its strong profitability and financial health, supported by value creation through ROIC exceeding WACC. However, the pronounced bearish stock trend and recent market volatility suggest caution. Despite slight recent buyer dominance, investors might view this as a signal to monitor for a more opportune entry point rather than immediate exposure. Overall, the company’s profile may appear attractive for patient investors but could warrant a measured approach given current market dynamics.
Disclaimer: This content is for informational purposes only and does not constitute financial, investment, or other professional advice. Investing in financial markets involves a significant risk of loss, and past performance is not indicative of future results.
Additional Resources
- Brown-Forman Advances on Strong Brands and Premiumization – Yahoo Finance (Jan 21, 2026)
- Brown-Forman (BF.B) Valuation Check As Q3 Earnings And Premiumization Plans Draw Investor Attention – simplywall.st (Jan 23, 2026)
- What to Expect From Brown-Forman’s Next Quarterly Earnings Report – Barchart.com (Jan 22, 2026)
- Brown-Forman Corporation: Rating Downgrade To Sell On Worsening Demand Conditions – Seeking Alpha (Jan 09, 2026)
- Why Brown-Forman (BF.B) Stock Is Trading Up Today – Finviz (Jan 14, 2026)
For more information about Brown-Forman Corporation, please visit the official website: brown-forman.com