Home > Analyses > Financial Services > Brown & Brown, Inc.
Brown & Brown, Inc. connects millions to vital insurance solutions that protect their assets and livelihoods. As a powerhouse in the insurance brokerage sector, it leads with a diverse portfolio spanning retail, national programs, wholesale brokerage, and specialized services. Renowned for innovation and trusted expertise, it shapes risk management across multiple industries. The key question now: do its robust fundamentals support continued growth and a compelling valuation in 2026?

Table of contents
Business Model & Company Overview
Brown & Brown, Inc., founded in 1939 and headquartered in Daytona Beach, Florida, stands as a leading insurance broker in the financial services sector. It operates a cohesive ecosystem through four segments—Retail, National Programs, Wholesale Brokerage, and Services—offering a wide spectrum of insurance products and risk management solutions. This breadth positions Brown & Brown as a key intermediary connecting commercial, public, and individual clients with tailored insurance coverage and value-added services.
The company’s revenue engine balances commissions from property, casualty, and specialty insurance sales with recurring fees from outsourced claims and administrative services. Brown & Brown sustains a robust presence across the Americas, Bermuda, Canada, Europe, and the Cayman Islands, capitalizing on global demand. Its diversified service platform and strategic geographic reach create a durable economic moat, reinforcing its role in shaping the insurance brokerage industry’s future.
Financial Performance & Fundamental Metrics
I analyze Brown & Brown, Inc.’s income statement, key financial ratios, and dividend payout policy to gauge its profitability and shareholder value creation.
Income Statement
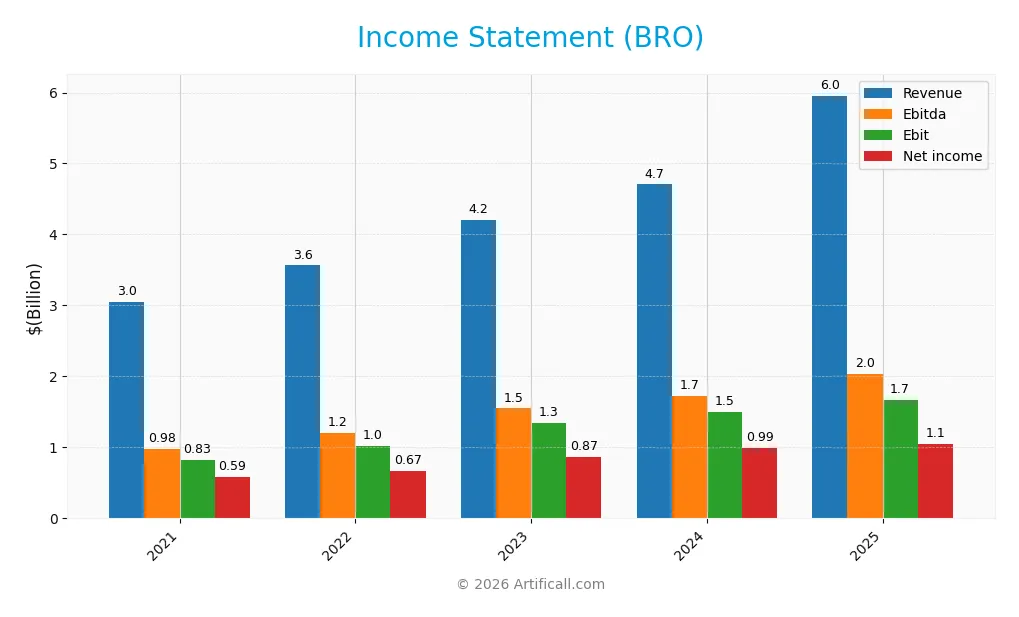
Below is the annual income statement for Brown & Brown, Inc. from 2021 to 2025, displaying key financial metrics in USD.
| 2021 | 2022 | 2023 | 2024 | 2025 | |
|---|---|---|---|---|---|
| Revenue | 3.05B | 3.56B | 4.20B | 4.71B | 5.96B |
| Cost of Revenue | 1.64B | 1.82B | 2.19B | 2.41B | 734M |
| Operating Expenses | 556M | 783M | 856M | 932M | 3.53B |
| Gross Profit | 1.41B | 1.75B | 2.01B | 2.30B | 5.22B |
| EBITDA | 981M | 1.21B | 1.55B | 1.73B | 2.04B |
| EBIT | 828M | 1.02B | 1.34B | 1.50B | 1.67B |
| Interest Expense | 65M | 148M | 197M | 201M | 297M |
| Net Income | 587M | 672M | 871M | 993M | 1.05B |
| EPS | 2.08 | 2.38 | 3.07 | 3.48 | 3.40 |
| Filing Date | 2022-02-23 | 2023-02-27 | 2024-02-22 | 2025-02-13 | 2026-02-12 |
Income Statement Evolution
Brown & Brown, Inc. grew revenue by 95% from 2021 to 2025, with a strong 26.6% jump in 2025 alone. Net income rose 80% over the period despite a slight 8% decline in net margin. Gross margin remained robust near 88%, while EBIT margin improved to 28%, reflecting operational efficiency despite rising expenses.
Is the Income Statement Favorable?
In 2025, revenue reached $5.96B with net income at $1.05B, yielding a favorable 17.7% net margin. EBITDA of $2.04B and EBIT of $1.67B support solid profitability. However, net margin and EPS declined year-over-year, signaling margin pressures. Interest expenses remained well-controlled at under 5% of revenue, balancing growth with prudent cost management. Overall, fundamentals appear favorable.
Financial Ratios
The table below summarizes key financial ratios for Brown & Brown, Inc. over the last five fiscal years, providing insight into profitability, liquidity, leverage, and market valuation:
| Ratios | 2021 | 2022 | 2023 | 2024 | 2025 |
|---|---|---|---|---|---|
| Net Margin | 19% | 19% | 20% | 21% | 18% |
| ROE | 14.0% | 14.6% | 15.6% | 15.4% | 8.4% |
| ROIC | 9.1% | 7.6% | 8.3% | 9.1% | 5.9% |
| P/E | 33.0 | 23.6 | 22.9 | 29.0 | 23.4 |
| P/B | 4.62 | 3.44 | 3.58 | 4.47 | 1.97 |
| Current Ratio | 1.25 | 1.09 | 1.04 | 1.10 | 1.04 |
| Quick Ratio | 1.25 | 1.09 | 1.04 | 1.10 | 1.04 |
| D/E | 0.54 | 0.91 | 0.72 | 0.63 | 0.64 |
| Debt-to-Assets | 23% | 30% | 27% | 23% | 27% |
| Interest Coverage | 13.1 | 6.5 | 5.9 | 6.8 | 5.7 |
| Asset Turnover | 0.31 | 0.25 | 0.28 | 0.27 | 0.20 |
| Fixed Asset Turnover | 7.45 | 7.83 | 8.95 | 9.07 | 9.36 |
| Dividend Yield | 0.55% | 0.76% | 0.68% | 0.54% | 0.79% |
Evolution of Financial Ratios
From 2021 to 2025, Brown & Brown’s current ratio slightly declined from 1.25 to 1.04, showing reduced liquidity but still near one-to-one coverage. Debt-to-equity rose moderately from 0.54 to 0.64, indicating a cautious increase in leverage. Return on equity dropped significantly from 14%+ to 8.4%, reflecting a slowdown in profitability despite stable margins.
Are the Financial Ratios Favorable?
In 2025, profitability ratios present a mixed picture: net margin is favorable at 17.7%, but ROE is unfavorable at 8.4%. Liquidity remains generally neutral to favorable, with a quick ratio just above 1. Leverage appears neutral, with debt-to-equity at 0.64 and debt-to-assets favorable at 27%. Asset turnover is weak, while fixed asset turnover is strong. Dividend yield is low and unfavorable. Overall, ratios are slightly favorable.
Shareholder Return Policy
Brown & Brown, Inc. maintains a consistent dividend payout ratio around 18%, with dividends per share increasing from $0.39 in 2021 to $0.63 in 2025. The annual dividend yield remains modest near 0.78%, supported by free cash flow coverage and occasional share buybacks.
This payout approach reflects balanced capital allocation, avoiding excessive distributions or repurchases. The policy supports sustainable long-term shareholder value by aligning dividends with underlying cash generation and prudent financial leverage.
Score analysis
The following radar chart illustrates the company’s scores across key financial metrics for 2026:
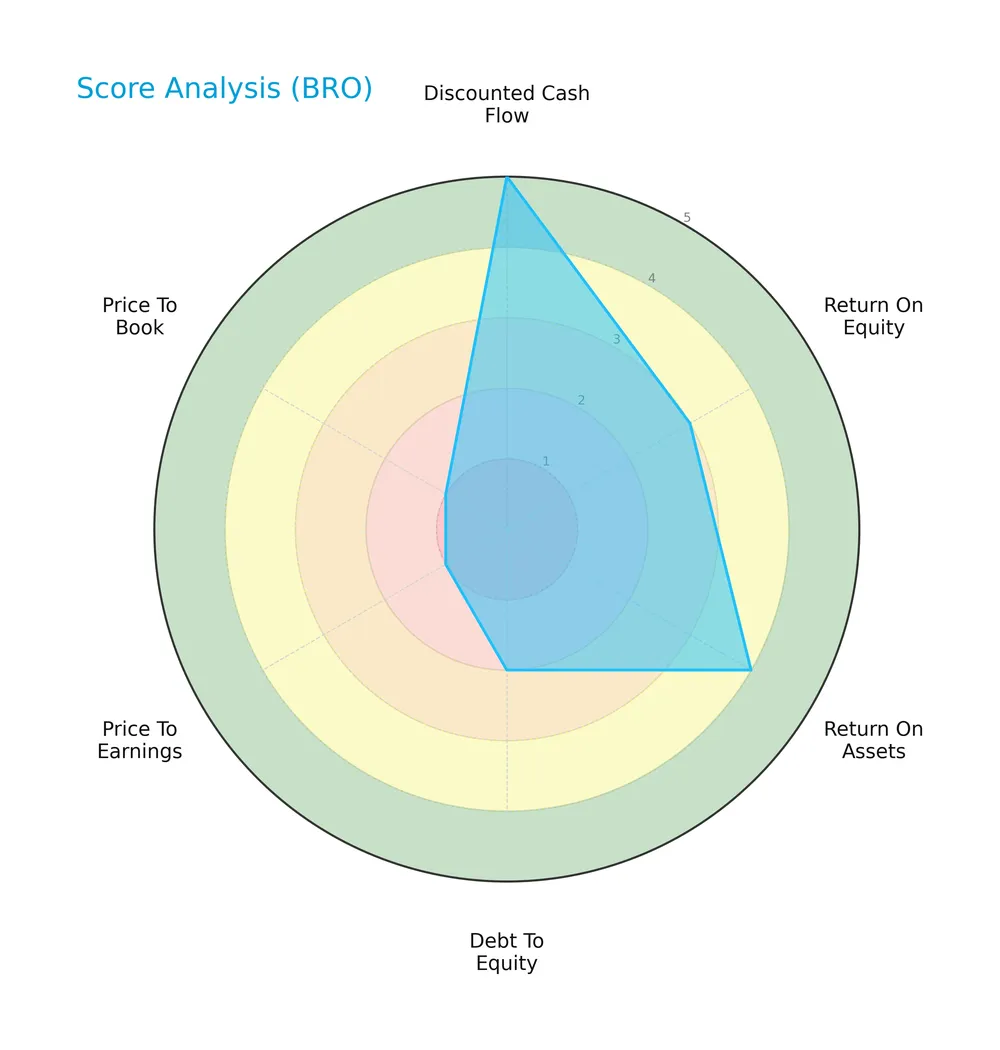
Brown & Brown displays a very favorable discounted cash flow score of 5, indicating strong intrinsic value. Return on equity and assets scores stand at moderate and favorable levels, respectively. However, debt-to-equity, price-to-earnings, and price-to-book scores are weak, raising concerns about leverage and valuation.
Analysis of the company’s bankruptcy risk
The Altman Z-Score places Brown & Brown in the distress zone, signaling a heightened bankruptcy risk based on its financial ratios:

Is the company in good financial health?
The Piotroski Score diagram provides insight into Brown & Brown’s overall financial condition:

With a Piotroski Score of 5, the company’s financial health is average. This suggests moderate strength in profitability, leverage, liquidity, and operational efficiency, without clear indications of either strong resilience or significant weakness.
Competitive Landscape & Sector Positioning
This sector analysis examines Brown & Brown, Inc.’s strategic positioning, revenue segments, and main competitors. I will assess whether the company holds a competitive advantage within the insurance brokerage industry.
Strategic Positioning
Brown & Brown, Inc. maintains a diversified product portfolio across Retail, National Programs, Wholesale Brokerage, and Services segments. Geographically, it concentrates primarily in the United States, with smaller but growing exposures in the United Kingdom, Ireland, and Canada.
Revenue by Segment
This pie chart displays Brown & Brown, Inc.’s revenue distribution by segment for the fiscal year 2024, highlighting the relative size of Programs, Retail, and Wholesale Brokerage.
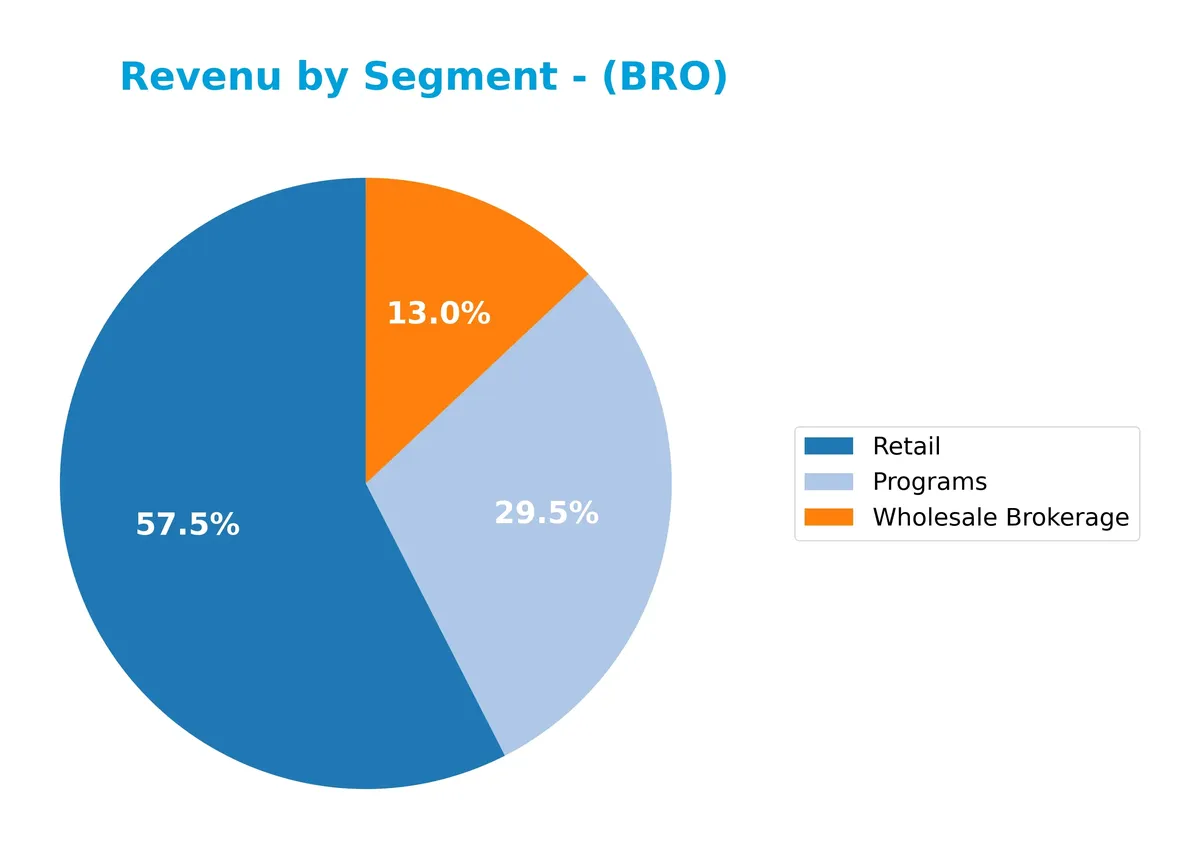
In 2024, Retail leads with $2.73B, followed by Programs at $1.4B and Wholesale Brokerage at $616M. Retail steadily expands its dominance since 2011, reflecting strong client demand. Programs show solid growth, indicating effective capital allocation. Wholesale Brokerage grows slower but remains a steady contributor. The 2024 figures suggest continued concentration in Retail, posing moderate concentration risk but signaling robust segment leadership.
Key Products & Brands
The table below details Brown & Brown, Inc.’s key products and brand segments with their core offerings:
| Product | Description |
|---|---|
| Retail | Property, casualty, employee benefits, personal, and specialties insurance; loss control, consultancy, and claims processing. |
| National Programs | Professional liability and package insurance for specialized professions; outsourced underwriting, marketing, and compliance. |
| Wholesale Brokerage | Excess and surplus commercial and personal lines insurance sold through independent agents and brokers. |
| Services | Third-party claims administration, medical management, Medicare advocacy, and claims adjusting in workers’ compensation and liability. |
Brown & Brown’s portfolio spans diverse insurance products and administrative services. Retail segment dominates revenue, supported by growing National Programs and Wholesale Brokerage lines. Services complement with niche claims management expertise.
Main Competitors
There are 6 competitors in total, with the table below listing the top 10 leaders by market capitalization:
| Competitor | Market Cap. |
|---|---|
| Marsh & McLennan Companies, Inc. | 89.8B |
| Aon plc | 74.4B |
| Arthur J. Gallagher & Co. | 65.7B |
| Willis Towers Watson Public Limited Company | 32.3B |
| Brown & Brown, Inc. | 26.5B |
| Erie Indemnity Company | 12.8B |
Brown & Brown, Inc. ranks 5th among its 6 competitors. Its market cap is 26% of the sector leader’s. The company sits below both the average market cap of the top 10 (50.3B) and the median sector market cap (49.0B). It maintains a 36% gap above its closest rival, highlighting a significant but not insurmountable distance.
Comparisons with competitors
Check out how we compare the company to its competitors:
Does BRO have a competitive advantage?
Brown & Brown, Inc. does not currently exhibit a competitive advantage. Its return on invested capital (ROIC) trails its weighted average cost of capital (WACC), signaling value destruction and declining profitability over 2021-2025.
Looking ahead, BRO benefits from diversified insurance segments across key markets like the US, UK, Canada, and Ireland. Its broad product mix and international presence offer opportunities to capture growth through new programs and services.
SWOT Analysis
This SWOT analysis highlights Brown & Brown, Inc.’s strategic position by examining internal strengths and weaknesses alongside external opportunities and threats.
Strengths
- Strong revenue growth of 26.6% in 1 year
- Diverse insurance segment coverage
- Favorable net margin at 17.7%
Weaknesses
- Declining ROIC indicating value erosion
- Moderate current ratio at 1.04 signals liquidity caution
- Negative net margin growth over the period
Opportunities
- Expansion in international markets like UK and Ireland
- Growing demand for cyber liability insurance
- Outsourcing opportunities in claims administration
Threats
- Intense competition in insurance brokerage
- Regulatory changes impacting underwriting
- Economic downturn reducing premium volumes
Brown & Brown’s robust revenue growth and diverse portfolio create a solid base. Yet, declining profitability metrics and liquidity signals urge strategic focus on operational efficiency and risk management. The company must capitalize on international expansion and niche insurance products while guarding against regulatory and market headwinds.
Stock Price Action Analysis
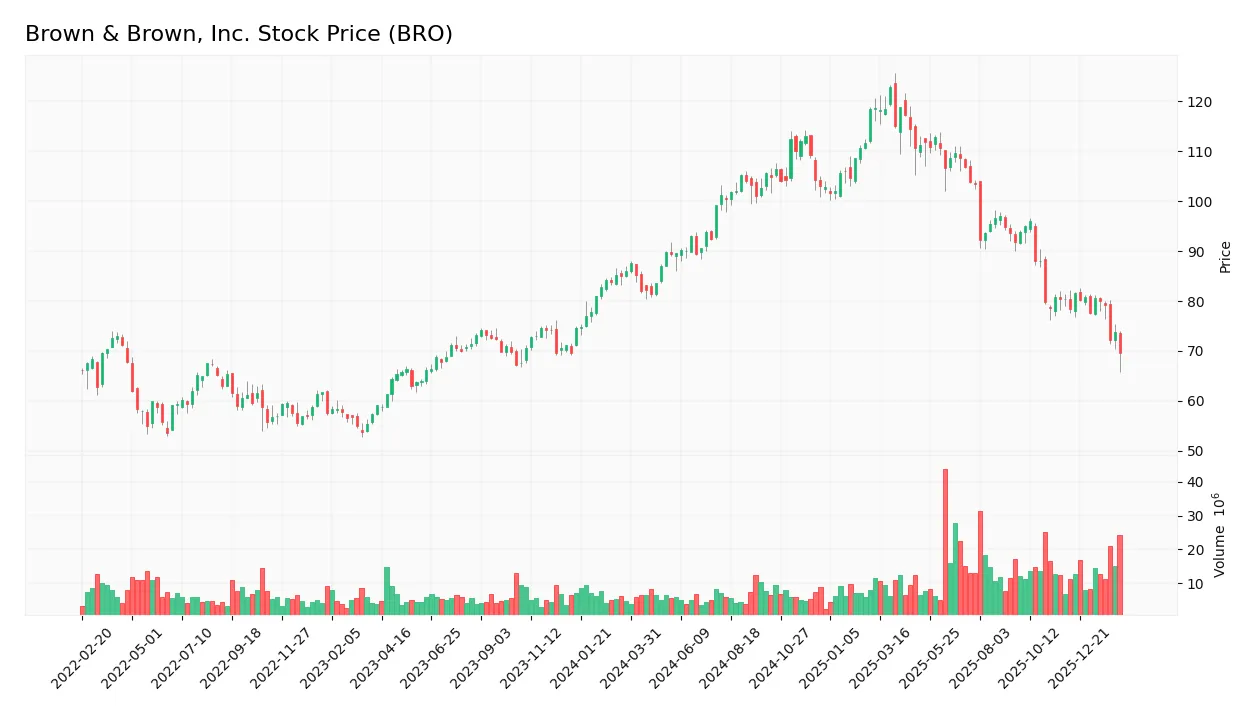
The following weekly stock chart illustrates Brown & Brown, Inc.’s price fluctuations and key levels over the past 12 months:
Trend Analysis
Over the past 12 months, Brown & Brown’s stock price declined 19.15%, confirming a bearish trend. This downtrend shows deceleration, suggesting a slowing pace of decline. Price volatility remains elevated with a 12.72 standard deviation. The stock peaked at 122.93 and bottomed at 69.53 during this period.
Volume Analysis
Trading volumes have increased overall, with sellers dominating at 64.87% in the recent three months. This seller-driven activity reflects cautious or pessimistic investor sentiment and suggests reduced buying interest amid the bearish trend.
Target Prices
Analysts present a narrow and confident target price range for Brown & Brown, Inc.
| Target Low | Target High | Consensus |
|---|---|---|
| 88 | 89 | 88.5 |
The tight spread between 88 and 89 suggests strong conviction in the stock’s valuation, reflecting steady market expectations.

Don’t Let Luck Decide Your Entry Point
Optimize your entry points with our advanced ProRealTime indicators. You’ll get efficient buy signals with precise price targets for maximum performance. Start outperforming now!
Analyst & Consumer Opinions
This section examines the latest analyst ratings and consumer feedback regarding Brown & Brown, Inc. (BRO).
Stock Grades
Here are the latest verified analyst grades for Brown & Brown, Inc., reflecting recent consensus and changes:
| Grading Company | Action | New Grade | Date |
|---|---|---|---|
| UBS | Maintain | Neutral | 2026-01-29 |
| Keefe, Bruyette & Woods | Upgrade | Market Perform | 2026-01-29 |
| Morgan Stanley | Maintain | Equal Weight | 2026-01-29 |
| BMO Capital | Maintain | Market Perform | 2026-01-29 |
| Mizuho | Maintain | Neutral | 2026-01-28 |
| Jefferies | Maintain | Hold | 2026-01-28 |
| Citigroup | Downgrade | Neutral | 2026-01-28 |
| Wells Fargo | Maintain | Equal Weight | 2026-01-28 |
| Truist Securities | Maintain | Buy | 2026-01-28 |
| B of A Securities | Maintain | Neutral | 2026-01-27 |
The overall trend reveals broad stability with most firms maintaining neutral or hold ratings. A notable upgrade by Keefe, Bruyette & Woods contrasts with Citigroup’s downgrade, highlighting mixed views within the market.
Consumer Opinions
Consumers express a mix of admiration and frustration with Brown & Brown, Inc., reflecting its complex service landscape.
| Positive Reviews | Negative Reviews |
|---|---|
| Responsive customer service that resolves issues fast. | Occasional delays in claim processing reported. |
| Comprehensive insurance options tailored to needs. | Some find the pricing less competitive. |
| Knowledgeable agents who explain policies clearly. | Website navigation can be confusing for users. |
Overall, Brown & Brown earns praise for its attentive customer support and policy customization. However, customers frequently cite claims processing delays and digital platform challenges as areas needing improvement.
Risk Analysis
Below is a summary table of key risks facing Brown & Brown, Inc. as of 2026:
| Category | Description | Probability | Impact |
|---|---|---|---|
| Financial Health | Altman Z-Score indicates distress zone, signaling bankruptcy risk | High | High |
| Valuation | Low price-to-earnings and price-to-book scores suggest overvaluation risk | Medium | Medium |
| Profitability | Return on equity below WACC signals weak capital efficiency | Medium | Medium |
| Liquidity | Current ratio near 1.0 indicates tight short-term liquidity | Medium | Medium |
| Market Volatility | Beta below 1 reduces volatility but may limit upside | Low | Low |
The most pressing risk is the distressed Altman Z-Score of 1.51, implying serious financial strain and elevated bankruptcy probability. Despite solid net margins (17.7%), ROE (8.38%) lags behind the WACC (6.14%), reflecting modest capital returns. Valuation metrics reveal cautious investor sentiment, while liquidity remains just adequate. I recommend close monitoring of leverage and profitability trends.
Should You Buy Brown & Brown, Inc.?
Brown & Brown, Inc. appears to be a company with declining operational efficiency and a deteriorating moat, reflecting a challenging value creation profile. Despite manageable leverage, its overall financial health suggests a cautious B rating amid moderate distress signals.
Strength & Efficiency Pillars
Brown & Brown, Inc. posts a solid net margin of 17.7%, reflecting effective cost control and operational strength. The company maintains a favorable gross margin of 87.68% and an EBIT margin of 28.01%, underscoring robust profitability. However, its return on equity (ROE) at 8.38% is below ideal levels. The return on invested capital (ROIC) stands at 5.89%, slightly under its weighted average cost of capital (WACC) of 6.14%, indicating the company is currently not a value creator. Operational efficiency remains a relative bright spot despite this.
Weaknesses and Drawbacks
Brown & Brown is in financial distress, as shown by an Altman Z-Score of 1.51, signaling a heightened bankruptcy risk. This solvency red flag overshadows other metrics. The company also struggles with unfavorable valuation measures, including a high P/E ratio of 23.44 and a P/B ratio of 1.97, which suggest a stretched market price. Although debt-to-equity is moderate at 0.64, recent market dynamics reveal seller dominance with only 35.13% buyer volume, creating short-term pressure on the stock.
Our Final Verdict about Brown & Brown, Inc.
Despite operational profitability, Brown & Brown’s distressed financial health, highlighted by a critical Altman Z-Score, makes its investment profile highly speculative. The looming solvency risk outweighs moderate margins and revenue growth. Investors seeking capital preservation may find this profile too risky. Caution is advised until the company demonstrates clear improvements in financial stability.
Disclaimer: This content is for informational purposes only and does not constitute financial, investment, or other professional advice. Investing in financial markets involves a significant risk of loss, and past performance is not indicative of future results.
Additional Resources
- Brown University Shooting: Public Records – City of Providence (.gov) (Feb 09, 2026)
- Officials release new video footage from day of fatal Brown University shooting – PBS (Feb 09, 2026)
- Overlooked No More: Clifford Brown, Trumpeter Whose Brief Life Left a Lasting Mark – The New York Times (Feb 12, 2026)
- Legendary 90s rocker dead at 56 – News.com.au (Feb 10, 2026)
- Greg Brown, Cake founding guitarist who wrote breakout hit ‘The Distance,’ dead at 56 – Los Angeles Times (Feb 09, 2026)
For more information about Brown & Brown, Inc., please visit the official website: bbinsurance.com