Home > Analyses > Technology > Broadridge Financial Solutions, Inc.
Broadridge Financial Solutions powers the financial ecosystem by streamlining complex communications and transaction processes. Its technology underpins investor communications, proxy voting, and capital markets operations, shaping how millions of investors engage with their assets daily. Renowned for innovation and operational excellence, Broadridge commands a vital role in financial services infrastructure. As market dynamics evolve, I explore whether Broadridge’s robust fundamentals justify its current valuation and long-term growth prospects.

Table of contents
Business Model & Company Overview
Broadridge Financial Solutions, Inc., founded in 1962 and headquartered in Lake Success, NY, dominates the financial technology services sector. It operates a core business ecosystem that integrates investor communications with technology-driven solutions, streamlining proxy materials, regulatory reports, and mutual fund trade processing. With 14K employees, it supports a seamless flow of information essential to equity securities and mutual funds.
The company’s revenue engine balances software platforms like ProxyEdge with comprehensive global operations, automating transaction lifecycles across Americas, Europe, and Asia. Its mix of recurring services and technology solutions powers client engagement and regulatory compliance. Broadridge’s competitive advantage lies in its entrenched market position and the scalability of its end-to-end communication and transaction platforms, securing a durable economic moat in financial services infrastructure.
Financial Performance & Fundamental Metrics
I analyze Broadridge Financial Solutions, Inc.’s income statement, key financial ratios, and dividend payout policy to assess its core profitability and shareholder returns.
Income Statement
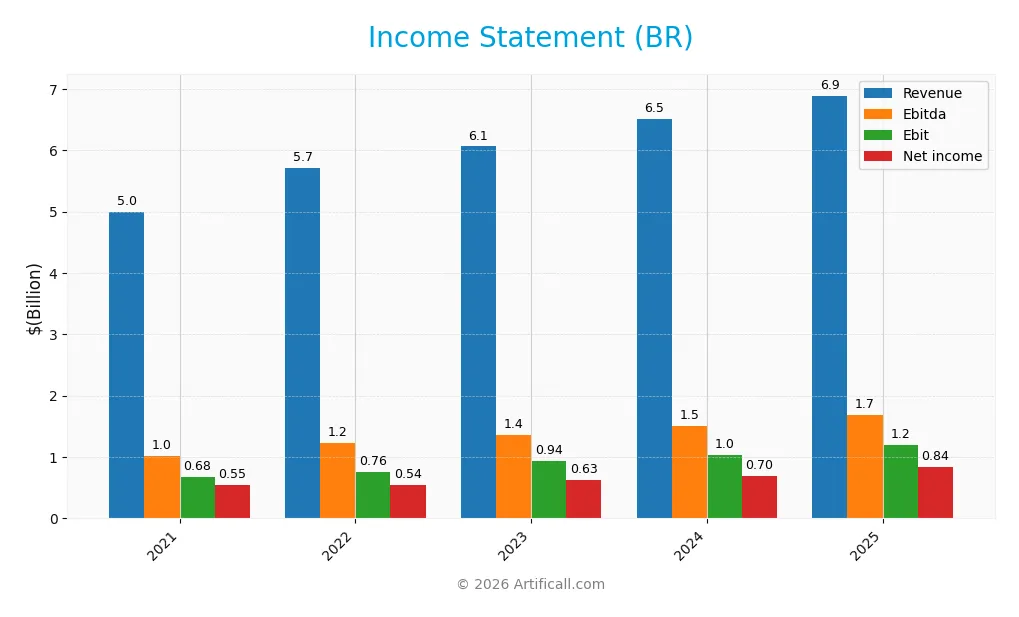
This table presents Broadridge Financial Solutions, Inc.’s annual income statement figures from 2021 to 2025 in USD, offering a clear view of revenue, expenses, and profitability trends.
| 2021 | 2022 | 2023 | 2024 | 2025 | |
|---|---|---|---|---|---|
| Revenue | 4.99B | 5.71B | 6.06B | 6.51B | 6.89B |
| Cost of Revenue | 3.57B | 4.12B | 4.28B | 4.57B | 4.75B |
| Operating Expenses | 744M | 832M | 849M | 917M | 948M |
| Gross Profit | 1.42B | 1.59B | 1.79B | 1.93B | 2.14B |
| EBITDA | 1.01B | 1.22B | 1.36B | 1.51B | 1.69B |
| EBIT | 679M | 760M | 936M | 1.03B | 1.19B |
| Interest Expense | 57.5M | 87.7M | 143.7M | 150.2M | 135.8M |
| Net Income | 547M | 539M | 631M | 698M | 840M |
| EPS | 4.73 | 4.62 | 5.36 | 5.93 | 7.17 |
| Filing Date | 2021-08-12 | 2022-08-12 | 2023-08-08 | 2024-08-06 | 2025-08-05 |
Income Statement Evolution
Broadridge Financial Solutions shows steady revenue growth, rising 38% from 2021 to 2025. Net income expanded even faster, up 53%, reflecting improving operational efficiency. Gross margin improved to 31%, supported by disciplined cost control. EBIT and net margins also increased, signaling better profitability over the period with a notable 13.6% net margin growth in the last year.
Is the Income Statement Favorable?
In 2025, fundamentals appear strong. Revenue rose 5.9% year-over-year with gross profit up 10.5%. Operating expenses grew in line with revenue, preserving margin gains. EBIT margin reached 17.3%, and net margin stood at 12.2%. Interest expense remains low relative to revenue. Overall, the income statement exhibits robust growth and margin improvement, indicating favorable financial health.
Financial Ratios
The following table summarizes key financial ratios for Broadridge Financial Solutions, Inc. over the fiscal years 2021 to 2025:
| Ratios | 2021 | 2022 | 2023 | 2024 | 2025 |
|---|---|---|---|---|---|
| Net Margin | 11.0% | 9.4% | 10.4% | 10.7% | 12.2% |
| ROE | 30.3% | 28.1% | 28.1% | 32.2% | 31.6% |
| ROIC | 7.8% | 8.8% | 10.5% | 11.8% | 13.1% |
| P/E | 34.1 | 30.9 | 30.9 | 33.1 | 33.9 |
| P/B | 10.3 | 8.7 | 8.7 | 10.7 | 10.7 |
| Current Ratio | 0.98 | 1.01 | 0.58 | 1.08 | 0.98 |
| Quick Ratio | 0.98 | 1.01 | 0.57 | 1.06 | 0.98 |
| D/E | 2.32 | 2.12 | 1.63 | 1.65 | 1.30 |
| Debt-to-Assets | 51.6% | 44.4% | 44.4% | 43.4% | 40.5% |
| Interest Coverage | 11.8x | 8.7x | 6.5x | 6.8x | 8.8x |
| Asset Turnover | 0.62 | 0.70 | 0.74 | 0.79 | 0.81 |
| Fixed Asset Turnover | 11.4 | 15.3 | 41.6 | 18.7 | 19.9 |
| Dividend Yield | 1.40% | 1.75% | 1.70% | 1.59% | 1.41% |
Evolution of Financial Ratios
Return on Equity (ROE) showed a gradual improvement, rising from 28.1% in 2022 to 31.6% in 2025. The Current Ratio declined from above 1.0 in earlier years to 0.98 in 2025, indicating a slight liquidity squeeze. Debt-to-Equity Ratio decreased notably from 2.3 in 2021 to 1.3 in 2025, reflecting reduced leverage and improved capital structure stability.
Are the Financial Ratios Favorable?
Profitability ratios such as ROE (31.6%) and Return on Invested Capital (13.1%) are favorable, outperforming typical sector benchmarks. Liquidity metrics show mixed signals; the Current Ratio is unfavorable at 0.98, while the Quick Ratio is neutral. Leverage remains somewhat high with a Debt-to-Equity of 1.3, flagged as unfavorable. Valuation multiples like P/E (33.9) and P/B (10.7) appear stretched. Overall, the financial ratios are slightly favorable but warrant cautious interpretation.
Shareholder Return Policy
Broadridge Financial Solutions maintains a consistent dividend payout ratio near 48%, with dividends per share increasing steadily to $3.44 in 2025. The annual yield hovers around 1.4%, supported by free cash flow coverage and moderate share buybacks, reflecting balanced capital allocation.
This distribution approach appears sustainable, given the company’s solid operating margins and cash flow generation. However, the payout ratio near 50% warrants monitoring to avoid pressure on future dividends amid potential earnings volatility.
Score analysis
Here is a radar chart illustrating Broadridge Financial Solutions, Inc.’s key financial metric scores:
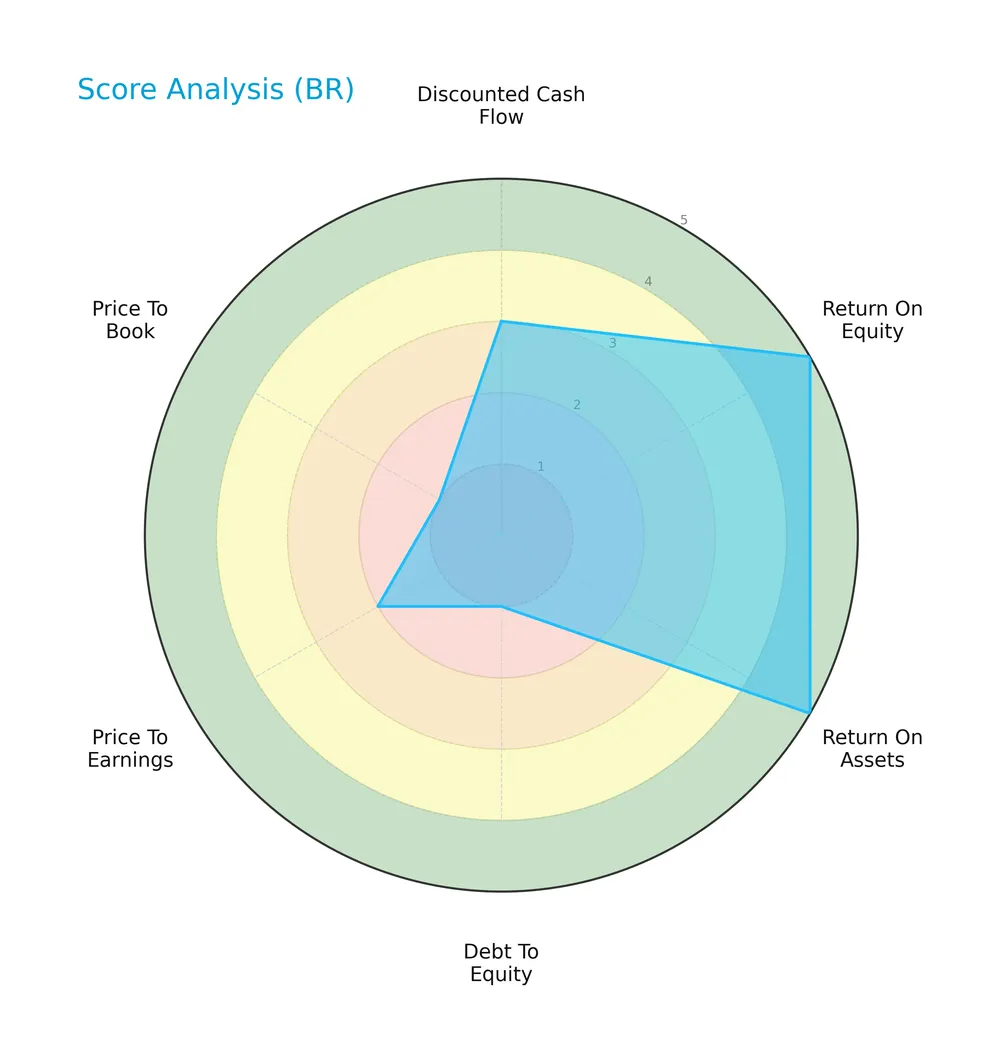
The company scores very favorably on return on equity and assets, reflecting solid profitability. However, its debt-to-equity and price-to-book scores are very unfavorable, indicating potential leverage risks and valuation concerns. Other metrics fall in the moderate range.
Analysis of the company’s bankruptcy risk
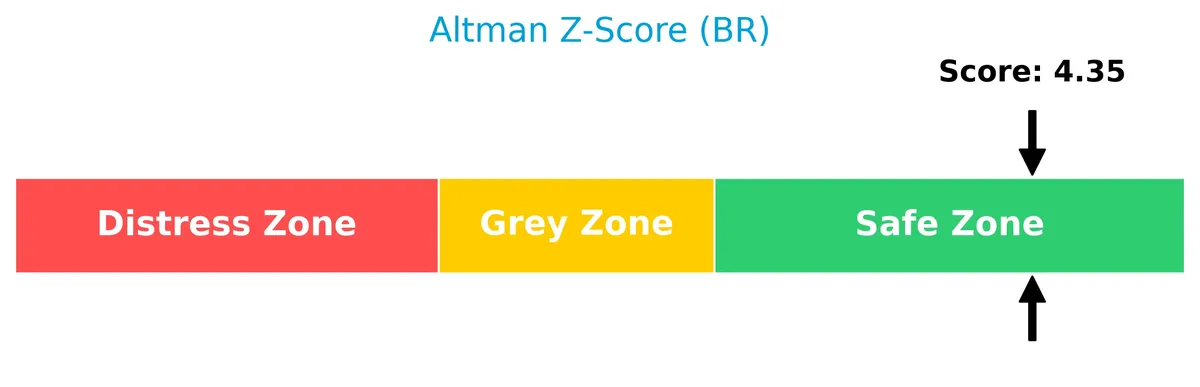
Broadridge’s Altman Z-Score places it firmly in the safe zone, signaling a low risk of bankruptcy:
Is the company in good financial health?
The Piotroski Score diagram highlights the company’s strong financial health status:

With a Piotroski Score of 7, the company demonstrates strong fundamentals, indicating effective profitability, liquidity, and operational efficiency relative to peers.
Competitive Landscape & Sector Positioning
This sector analysis examines Broadridge Financial Solutions, Inc.’s strategic positioning, revenue segments, and key products. It also reviews the company’s main competitors and competitive advantages within the technology industry. I will assess whether Broadridge holds a sustainable competitive advantage over its peers.
Strategic Positioning
Broadridge Financial Solutions focuses on a concentrated product portfolio centered on investor communication and technology-driven financial services. Its geographic exposure is primarily in the US, with significant revenues also from Canada and the UK, reflecting a North American and European regional emphasis.
Revenue by Segment
This pie chart illustrates Broadridge Financial Solutions’ revenue distribution by segment for fiscal year 2025, highlighting the company’s core business drivers.
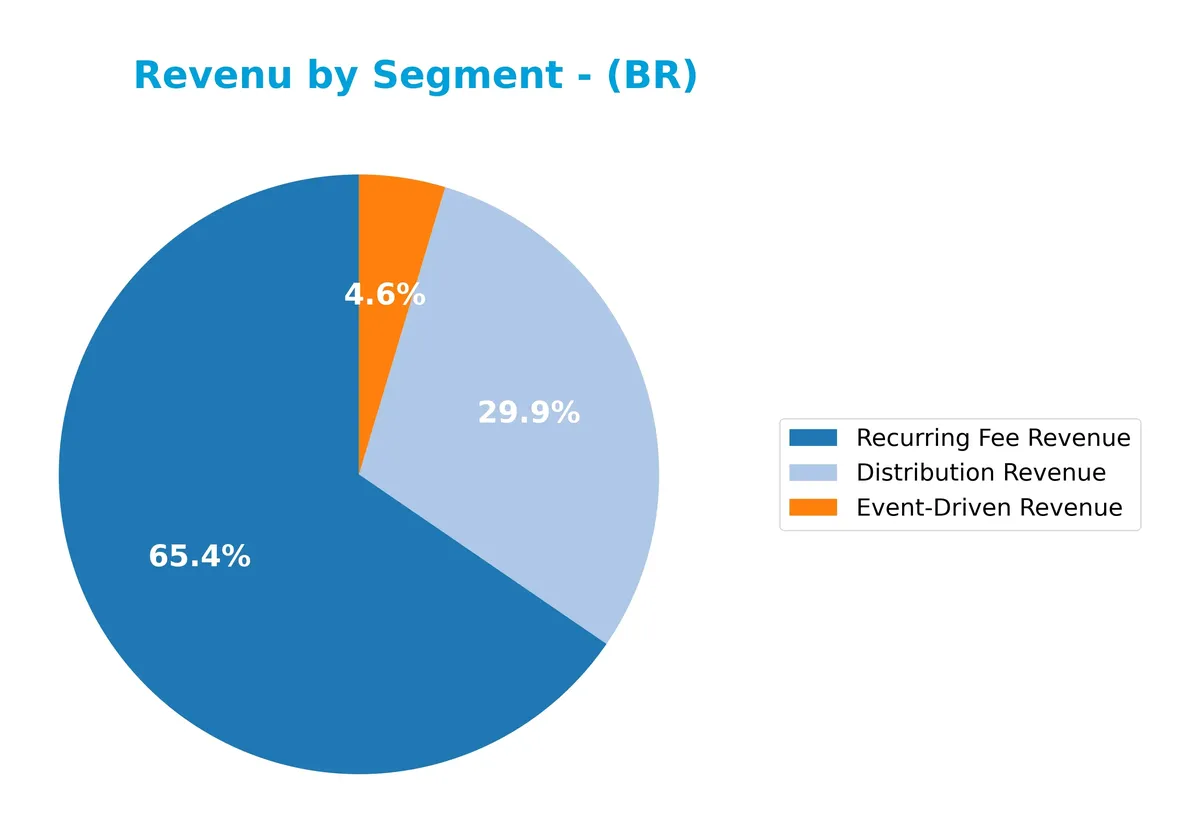
In 2025, Recurring Fee Revenue dominates at 4.51B, signaling strong subscription-based income. Distribution Revenue follows with 2.06B, showing steady growth over recent years. Event-Driven Revenue, while smaller at 319M, also increased. The trend reflects a solid shift toward predictable, recurring revenues, reducing concentration risk and enhancing stability in Broadridge’s business model.
Key Products & Brands
The following table summarizes Broadridge Financial Solutions’ primary products and brands by function and service area:
| Product | Description |
|---|---|
| Investor Communication Solutions | Processes and distributes proxy materials, regulatory reports, class action notices, and tax reporting. Offers ProxyEdge electronic proxy delivery and omni-channel customer communications. |
| Global Technology and Operations | Automates transaction lifecycles across equities, fixed income, foreign exchange, and derivatives. Provides portfolio management, compliance, capital markets, and wealth management technology solutions. |
| Distribution Revenue | Revenue from distribution of proxy materials and related investor communications services. |
| Event-Driven Revenue | Income from corporate actions, reorganizations, and class action processing services. |
| Recurring Fee Revenue | Subscription and recurring fees from data-driven solutions, regulatory filings, and trade processing. |
Broadridge’s portfolio centers on investor communications and transaction automation. The firm leverages technology to serve financial services clients with recurring revenue streams and event-driven services, reflecting steady sector demand.
Main Competitors
There are 2 competitors in total, with the table below listing the top 10 leaders by market capitalization:
| Competitor | Market Cap. |
|---|---|
| Broadridge Financial Solutions, Inc. | 25.8B |
| Jacobs Solutions Inc. | 16.1B |
Broadridge Financial Solutions ranks 1st among its competitors. Its market cap is 88.2% of the top player’s scale, placing it above both the average market cap of the top 10 and the median market cap in its sector. The company leads Jacobs Solutions by a substantial 41.75% margin, highlighting a clear gap with its closest rival.
Comparisons with competitors
Check out how we compare the company to its competitors:
Does BR have a competitive advantage?
Broadridge Financial Solutions, Inc. demonstrates a sustainable competitive advantage with a very favorable moat, driven by a ROIC exceeding WACC by 5.3% and a strong upward ROIC trend of 68%. This indicates efficient capital use and consistent value creation over 2021-2025, underpinned by growing profitability and operational strength.
Looking ahead, Broadridge’s integrated technology-driven solutions and diverse financial services position it well for expansion in investor communications and capital markets. Opportunities in new markets and product innovations, such as the Broadridge Communications Cloud platform, support continued competitive strength and revenue growth prospects.
SWOT Analysis
This SWOT analysis highlights Broadridge Financial Solutions’ key internal and external factors shaping its strategic position.
Strengths
- strong ROIC exceeding WACC
- growing profitability trend
- diversified technology-driven financial solutions
Weaknesses
- high debt-to-equity ratio
- elevated P/E and P/B multiples
- current ratio below 1 signals liquidity risk
Opportunities
- expanding digital communications platform
- increasing demand for automated transaction lifecycle solutions
- growth potential in international markets
Threats
- competitive pressure from fintech disruptors
- regulatory changes impacting financial services
- macroeconomic uncertainties affecting client spending
Broadridge’s robust moat and profitability support a value-creating strategy. However, elevated leverage and valuation warrant caution. The company must leverage technological innovation and geographic expansion to offset competitive and regulatory risks.
Stock Price Action Analysis
The weekly stock chart shows Broadridge Financial Solutions, Inc.’s price movements over the past 12 months, highlighting key highs and lows:
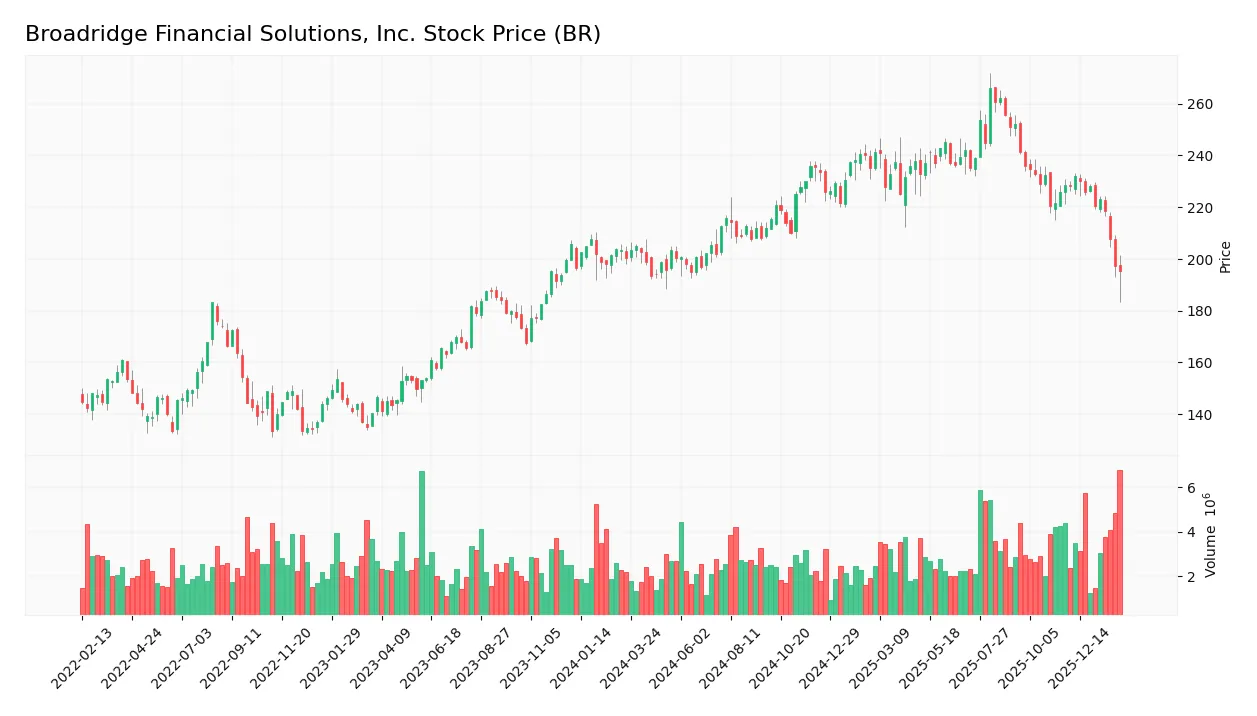
Trend Analysis
Over the past 12 months, BR’s stock price declined by 2.48%, indicating a bearish trend. The highest price reached 265.94, and the lowest was 193.38, with trend deceleration observed. Price volatility remains elevated, with a standard deviation of 17.35.
Volume Analysis
Trading volume is increasing overall, with sellers slightly dominating at 51.5%. In the recent three months, seller volume surged to 32.2M versus 12.2M buyers, signaling strong seller dominance and cautious investor sentiment.
Target Prices
Analysts set a clear target consensus for Broadridge Financial Solutions, Inc., reflecting moderate upside potential.
| Target Low | Target High | Consensus |
|---|---|---|
| 213 | 257 | 239.6 |
The target range from 213 to 257 suggests cautious optimism. The consensus price of 239.6 indicates steady growth expectations relative to current levels.

Don’t Let Luck Decide Your Entry Point
Optimize your entry points with our advanced ProRealTime indicators. You’ll get efficient buy signals with precise price targets for maximum performance. Start outperforming now!
Analyst & Consumer Opinions
This section examines Broadridge Financial Solutions, Inc.’s analyst ratings and consumer feedback to gauge market sentiment.
Stock Grades
Here are the latest verified grades for Broadridge Financial Solutions, Inc. from reputable analysts:
| Grading Company | Action | New Grade | Date |
|---|---|---|---|
| Needham | Maintain | Buy | 2026-02-04 |
| JP Morgan | Maintain | Neutral | 2026-02-04 |
| DA Davidson | Upgrade | Buy | 2026-02-04 |
| DA Davidson | Maintain | Neutral | 2026-01-23 |
| UBS | Maintain | Neutral | 2025-11-13 |
| Morgan Stanley | Maintain | Equal Weight | 2025-11-05 |
| DA Davidson | Maintain | Neutral | 2025-10-28 |
| UBS | Maintain | Neutral | 2025-08-08 |
| Morgan Stanley | Maintain | Equal Weight | 2025-08-06 |
| Needham | Maintain | Buy | 2025-08-06 |
The consensus leans toward a Buy rating, reflecting analyst confidence in the stock’s prospects. Most firms maintain neutral or buy stances, with DA Davidson recently upgrading to Buy, indicating a positive momentum shift.
Consumer Opinions
Broadridge Financial Solutions consistently earns praise for its reliability and client service, though some users note areas for improvement.
| Positive Reviews | Negative Reviews |
|---|---|
| “Broadridge’s platform is incredibly stable and user-friendly, making daily tasks seamless.” | “Customer support response times can be slow during peak periods.” |
| “Their reporting tools are accurate and help us make informed decisions quickly.” | “The pricing structure feels complex and occasionally expensive for smaller clients.” |
| “Integration with other financial software is smooth and efficient.” | “Some features lack customization options needed for specific workflows.” |
Overall, consumers value Broadridge’s dependable technology and insightful reporting. However, concerns about customer support speed and pricing complexity recur consistently.
Risk Analysis
Below is a table summarizing key risks facing Broadridge Financial Solutions, Inc., including their likelihood and potential impact:
| Category | Description | Probability | Impact |
|---|---|---|---|
| Valuation Risk | Elevated P/E and P/B ratios suggest the stock trades at a premium. | Medium | High |
| Liquidity Risk | Current ratio below 1.0 signals tight short-term liquidity. | High | Medium |
| Leverage Risk | Debt-to-equity ratio at 1.3 indicates significant reliance on debt. | Medium | Medium |
| Market Risk | Beta near 1 exposes the stock to broad market fluctuations. | High | Medium |
| Operational Risk | Dependence on financial services sector could be vulnerable to regulation. | Medium | Medium |
The most pressing risks are the tight liquidity and elevated valuation multiples. The current ratio below 1 is a red flag in my experience, especially during economic downturns when cash buffers matter most. Meanwhile, the P/E of 33.9 and P/B over 10 far exceed industry norms, raising caution about overvaluation. Despite solid profitability and a safe Altman Z-Score, these financial structure concerns warrant careful monitoring.
Should You Buy Broadridge Financial Solutions, Inc.?
Broadridge appears to be a robust value creator with a durable competitive moat, evidenced by growing ROIC well above WACC. While its leverage profile suggests substantial debt concerns, the overall financial health could be seen as very favorable, warranting a B rating.
Strength & Efficiency Pillars
Broadridge Financial Solutions, Inc. posts robust profitability with a net margin of 12.19% and a solid return on equity at 31.62%. Its return on invested capital (ROIC) stands at 13.05%, comfortably above the weighted average cost of capital (WACC) of 7.76%, confirming the company as a clear value creator. The Altman Z-Score of 4.35 places it firmly in the safe zone, while a Piotroski score of 7 signals strong financial health. These metrics underpin a sustainable competitive advantage and efficient capital allocation.
Weaknesses and Drawbacks
Despite these strengths, Broadridge faces valuation and liquidity concerns. The price-to-earnings ratio of 33.9 and price-to-book ratio of 10.72 indicate a premium valuation that may limit upside. The debt-to-equity ratio at 1.3 and a current ratio just under 1 (0.98) raise red flags on leverage and short-term liquidity, increasing financial risk. Furthermore, recent seller dominance—only 27.52% buyer activity—exerts downward pressure on the stock price, reflecting near-term market skepticism.
Our Verdict about Broadridge Financial Solutions, Inc.
The company’s long-term fundamentals appear favorable, driven by strong profitability and value creation. However, the current bearish technical trend and seller dominance suggest caution. Despite its robust financial health, Broadridge might appear better suited for investors seeking a disciplined entry point rather than immediate exposure. Patience may be warranted until market pressure subsides for a more opportune buy.
Disclaimer: This content is for informational purposes only and does not constitute financial, investment, or other professional advice. Investing in financial markets involves a significant risk of loss, and past performance is not indicative of future results.
Additional Resources
- Here’s Why Broadridge Financial (BR) is Poised for a Turnaround After Losing 13.4% in 4 Weeks – Finviz (Feb 05, 2026)
- Broadridge Financial Solutions, Inc. (BR): A Bull Case Theory – Yahoo Finance (Feb 03, 2026)
- DA Davidson Upgrades Broadridge Financial Solutions (BR) – Nasdaq (Feb 04, 2026)
- Broadridge Appoints Trish Mosconi and Chris Perry to its Board of Directors – PR Newswire (Feb 02, 2026)
- Analysts Offer Insights on Technology Companies: Broadridge Financial Solutions (BR), Apple (AAPL) and Teradyne (TER) – The Globe and Mail (Feb 05, 2026)
For more information about Broadridge Financial Solutions, Inc., please visit the official website: broadridge.com