Home > Analyses > Technology > Broadcom Inc.
Broadcom Inc. powers the backbone of modern connectivity, enabling everything from data center networks to smartphones and industrial automation. As a dominant force in the semiconductor industry, Broadcom’s innovative hardware and infrastructure software solutions set high standards for quality and performance worldwide. With a diverse product portfolio and a reputation for cutting-edge technology, the company continues to shape the future of digital communication. But does Broadcom’s current valuation truly reflect its growth prospects and fundamental strength?

Table of contents
Business Model & Company Overview
Broadcom Inc., founded in 2009 and headquartered in Palo Alto, California, stands as a dominant player in the semiconductor industry. With a workforce of 37,000, the company delivers a cohesive ecosystem spanning wired and wireless infrastructure, enterprise storage, and industrial solutions. Its products underpin a broad array of applications—from data centers and telecommunications to factory automation and alternative energy—integrating complex hardware and firmware to bridge analog and digital technologies.
The company’s revenue engine balances hardware components with infrastructure software, generating value across global markets including the Americas, Europe, and Asia. This diverse portfolio fuels a resilient and scalable business model, leveraging recurring services alongside product sales. Broadcom’s strategic positioning and technological breadth create a robust economic moat, securing its influence in shaping the future of semiconductor innovation.
Financial Performance & Fundamental Metrics
This section reviews Broadcom Inc.’s income statement, key financial ratios, and dividend payout policy to assess its overall financial health and stability.
Income Statement
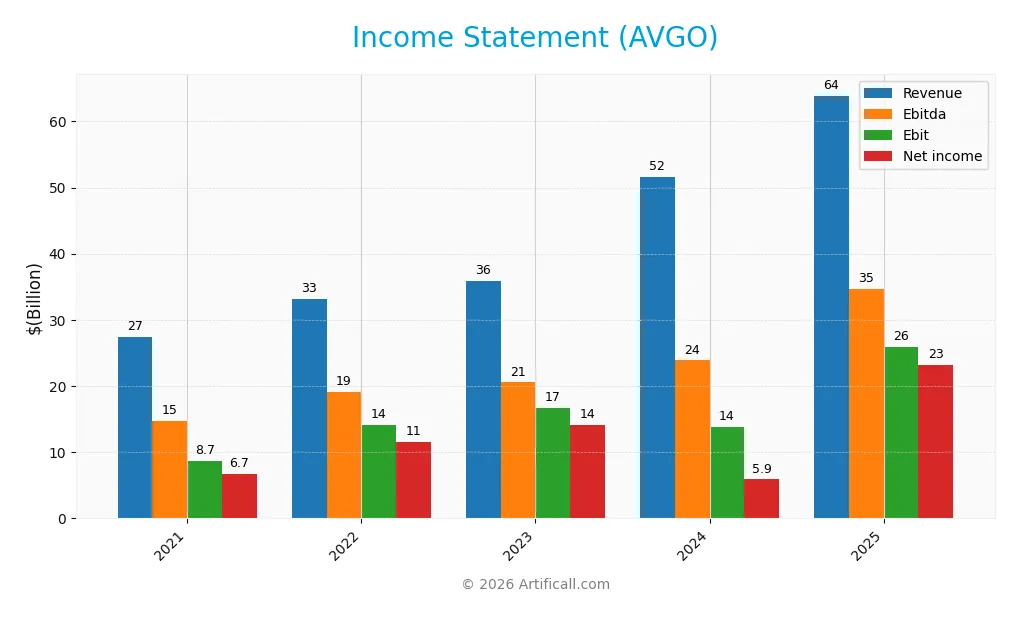
The table below presents Broadcom Inc.’s key income statement figures for the fiscal years 2021 through 2025, highlighting revenue, expenses, profitability, and earnings per share.
| 2021 | 2022 | 2023 | 2024 | 2025 | |
|---|---|---|---|---|---|
| Revenue | 27.45B | 33.20B | 35.82B | 51.57B | 63.89B |
| Cost of Revenue | 10.61B | 11.08B | 11.13B | 19.07B | 20.59B |
| Operating Expenses | 8.33B | 7.81B | 8.48B | 19.05B | 17.81B |
| Gross Profit | 16.84B | 22.10B | 24.69B | 32.51B | 43.29B |
| EBITDA | 14.69B | 19.16B | 20.55B | 23.88B | 34.71B |
| EBIT | 8.65B | 14.17B | 16.72B | 13.87B | 25.94B |
| Interest Expense | 1.88B | 1.74B | 1.62B | 3.95B | 3.21B |
| Net Income | 6.74B | 11.50B | 14.08B | 5.90B | 23.13B |
| EPS | 1.57 | 2.74 | 3.39 | 1.27 | 4.91 |
| Filing Date | 2021-12-17 | 2022-12-16 | 2023-12-14 | 2024-12-20 | 2025-12-18 |
Income Statement Evolution
Broadcom Inc. (AVGO) has shown strong growth in revenue and net income over the 2021-2025 period, with revenue rising 133% and net income increasing 243%. Margins have improved notably, with a gross margin of 67.77% and net margin at 36.2%, reflecting enhanced profitability and operational efficiency. EBIT margin also strengthened to 40.6%, indicating effective cost management alongside revenue expansion.
Is the Income Statement Favorable?
The 2025 fiscal year highlights Broadcom’s robust fundamentals, with revenue up 24% year-on-year and net income surging by 217%. Earnings per share rose sharply by 288%, supported by a favorable net margin expansion. Interest expenses remain neutral at 5% of revenue, not significantly impacting profitability. Overall, the income statement presents a favorable profile with solid growth and margin improvement, underscoring strong operational performance and financial health.
Financial Ratios
The following table presents key financial ratios for Broadcom Inc. (AVGO) over recent fiscal years, offering insights into profitability, valuation, liquidity, leverage, efficiency, and shareholder returns:
| Ratios | 2021 | 2022 | 2023 | 2024 | 2025 |
|---|---|---|---|---|---|
| Net Margin | 25% | 35% | 39% | 11% | 36% |
| ROE | 27% | 51% | 59% | 9% | 28% |
| ROIC | 12% | 20% | 23% | 6% | 16% |
| P/E | 32 | 17 | 25 | 132 | 74 |
| P/B | 8.7 | 8.5 | 14.6 | 11.5 | 21.0 |
| Current Ratio | 2.64 | 2.62 | 2.82 | 1.17 | 1.71 |
| Quick Ratio | 2.43 | 2.35 | 2.56 | 1.07 | 1.58 |
| D/E | 1.61 | 1.76 | 1.65 | 1.00 | 0.80 |
| Debt-to-Assets | 53% | 55% | 54% | 41% | 38% |
| Interest Coverage | 4.5 | 8.2 | 10.0 | 3.4 | 7.9 |
| Asset Turnover | 0.36 | 0.45 | 0.49 | 0.31 | 0.37 |
| Fixed Asset Turnover | 11.7 | 14.9 | 13.7 | 20.5 | 25.3 |
| Dividend Yield | 2.9% | 3.7% | 2.2% | 1.3% | 0.7% |
Note: Ratios are rounded for clarity. Net Margin, ROE, ROIC, and Dividend Yield are expressed as percentages.
Evolution of Financial Ratios
Between 2021 and 2025, Broadcom Inc.’s Return on Equity (ROE) showed notable fluctuation, peaking at 58.7% in 2023 before settling at 28.5% in 2025, indicating a moderation in profitability. The Current Ratio declined markedly from 2.64 in 2021 to 1.71 in 2025, reflecting reduced short-term liquidity. Meanwhile, the Debt-to-Equity Ratio steadily improved from 1.65 in 2023 to 0.80 in 2025, signaling a more balanced capital structure.
Are the Financial Ratios Fovorable?
In 2025, Broadcom’s profitability ratios, including a 36.2% net margin and 16.4% return on invested capital, are favorable, as is its liquidity evidenced by a current ratio of 1.71 and interest coverage of 8.08. However, valuation metrics like a high price-to-earnings ratio of 73.9 and price-to-book ratio of 21.0 are unfavorable. The asset turnover ratio of 0.37 is low, while debt ratios are neutral, contributing to an overall slightly favorable assessment of the company’s financial ratios.
Shareholder Return Policy
Broadcom Inc. maintains a consistent dividend payout, with a 48% payout ratio in 2025 and a dividend per share rising to 2.36 USD. The dividend yield remains modest at 0.65%, supported by strong free cash flow coverage and balanced dividend and capex payments. The company also engages in share buybacks.
This distribution policy appears sustainable given Broadcom’s robust margins and cash flow generation, supporting long-term shareholder value. However, the relatively high price multiples suggest investors should monitor payout levels and buyback activity for alignment with ongoing financial performance.
Score analysis
The radar chart below presents a comprehensive overview of Broadcom Inc.’s key financial scores:
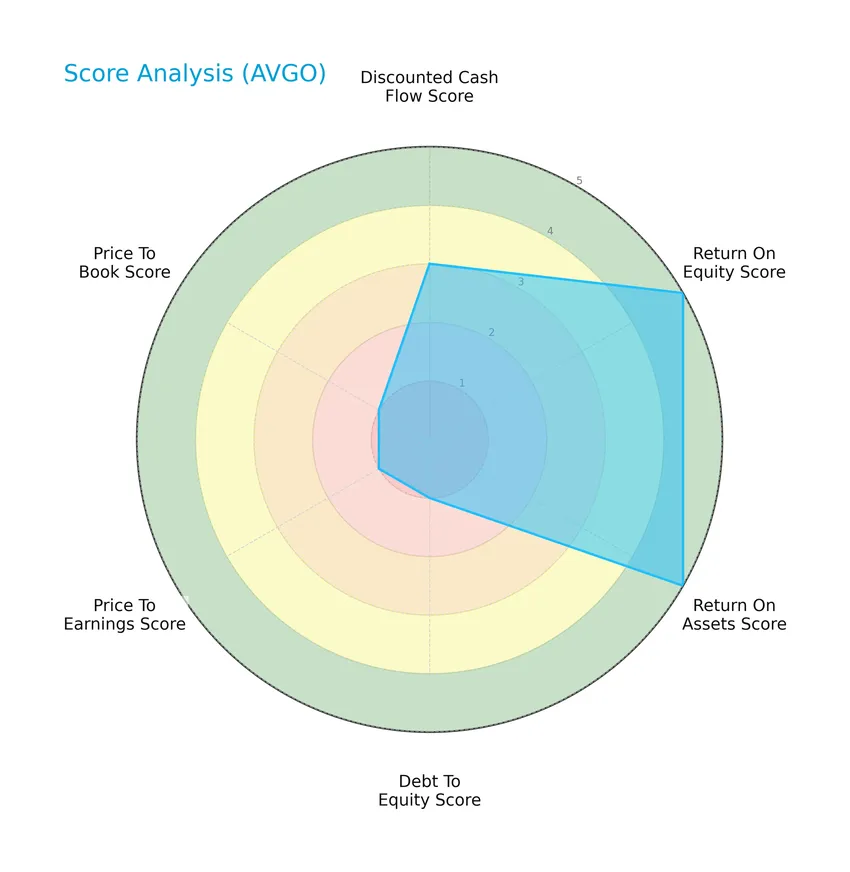
Broadcom Inc. shows very favorable returns on equity and assets with scores of 5 each, while its discounted cash flow score is moderate at 3. However, debt to equity, price to earnings, and price to book scores are very unfavorable, all rated at 1, indicating valuation and leverage concerns.
Analysis of the company’s bankruptcy risk
Broadcom Inc.’s Altman Z-Score places it confidently in the safe zone, reflecting a low bankruptcy risk and strong financial stability:

Is the company in good financial health?
The Piotroski Score diagram highlights Broadcom Inc.’s strong financial position based on various profitability and efficiency criteria:

With a Piotroski Score of 8, Broadcom Inc. demonstrates very strong financial health, suggesting solid fundamentals and resilience in its financial operations.
Competitive Landscape & Sector Positioning
This section provides a detailed sector analysis of Broadcom Inc., covering its strategic positioning and revenue breakdown. I will also assess whether Broadcom holds a competitive advantage compared to its main industry peers.
Strategic Positioning
Broadcom Inc. maintains a diversified product portfolio with significant segments in Semiconductor Solutions ($37B in 2025) and Infrastructure Software ($27B), while geographically its revenue is concentrated in Asia Pacific ($36B), followed by the Americas ($19B) and EMEA ($9B), reflecting a broad global exposure.
Revenue by Segment
The pie chart illustrates Broadcom Inc.’s revenue distribution by segment for fiscal year 2025, highlighting the contribution of Infrastructure Software and Semiconductor Solutions.
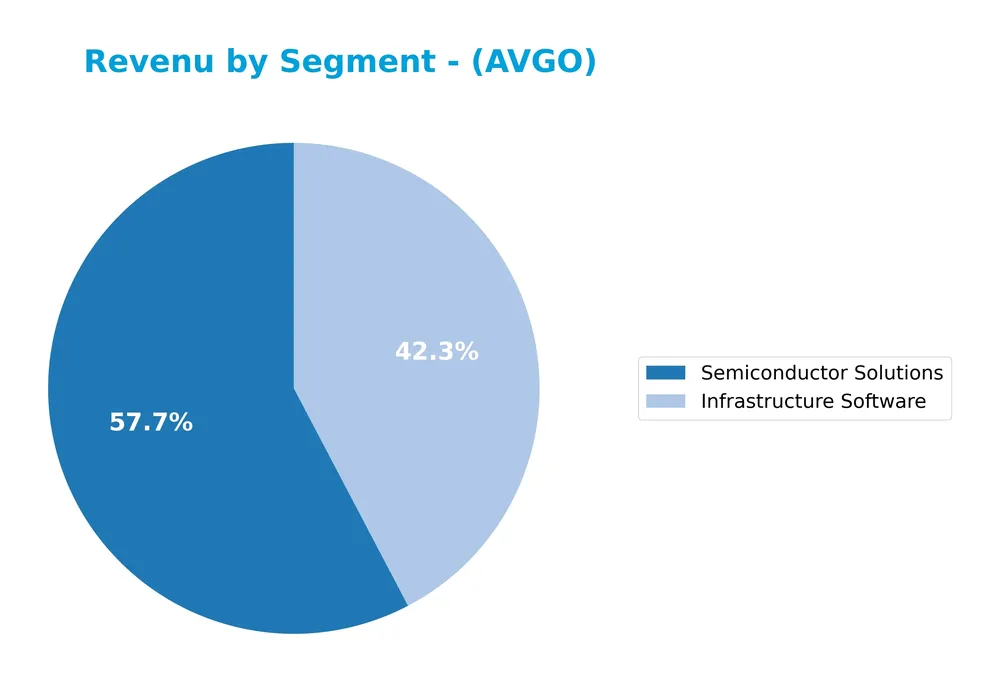
Broadcom’s revenue is primarily driven by Semiconductor Solutions, which reached $36.9B in 2025, showing steady growth from $20.4B in 2021. Infrastructure Software also expanded significantly, rising to $27.0B in 2025 from $7.1B in 2021, indicating a strategic shift towards software solutions. This diversification reduces concentration risk and indicates a balanced acceleration across both segments in the most recent year.
Key Products & Brands
The following table outlines Broadcom Inc.’s key product segments and their main descriptions:
| Product | Description |
|---|---|
| Infrastructure Software | Software solutions supporting enterprise networking, data centers, and telecommunication infrastructure. |
| Semiconductor Solutions | Semiconductor products used in smartphones, data center servers, storage systems, and a variety of electronic devices. |
| Enterprise Storage | Storage systems products designed for data centers and enterprise applications (noted in historical data). |
| Industrial & Other | Products related to factory automation, power generation, alternative energy, and mechanical hardware interfacing sensors (historical). |
| Wired Infrastructure | Equipment for enterprise and data center networking, including wired connectivity solutions (historical). |
| Wireless Communications | Products supporting wireless communication such as smartphones and telecommunication equipment (historical). |
Broadcom’s product portfolio centers on semiconductor solutions and infrastructure software, which together generate the bulk of its revenue. Legacy segments like enterprise storage and industrial products complement its core offerings, reflecting a diverse technology footprint.
Main Competitors
In the Technology sector’s Semiconductors industry, Broadcom Inc. faces 38 competitors, with the top 10 leaders by market capitalization listed below:
| Competitor | Market Cap. |
|---|---|
| NVIDIA Corporation | 4.6T |
| Broadcom Inc. | 1.6T |
| Taiwan Semiconductor Manufacturing Company Limited | 1.6T |
| ASML Holding N.V. | 415B |
| Advanced Micro Devices, Inc. | 363B |
| Micron Technology, Inc. | 353B |
| Lam Research Corporation | 232B |
| Applied Materials, Inc. | 214B |
| QUALCOMM Incorporated | 185B |
| Intel Corporation | 173B |
Broadcom Inc. ranks 2nd among its peers, holding about 33% of the market cap of the leader, NVIDIA. It sits above both the average market cap of the top 10 competitors (975B) and the sector median (31B). Notably, Broadcom has a significant 203% market cap lead over the next competitor above it, underscoring its strong position in the semiconductor industry.
Comparisons with competitors
Check out how we compare the company to its competitors:
Does Broadcom have a competitive advantage?
Broadcom Inc. presents a clear competitive advantage, evidenced by its very favorable moat status, with a ROIC exceeding WACC by nearly 7% and a strong upward ROIC trend of 34%, indicating value creation and durable profitability. The company’s favorable income statement metrics, including a 67.77% gross margin and 36.2% net margin, further support its efficiency and competitive positioning in the semiconductor industry.
Looking ahead, Broadcom’s diverse product portfolio across wired infrastructure, wireless communications, enterprise storage, and industrial applications positions it well to capitalize on expanding markets such as data centers and alternative energy systems. Continued innovation and geographic revenue growth, notably in Asia Pacific and the Americas, suggest ongoing opportunities to sustain its competitive edge.
SWOT Analysis
This SWOT analysis highlights Broadcom Inc.’s key internal strengths and weaknesses alongside external opportunities and threats to inform investment decisions.
Strengths
- strong revenue growth with 23.87% YoY
- high profitability with 36.2% net margin
- durable competitive advantage with growing ROIC
Weaknesses
- high valuation multiples with PE at 73.87
- elevated price-to-book ratio at 21.01
- moderate debt levels with 0.8 debt-to-equity
Opportunities
- increasing demand in Asia Pacific market
- expansion in wireless and enterprise storage sectors
- innovation in semiconductor and infrastructure software
Threats
- intense competition in semiconductor industry
- geopolitical risks impacting global supply chains
- technology obsolescence and rapid innovation cycles
Broadcom demonstrates robust profitability and growth supported by a solid competitive moat. However, high valuation metrics and sector volatility require cautious entry. Strategic focus on innovation and geographic expansion will be critical to sustain growth and mitigate risks.
Stock Price Action Analysis
The weekly chart illustrates Broadcom Inc. (AVGO) stock price movements over the past 12 months, highlighting key highs, lows, and recent volatility:
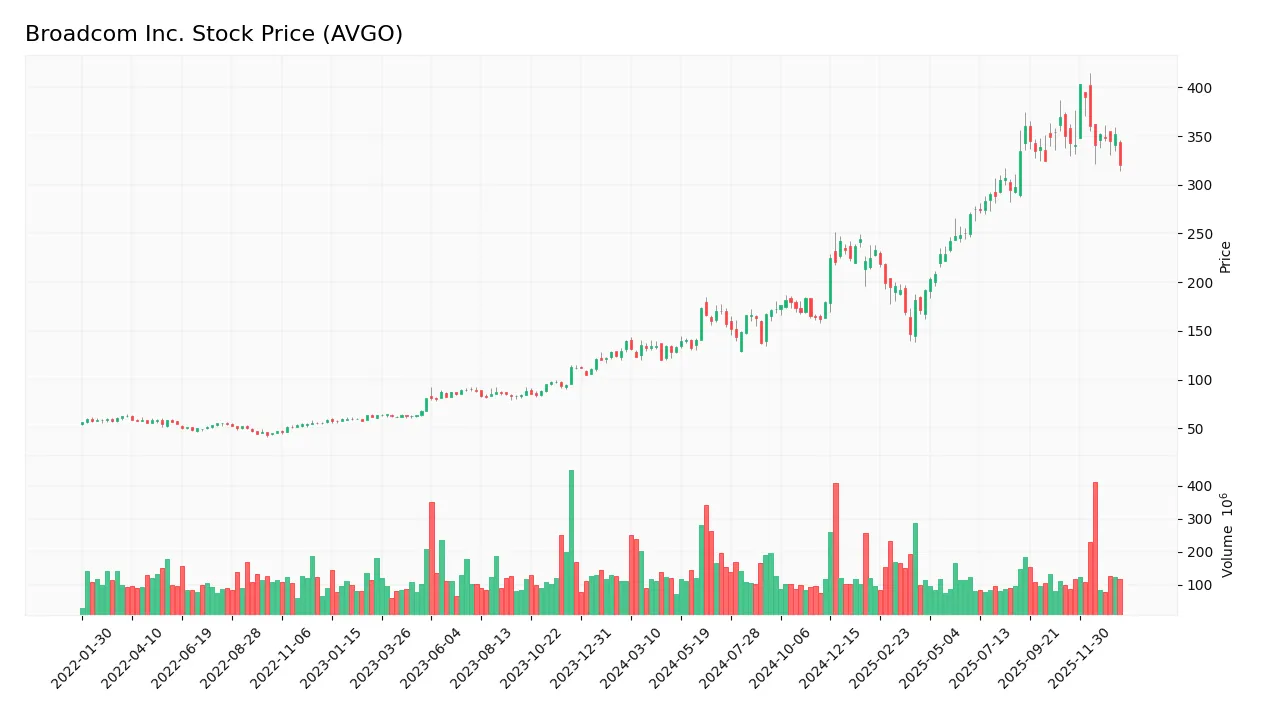
Trend Analysis
Over the past 12 months, AVGO’s stock price increased by 128.74%, indicating a strong bullish trend despite deceleration. The price ranged from a low of 120.47 to a high of 402.96, with significant volatility reflected in a standard deviation of 78.75. Recent weeks show a slight downward slope of -8.41% over the last 2.5 months.
Volume Analysis
In the last three months, trading volume shows a decreasing trend with total volume dominated by sellers at 80M vs. buyers at 33M shares, reflecting seller dominance with only 19.33% buyer participation. This suggests cautious investor sentiment and reduced market engagement.
Target Prices
The consensus target prices for Broadcom Inc. indicate a generally positive outlook among analysts.
| Target High | Target Low | Consensus |
|---|---|---|
| 510 | 370 | 453.25 |
Analysts expect Broadcom’s stock price to range between 370 and 510, with a consensus target around 453, reflecting moderate optimism in its growth potential.

Don’t Let Luck Decide Your Entry Point
Optimize your entry points with our advanced ProRealTime indicators. You’ll get efficient buy signals with precise price targets for maximum performance. Start outperforming now!
Analyst & Consumer Opinions
This section examines recent analyst ratings and consumer feedback to provide an overview of Broadcom Inc.’s market perception.
Stock Grades
Here is the latest summary of Broadcom Inc. stock grades from reputable financial institutions:
| Grading Company | Action | New Grade | Date |
|---|---|---|---|
| Wells Fargo | Upgrade | Overweight | 2026-01-15 |
| Mizuho | Maintain | Outperform | 2026-01-09 |
| Truist Securities | Maintain | Buy | 2025-12-19 |
| UBS | Maintain | Buy | 2025-12-15 |
| Barclays | Maintain | Overweight | 2025-12-12 |
| Citigroup | Maintain | Buy | 2025-12-12 |
| Keybanc | Maintain | Overweight | 2025-12-12 |
| TD Cowen | Maintain | Buy | 2025-12-12 |
| Benchmark | Maintain | Buy | 2025-12-12 |
| B of A Securities | Maintain | Buy | 2025-12-12 |
The consensus among analysts is clearly positive, with the majority maintaining Buy or Overweight ratings and Wells Fargo recently upgrading its outlook. There is a strong consensus favoring accumulation rather than selling or holding.
Consumer Opinions
Consumer sentiment around Broadcom Inc. (AVGO) reflects a mix of appreciation for its technological innovation and concerns over pricing.
| Positive Reviews | Negative Reviews |
|---|---|
| “Broadcom’s products consistently deliver high performance and reliability.” | “The pricing of Broadcom’s solutions feels steep compared to competitors.” |
| “Strong customer support and seamless integration with existing systems.” | “Occasional delays in product updates and firmware releases.” |
| “Innovative chipset technology that drives industry standards.” | “Complex licensing agreements can be confusing for smaller clients.” |
Overall, consumers praise Broadcom for its cutting-edge technology and dependable support, while frequently noting concerns about pricing and product update cadence as areas for improvement.
Risk Analysis
Below is a summary table outlining the key risks associated with investing in Broadcom Inc. (AVGO):
| Category | Description | Probability | Impact |
|---|---|---|---|
| Market Valuation | High P/E (73.87) and P/B (21.01) ratios indicate overvaluation risk, which may lead to price corrections. | High | High |
| Competitive Tech | Rapid innovation in semiconductors can erode market share if Broadcom fails to keep pace. | Medium | High |
| Debt Levels | Debt-to-equity ratio is moderate (0.8) but the low debt-to-equity score suggests financial leverage risk. | Medium | Medium |
| Economic Cycles | Semiconductor demand is cyclical; downturns can reduce revenue and margins significantly. | Medium | High |
| Dividend Yield | Low dividend yield (0.65%) may deter income-focused investors amid market volatility. | Low | Low |
| Regulatory Risks | Changes in trade policies or export restrictions could impact supply chains and sales. | Medium | Medium |
The most significant risks stem from Broadcom’s currently stretched valuation multiples and the cyclical nature of the semiconductor industry. Although the company is financially strong with a safe Altman Z-Score and very strong Piotroski score, investors should carefully monitor market conditions and competitive pressures in this fast-evolving sector.
Should You Buy Broadcom Inc.?
Broadcom Inc. appears to be delivering robust profitability supported by a durable competitive moat with growing operational efficiency. Despite a challenging leverage profile, its overall rating is a solid B, suggesting a profile of strong value creation tempered by notable debt considerations.
Strength & Efficiency Pillars
Broadcom Inc. exhibits robust profitability with a net margin of 36.2% and a return on equity of 28.45%, reflecting efficient capital utilization. Its return on invested capital stands at 16.36%, comfortably above the weighted average cost of capital at 9.38%, confirming the company as a clear value creator. Financial health metrics reinforce this strength, with an Altman Z-score of 12.18 placing Broadcom well within the safe zone, and a strong Piotroski score of 8 indicating solid operational and financial stability.
Weaknesses and Drawbacks
Despite its strengths, Broadcom faces notable valuation and leverage concerns. The price-to-earnings ratio is elevated at 73.87, and the price-to-book ratio at 21.01, signaling a premium valuation that may limit upside potential and increase downside risk if growth falters. While debt-to-equity is moderate at 0.8, valuation multiples suggest heightened market expectations. Furthermore, recent market activity reveals seller dominance, with buyers representing only 19.33% of volume from November 2025 to January 2026, creating short-term headwinds.
Our Verdict about Broadcom Inc.
Broadcom’s long-term fundamental profile appears favorable, underpinned by strong profitability and financial health. However, despite its bullish overall stock trend and value-creating profile, recent seller dominance in the short term suggests caution. Investors might consider a wait-and-see approach for a more opportune entry point, as current market pressures could temper near-term performance despite underlying strength.
Disclaimer: This content is for informational purposes only and does not constitute financial, investment, or other professional advice. Investing in financial markets involves a significant risk of loss, and past performance is not indicative of future results.
Additional Resources
- What’s Going On With Broadcom Stock Thursday? – Broadcom (NASDAQ:AVGO) – Benzinga (Jan 22, 2026)
- Broadcom Inc. (AVGO) Stock Dips While Market Gains: Key Facts – Yahoo Finance (Jan 21, 2026)
- Cathie Wood Is Doubling Down on Broadcom Stock. Should You? – Barchart.com (Jan 22, 2026)
- Broadcom (NASDAQ:AVGO) Trading Down 1% – Here’s What Happened – MarketBeat (Jan 23, 2026)
- Broadcom Inc. (AVGO) Is Considered a Good Investment by Brokers: Is That True? – Yahoo Finance (Jan 21, 2026)
For more information about Broadcom Inc., please visit the official website: broadcom.com