Home > Analyses > Healthcare > Bristol-Myers Squibb Company
Bristol-Myers Squibb transforms patient lives through breakthrough therapies in cancer, cardiovascular, and immunology care. It commands the pharmaceutical sector with flagship drugs like Opdivo and Eliquis, renowned for innovation and clinical impact. The company’s deep pipeline and strategic acquisitions bolster its market influence and growth prospects. As biotech competition intensifies, I question whether Bristol-Myers Squibb’s current fundamentals justify its premium valuation and future earnings potential.

Table of contents
Business Model & Company Overview
Bristol-Myers Squibb Company, founded in 1887 and headquartered in New York, NY, stands as a leader in the drug manufacturing industry. It delivers a comprehensive biopharmaceutical ecosystem targeting hematology, oncology, cardiovascular, immunology, and more. Its diverse portfolio includes breakthrough drugs like Opdivo and Eliquis, uniting innovation with patient care across multiple complex diseases.
The company’s revenue engine balances patented pharmaceuticals with global distribution, reaching wholesalers, pharmacies, hospitals, and government agencies across the Americas, Europe, and Asia. This blend of recurring product demand and strategic market penetration underpins Bristol-Myers Squibb’s robust financial profile. Its competitive advantage lies in a strong pipeline and global reach, solidifying its role as an industry shaper with a durable economic moat.
Financial Performance & Fundamental Metrics
I analyze Bristol-Myers Squibb Company’s income statement, key financial ratios, and dividend payout policy to assess its core financial health and investment appeal.
Income Statement
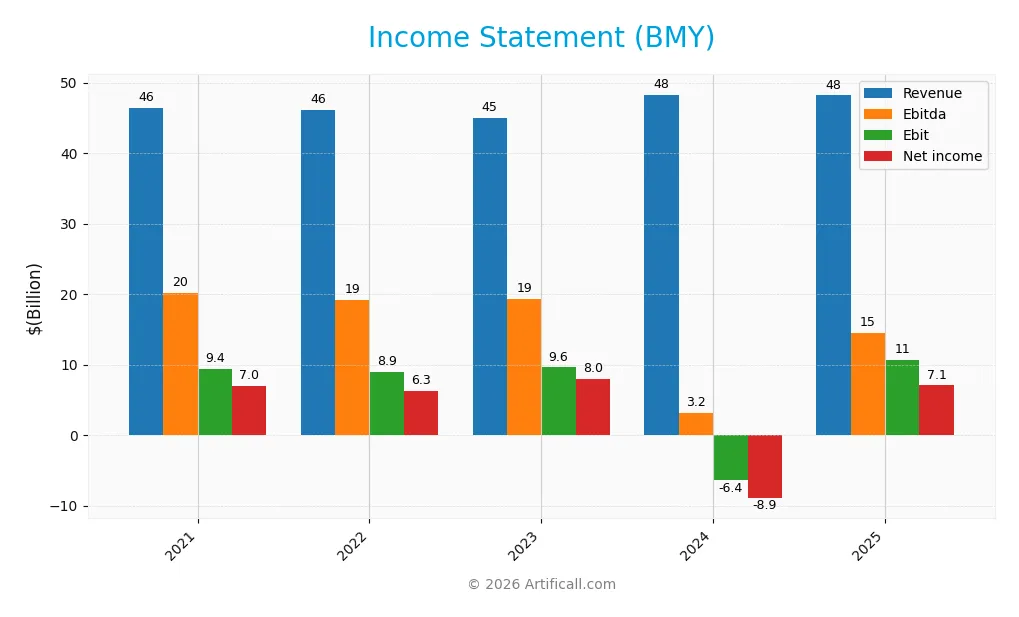
The table below summarizes Bristol-Myers Squibb Company’s key income statement figures for fiscal years 2021 through 2025, showing revenue, expenses, and profitability metrics.
| 2021 | 2022 | 2023 | 2024 | 2025 | |
|---|---|---|---|---|---|
| Revenue | 46.4B | 46.2B | 45.0B | 48.3B | 48.2B |
| Cost of Revenue | 19.6B | 19.7B | 19.6B | 20.9B | 15.6B |
| Operating Expenses | 17.2B | 17.2B | 16.9B | 17.8B | 19.9B |
| Gross Profit | 26.8B | 26.5B | 25.4B | 27.4B | 32.6B |
| EBITDA | 20.1B | 19.2B | 19.4B | 3.2B | 14.5B |
| EBIT | 9.4B | 8.9B | 9.6B | -6.4B | 10.7B |
| Interest Expense | 1.3B | 1.2B | 1.2B | 1.9B | 1.5B |
| Net Income | 7.0B | 6.3B | 8.0B | -8.9B | 7.1B |
| EPS | 3.15 | 2.97 | 3.88 | -4.41 | 3.46 |
| Filing Date | 2022-02-09 | 2023-02-14 | 2024-02-13 | 2025-02-12 | 2026-02-11 |
Income Statement Evolution
Revenue for Bristol-Myers Squibb (BMY) showed a slight decline of 0.22% in 2025, after a modest overall growth of 3.9% from 2021 to 2025. Gross profit improved significantly by 18.85% in the last year, supporting a favorable gross margin of 67.65%. Net income demonstrated a modest overall growth but surged 179% in 2025, reflecting improved profitability despite a slight contraction in revenue.
Is the Income Statement Favorable?
The 2025 income statement reveals solid fundamentals with a net margin of 14.63% and an EBIT margin of 22.17%, both favorable benchmarks in the pharmaceutical sector. Interest expense remains well controlled at 3.13% of revenue. Earnings per share grew 178%, underscoring operational efficiency gains. While revenue dipped slightly, the robust margin expansion and net income rebound signal generally favorable income dynamics.
Financial Ratios
The following table presents key financial ratios for Bristol-Myers Squibb Company (BMY) over recent fiscal years, offering insight into profitability, liquidity, leverage, and market valuation:
| Ratios | 2021 | 2022 | 2023 | 2024 | 2025 |
|---|---|---|---|---|---|
| Net Margin | 15.1% | 13.7% | 17.8% | -18.5% | 14.6% |
| ROE | 19.5% | 20.4% | 27.3% | -54.8% | 38.2% |
| ROIC | 8.9% | 9.6% | 10.6% | 13.6% | 13.9% |
| P/E | 19.8 | 24.2 | 13.2 | -12.8 | 15.6 |
| P/B | 3.85 | 4.93 | 3.61 | 7.02 | 5.96 |
| Current Ratio | 1.52 | 1.25 | 1.43 | 1.25 | 1.26 |
| Quick Ratio | 1.43 | 1.14 | 1.31 | 1.15 | 1.14 |
| D/E | 1.27 | 1.31 | 1.41 | 3.13 | 2.65 |
| Debt-to-Assets | 41.7% | 42.1% | 43.6% | 55.3% | 54.4% |
| Interest Coverage | 7.15 | 7.53 | 7.27 | 4.96 | 8.41 |
| Asset Turnover | 0.42 | 0.48 | 0.47 | 0.52 | 0.54 |
| Fixed Asset Turnover | 6.66 | 6.18 | 5.60 | 5.78 | 5.28 |
| Dividend Yield | 3.17% | 3.02% | 4.47% | 4.24% | 4.58% |
Evolution of Financial Ratios
Between 2021 and 2025, Bristol-Myers Squibb’s ROE showed significant volatility, plunging sharply negative in 2024 before rebounding strongly to 38.18% in 2025. The current ratio remained relatively stable around 1.25 to 1.52, indicating steady liquidity. The debt-to-equity ratio rose notably from around 1.27 in 2021 to 2.65 in 2025, signaling increased leverage and financial risk.
Are the Financial Ratios Favorable?
In 2025, profitability metrics like net margin (14.63%) and ROE (38.18%) were favorable, supported by a solid ROIC of 13.9% exceeding the WACC of 4.48%. Liquidity was mixed; the quick ratio was favorable at 1.14, but the current ratio was neutral at 1.26. Leverage ratios, including a high debt-to-equity of 2.65 and debt-to-assets at 54.38%, were unfavorable, raising caution. Market valuation ratios were mostly neutral or unfavorable, with a PE of 15.61 neutral and a high PB of 5.96 unfavorable. Overall, 57% of key ratios were favorable.
Shareholder Return Policy
Bristol-Myers Squibb maintains a consistent dividend policy, with a payout ratio around 60-70% and a dividend yield near 4.5% in 2025. The dividend is well covered by free cash flow, supporting a sustainable distribution. The company also pursues share buybacks, complementing returns to shareholders.
This balanced approach aligns with long-term value creation by combining steady income with capital allocation flexibility. However, its elevated debt levels warrant monitoring, as excessive leverage could pressure future payouts. Overall, the policy reflects prudent capital management in a mature pharmaceutical sector.
Score analysis
The following radar chart presents a comprehensive view of Bristol-Myers Squibb Company’s key financial scores:
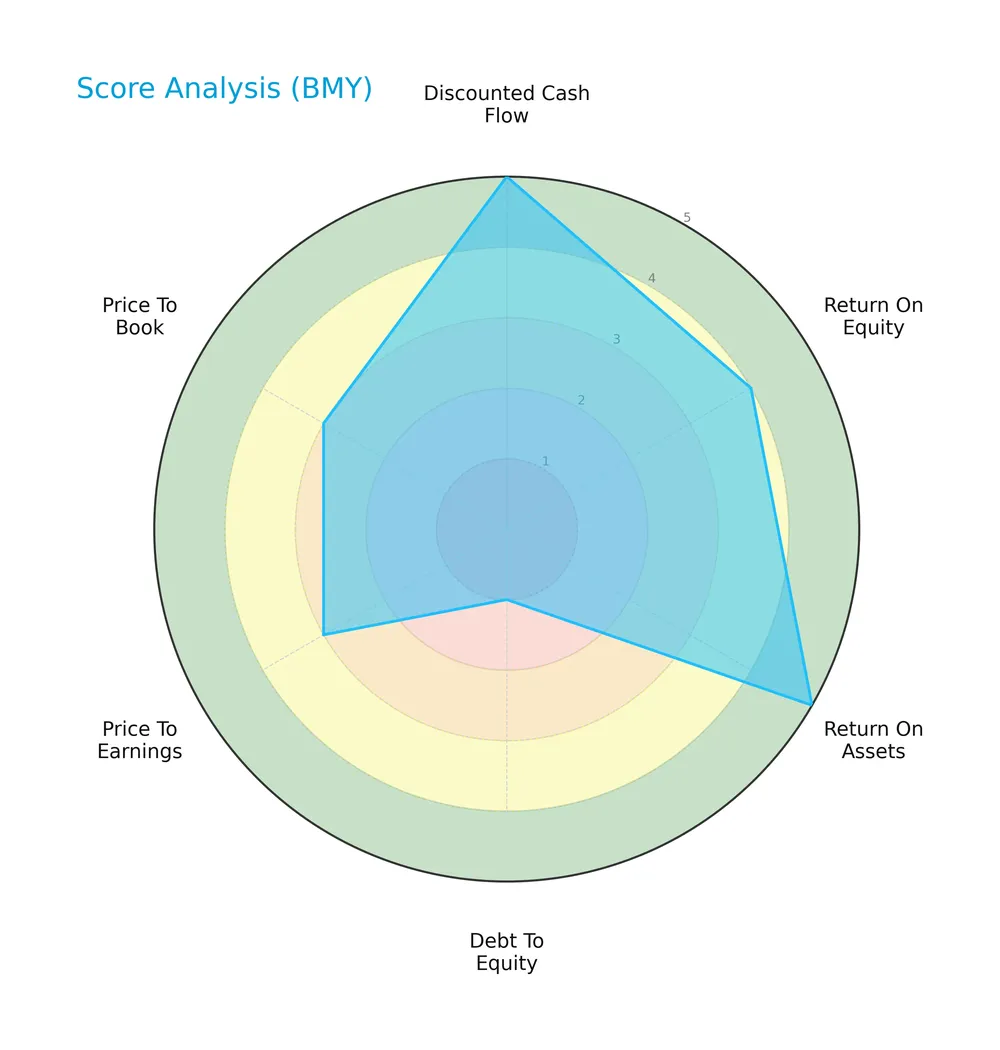
The company scores very favorably on discounted cash flow (5) and return on assets (5), showing strong profitability and cash generation. Return on equity is favorable (4), signaling efficient capital use. However, debt-to-equity scores poorly (1), indicating high leverage risk. Valuation metrics, price-to-earnings and price-to-book, hold moderate scores (3 each), reflecting fair market pricing.
Analysis of the company’s bankruptcy risk
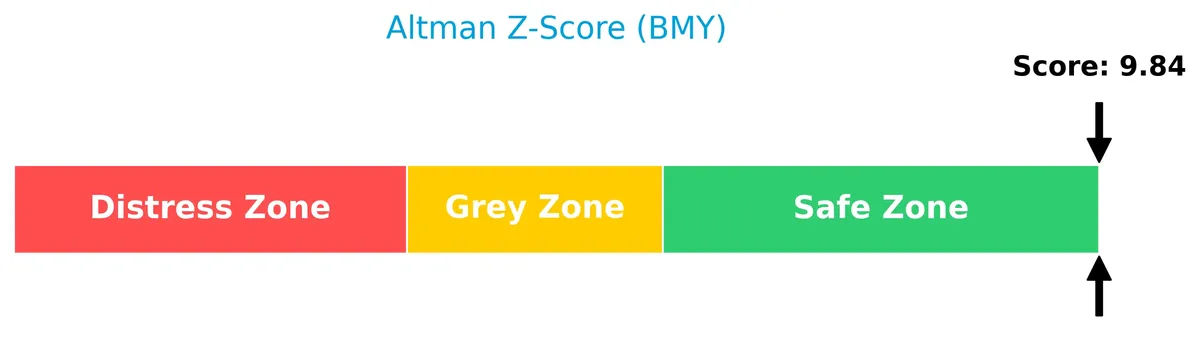
Bristol-Myers Squibb’s Altman Z-Score places it well within the safe zone, indicating low bankruptcy risk and strong financial stability:
Is the company in good financial health?
The Piotroski diagram illustrates Bristol-Myers Squibb’s solid financial health based on key fundamental criteria:

With a Piotroski Score of 7, the company demonstrates strong financial strength, reflecting robust profitability, liquidity, and operational efficiency. This score signals a healthy balance sheet and prudent management practices.
Competitive Landscape & Sector Positioning
This analysis explores Bristol-Myers Squibb’s strategic positioning, revenue segments, and key products within the healthcare sector. I will assess whether Bristol-Myers Squibb holds a competitive advantage over its main competitors.
Strategic Positioning
Bristol-Myers Squibb maintains a diversified product portfolio across oncology, immunology, cardiovascular, and other therapeutic areas. Its revenue predominantly derives from the U.S. market, with expanding international sales in Europe and other regions, reflecting a concentrated yet gradually broadening geographic exposure.
Revenue by Segment
This pie chart illustrates Bristol-Myers Squibb’s revenue distribution by product segment for the fiscal year 2025, highlighting the company’s diverse pharmaceutical portfolio.
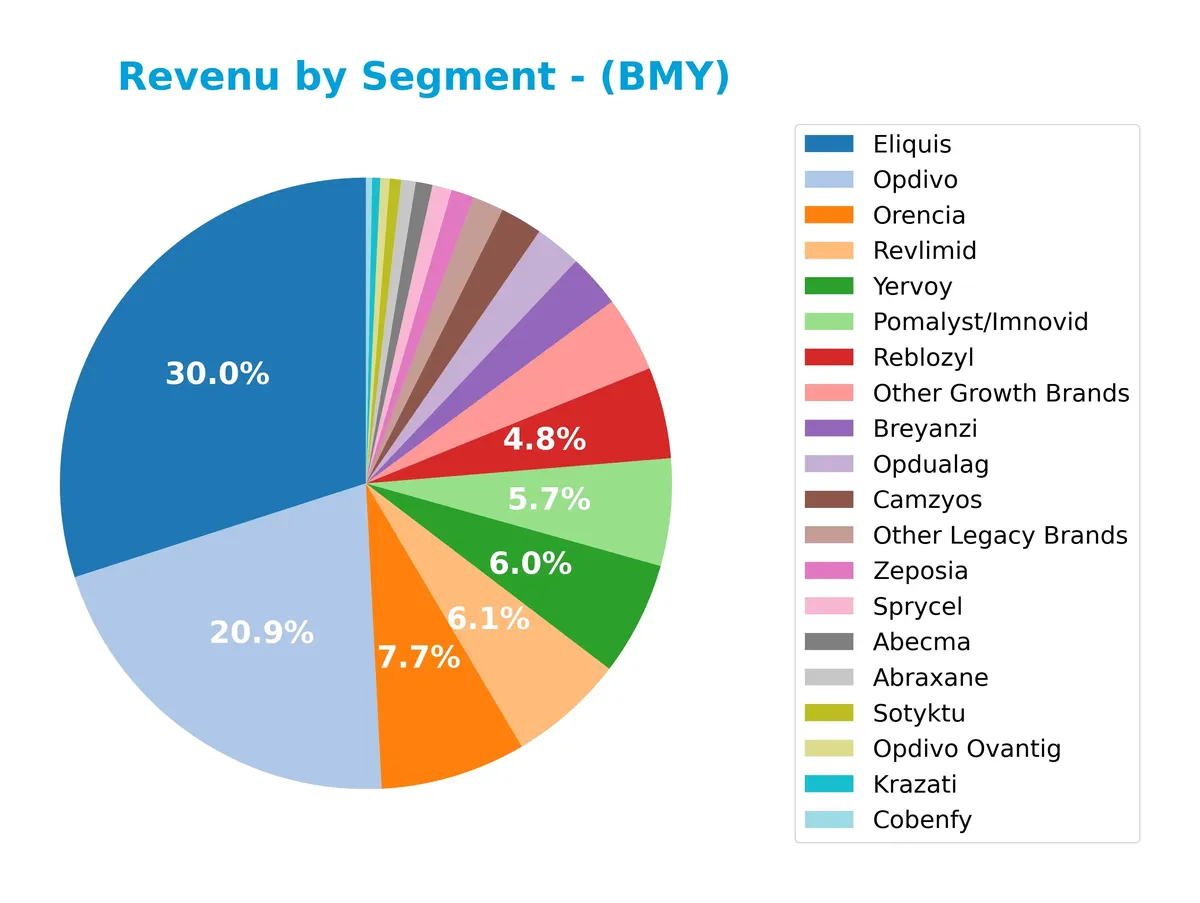
Eliquis leads the revenue base at $14.4B, followed by Opdivo at $10B and Orencia at $3.7B, showing strong dependence on these core products. Notably, newer brands like Breyanzi and Camzyos each exceed $1B, suggesting successful portfolio expansion. The 2025 data reveals a modest shift towards growth brands, slightly reducing concentration risk from legacy blockbusters.
Key Products & Brands
The table below summarizes Bristol-Myers Squibb’s key products and their descriptions:
| Product | Description |
|---|---|
| Revlimid | Oral immunomodulatory drug for multiple myeloma treatment. |
| Eliquis | Oral inhibitor reducing stroke/systemic embolism risk in NVAF and treating DVT/PE. |
| Opdivo | Immuno-oncology drug for various anti-cancer indications. |
| Pomalyst/Imnovid | Treatment for patients with multiple myeloma. |
| Orencia | Therapy for adult patients with active rheumatoid arthritis and psoriatic arthritis. |
| Sprycel | Treatment for Philadelphia chromosome-positive chronic myeloid leukemia. |
| Yervoy | Treatment for unresectable or metastatic melanoma patients. |
| Abraxane | Protein-bound chemotherapy product. |
| Reblozyl | Treats anemia in adult patients with beta thalassemia. |
| Empliciti | Therapy for multiple myeloma. |
| Zeposia | Treatment for relapsing forms of multiple sclerosis. |
| Breyanzi | CD19-directed genetically modified autologous T cell immunotherapy for relapsed/refractory lymphoma. |
| Inrebic | Oral kinase inhibitor for adult patients with myelofibrosis. |
| Onureg | Treatment for adult patients with acute myeloid leukemia (AML). |
| Abecma | Treatment for multiple myeloma. |
| Camzyos | Cardiovascular therapy. |
| Cobenfy | Product included among the portfolio but without detailed description provided. |
| Krazati | Product included among the portfolio but without detailed description provided. |
| Opdualag | Combination therapy related to Opdivo for cancer treatment. |
| Other Growth Brands | Emerging products contributing to growth. |
| Other Legacy Brands | Established products maintaining steady revenue streams. |
Bristol-Myers Squibb’s portfolio spans oncology, hematology, immunology, and cardiovascular therapies. Its flagship drugs like Eliquis and Opdivo dominate revenue, reflecting a strategic focus on innovative biopharmaceuticals addressing serious diseases worldwide.
Main Competitors
The sector includes 10 main competitors; below is a table of the top 10 leaders by market capitalization:
| Competitor | Market Cap. |
|---|---|
| Eli Lilly and Company | 970B |
| Johnson & Johnson | 500B |
| AbbVie Inc. | 405B |
| AstraZeneca PLC | 285B |
| Merck & Co., Inc. | 268B |
| Amgen Inc. | 176B |
| Gilead Sciences, Inc. | 151B |
| Pfizer Inc. | 143B |
| Bristol-Myers Squibb Company | 109B |
| Biogen Inc. | 26B |
Bristol-Myers Squibb ranks 9th among its peers, with a market cap 12.75% the size of Eli Lilly, the sector leader. It sits below both the average top 10 market cap of 303B and the sector median of 222B. The company maintains a 15.69% gap from its next closest competitor above, highlighting a notable scale difference.
Comparisons with competitors
Check out how we compare the company to its competitors:
Does BMY have a competitive advantage?
Bristol-Myers Squibb demonstrates a sustainable competitive advantage, creating value with an ROIC 9.4% above WACC and a strong upward ROIC trend. The company’s consistent profitability marks it as a value creator in the drug manufacturing sector.
Looking ahead, BMY’s diverse biopharmaceutical portfolio, including oncology and immunology products, supports future growth opportunities. Expansion into emerging markets and innovative therapies could further enhance its competitive positioning.
SWOT Analysis
This SWOT analysis highlights Bristol-Myers Squibb’s key strategic factors shaping its competitive positioning.
Strengths
- strong ROIC well above WACC
- diversified biopharma portfolio
- robust net margin and earnings growth
Weaknesses
- high debt-to-equity ratio
- moderate revenue growth
- premium price-to-book ratio
Opportunities
- expanding oncology and immunology markets
- innovation in cell therapies
- geographic expansion in emerging markets
Threats
- patent expirations
- regulatory pressures
- competitive biotech advancements
Bristol-Myers Squibb’s durable moat and improving profitability position it well for long-term value creation. However, elevated leverage and slowing top-line growth require cautious capital management. The firm must innovate and diversify to mitigate patent cliffs and intensifying competition.
Stock Price Action Analysis
The weekly stock chart below illustrates Bristol-Myers Squibb Company’s price movements and volatility over the last 12 months:
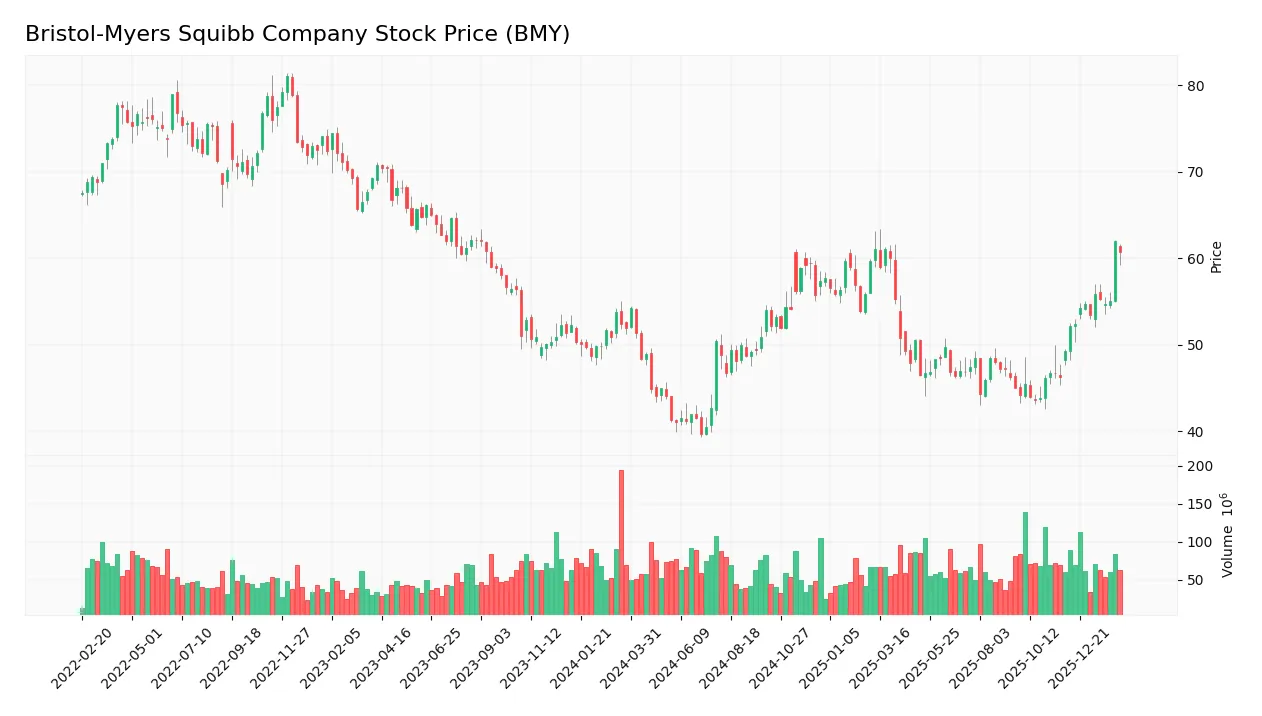
Trend Analysis
Over the past year, BMY’s stock price increased by 16.97%, indicating a bullish trend with accelerating momentum. The price ranged between 39.66 and 61.99, showing strong upside potential. Volatility remains moderate with a 5.62 standard deviation, reflecting consistent investor interest and healthy price swings.
Volume Analysis
Trading volumes are decreasing overall, with a slight buyer dominance at 51.28% historically. In the recent three months, buyer volume surged to 606M versus 213M sellers, showing strong buyer dominance at 74.03%. This suggests heightened investor confidence and selective accumulation amid lower overall turnover.
Target Prices
Analysts set a target consensus that reflects cautious optimism for Bristol-Myers Squibb Company.
| Target Low | Target High | Consensus |
|---|---|---|
| 40 | 72 | 60.11 |
The range from 40 to 72 suggests analysts expect moderate upside potential, with a consensus near 60 signaling steady confidence in the stock’s outlook.

Don’t Let Luck Decide Your Entry Point
Optimize your entry points with our advanced ProRealTime indicators. You’ll get efficient buy signals with precise price targets for maximum performance. Start outperforming now!
Analyst & Consumer Opinions
This section examines Bristol-Myers Squibb Company’s analyst ratings alongside consumer feedback to provide balanced insights.
Stock Grades
The following table summarizes recent verified analyst grades for Bristol-Myers Squibb Company (BMY) from leading financial institutions:
| Grading Company | Action | New Grade | Date |
|---|---|---|---|
| Guggenheim | Maintain | Buy | 2026-02-06 |
| Citigroup | Maintain | Neutral | 2026-02-06 |
| Wells Fargo | Maintain | Equal Weight | 2026-02-06 |
| Piper Sandler | Maintain | Overweight | 2026-01-28 |
| Citigroup | Maintain | Neutral | 2026-01-27 |
| Leerink Partners | Maintain | Outperform | 2026-01-13 |
| Scotiabank | Maintain | Sector Perform | 2026-01-09 |
| Citigroup | Maintain | Neutral | 2026-01-07 |
| UBS | Upgrade | Buy | 2026-01-07 |
| B of A Securities | Upgrade | Buy | 2025-12-15 |
The consensus remains cautious with a “Hold” rating supported by a nearly equal split between buy and hold recommendations. Upgrades from UBS and B of A Securities indicate selective confidence amid steady neutral stances from major players like Citigroup.
Consumer Opinions
Bristol-Myers Squibb inspires mixed feelings among consumers, reflecting its complex role in healthcare.
| Positive Reviews | Negative Reviews |
|---|---|
| Effective medications improving lives | High drug prices strain budgets |
| Responsive customer support | Occasional delays in prescription fulfillment |
| Strong commitment to innovation | Side effects reported by some users |
Overall, consumers appreciate BMY’s innovation and efficacy but express frustration with pricing and service delays. The company must balance cutting-edge treatments with affordability to strengthen loyalty.
Risk Analysis
Below is a detailed table outlining Bristol-Myers Squibb’s key risks, their likelihood, and potential impact:
| Category | Description | Probability | Impact |
|---|---|---|---|
| Financial Leverage | High debt-to-equity ratio (2.65) raises refinancing risk | Medium | High |
| Valuation | Elevated price-to-book ratio (5.96) may signal overvaluation | Medium | Medium |
| Operational | Exposure to patent cliffs could pressure future revenue streams | Low | High |
| Regulatory | Stringent FDA approvals and policy changes affect pipeline | Medium | High |
| Market | Low beta (0.295) limits downside volatility but reduces growth | Low | Medium |
| Liquidity | Current ratio at 1.26 indicates moderate short-term resilience | Medium | Low |
The most critical risk lies in Bristol-Myers Squibb’s elevated leverage, which could strain cash flow if interest rates rise or sales falter. Patent expirations remain a looming threat, potentially eroding top-line growth. However, the company’s strong Altman Z-Score (9.84) confirms financial stability, mitigating bankruptcy risk despite debt concerns.
Should You Buy Bristol-Myers Squibb Company?
Bristol-Myers Squibb appears to be in a very favorable position with robust profitability and a durable competitive moat supported by growing ROIC well above WACC. Despite a challenging leverage profile, the company’s overall rating stands at A-, suggesting prudent value creation and operational efficiency.
Strength & Efficiency Pillars
Bristol-Myers Squibb Company demonstrates robust profitability with a net margin of 14.63% and a return on equity (ROE) of 38.18%. Its return on invested capital (ROIC) stands at 13.9%, comfortably above the weighted average cost of capital (WACC) at 4.48%, confirming the company as a clear value creator. I observe a growing ROIC trend (+55.7%), signaling expanding operational efficiency. The strong interest coverage ratio of 7.08x and a favorable gross margin of 67.65% further reinforce operational resilience.
Weaknesses and Drawbacks
The company’s financial structure reveals notable leverage risks, with a debt-to-equity ratio of 2.65 and debt-to-assets at 54.38%, both unfavorable. This elevated leverage heightens vulnerability to interest rate fluctuations despite a solid interest coverage. Valuation presents mixed signals: the price-to-earnings ratio of 15.61 is moderate, but the price-to-book ratio at 5.96 flags a premium valuation. The current ratio of 1.26 suggests adequate liquidity but leaves limited buffer against short-term shocks.
Our Final Verdict about Bristol-Myers Squibb Company
The company’s fundamentals appear attractive for long-term exposure, supported by strong profitability and a sustainable competitive advantage. The bullish overall stock trend with accelerating price gains complements the favorable financial profile. Additionally, recent buyer dominance at 74.03% signals positive market sentiment. However, investors should monitor leverage levels carefully, as elevated debt could pose risks if market conditions deteriorate.
Disclaimer: This content is for informational purposes only and does not constitute financial, investment, or other professional advice. Investing in financial markets involves a significant risk of loss, and past performance is not indicative of future results.
Additional Resources
- Colrain Capital LLC Has $8.03 Million Holdings in Bristol Myers Squibb Company $BMY – MarketBeat (Feb 17, 2026)
- What Bristol-Myers Squibb (BMY)’s Earnings Rebound and Completed Buybacks Mean For Shareholders – simplywall.st (Feb 17, 2026)
- Here’s What Analysts Are Saying About Bristol-Myers Squibb Company (BMY) – Yahoo Finance (Feb 13, 2026)
- Pharmaceutical research and development pipeline – Bristol Myers Squibb (Feb 04, 2026)
- Bristol-Myers Squibb Company (BMY) growth portfolio driving earnings growth – MSN (Feb 12, 2026)
For more information about Bristol-Myers Squibb Company, please visit the official website: bms.com