Home > Analyses > Healthcare > Boston Scientific Corporation
Boston Scientific transforms patient care with cutting-edge medical devices that tackle complex cardiovascular, neurological, and surgical challenges. Its flagship products, from drug-eluting stents to advanced cardiac rhythm management systems, set industry standards for innovation and quality. As a powerhouse in the medical devices sector, Boston Scientific shapes treatment protocols worldwide. The critical question for investors: do its robust fundamentals still justify its premium valuation amid evolving healthcare demands?

Table of contents
Business Model & Company Overview
Boston Scientific Corporation, founded in 1979 and headquartered in Marlborough, Massachusetts, stands as a dominant player in the medical devices sector. It delivers an integrated suite of interventional technologies spanning MedSurg, Rhythm and Neuro, and Cardiovascular specialties. This ecosystem targets complex conditions from cardiac arrhythmias to peripheral arterial disease, creating a comprehensive healthcare platform.
The company generates value through a balanced mix of implantable devices, diagnostic tools, and therapeutic solutions. Its revenue engine thrives on recurring demand for high-tech hardware and accompanying software systems, supported by a global footprint across the Americas, Europe, and Asia. Boston Scientific’s sustainable competitive advantage lies in its innovation pipeline and entrenched clinical relationships, securing a long-term moat in shaping medical intervention standards worldwide.
Financial Performance & Fundamental Metrics
I analyze Boston Scientific Corporation’s income statement, key financial ratios, and dividend payout policy to assess its operational efficiency and shareholder returns.
Income Statement
The table below presents Boston Scientific Corporation’s key income statement figures for fiscal years 2021 through 2025, all in USD.

| 2021 | 2022 | 2023 | 2024 | 2025 | |
|---|---|---|---|---|---|
| Revenue | 11.9B | 12.7B | 14.2B | 16.7B | 20.1B |
| Cost of Revenue | 4.4B | 5.0B | 5.4B | 6.5B | 6.2B |
| Operating Expenses | 5.5B | 5.9B | 6.7B | 7.6B | 9.9B |
| Gross Profit | 7.5B | 7.7B | 8.8B | 10.3B | 13.9B |
| EBITDA | 2.5B | 2.7B | 3.5B | 3.9B | 3.7B |
| EBIT | 1.4B | 1.6B | 2.3B | 2.7B | 3.7B |
| Interest Expense | 349M | 464M | 272M | 387M | 349M |
| Net Income | 1.0B | 698M | 1.6B | 1.9B | 2.9B |
| EPS | 0.69 | 0.45 | 1.08 | 1.26 | 1.96 |
| Filing Date | 2022-02-23 | 2023-02-23 | 2024-02-21 | 2025-02-18 | 2026-02-17 |
Income Statement Evolution
Boston Scientific’s revenue rose steadily from 11.9B in 2021 to 20.1B in 2025, a 69% increase overall. Net income surged 178% over the same period, reflecting strong margin expansion. Gross margin improved to 69%, while net margin climbed to 14.4%, indicating better cost control and profitability despite rising operating expenses.
Is the Income Statement Favorable?
The 2025 income statement shows robust fundamentals with revenue growth near 20% year-over-year. EBIT margin stands at a favorable 18.6%, and net margin improved by nearly 30% compared to 2024. Interest expense remains low at 1.74% of revenue. Operating expenses grew in line with revenue, slightly pressuring margins but overall, the income trends appear favorable and sustainable.
Financial Ratios
Below is a summary of key financial ratios for Boston Scientific Corporation (BSX) over the last five fiscal years:
| Ratios | 2021 | 2022 | 2023 | 2024 | 2025 |
|---|---|---|---|---|---|
| Net Margin | 8.7% | 5.5% | 11.2% | 11.1% | 14.4% |
| ROE | 6.3% | 4.0% | 8.3% | 8.5% | 11.9% |
| ROIC | 6.6% | 3.9% | 5.7% | 6.1% | 8.8% |
| P/E | 58.1 | 94.8 | 52.7 | 70.9 | 48.9 |
| P/B | 3.6 | 3.8 | 4.4 | 6.0 | 5.8 |
| Current Ratio | 1.48 | 1.51 | 1.32 | 1.08 | 1.62 |
| Quick Ratio | 1.10 | 1.02 | 0.82 | 0.64 | 1.08 |
| D/E | 0.57 | 0.53 | 0.49 | 0.51 | 0.47 |
| Debt-to-Assets | 29.3% | 28.6% | 27.0% | 28.3% | 26.2% |
| Interest Coverage | 5.5x | 3.9x | 8.0x | 6.8x | 11.4x |
| Asset Turnover | 0.37 | 0.39 | 0.41 | 0.43 | 0.46 |
| Fixed Asset Turnover | 4.43 | 4.48 | 4.32 | 4.47 | 4.97 |
| Dividend Yield | 0.09% | 0.08% | 0.03% | 0.00% | 0.00% |
All percentages are rounded to one decimal place. Interest coverage is expressed as times covered.
Evolution of Financial Ratios
From 2021 to 2025, Boston Scientific’s Return on Equity (ROE) improved moderately, reaching 11.9% in 2025. The Current Ratio strengthened from about 1.48 in 2021 to 1.62 in 2025, indicating better short-term liquidity. The Debt-to-Equity ratio decreased slightly to 0.47, reflecting reduced leverage. Profitability showed steady growth, with net margins rising from 8.7% to 14.4%.
Are the Financial Ratios Favorable?
In 2025, profitability metrics such as net margin (14.38%) and WACC (6.39%) are favorable, while ROE (11.9%) and ROIC (8.8%) remain neutral compared to sector norms. Liquidity ratios, including the current ratio (1.62) and quick ratio (1.08), are strong. Leverage is controlled with a debt-to-equity ratio of 0.47. Market multiples like P/E (48.9) and P/B (5.82) appear elevated, suggesting caution. Overall, the ratios are generally favorable with some valuation risks.
Shareholder Return Policy
Boston Scientific Corporation does not pay dividends as of 2025, with a dividend payout ratio and yield at zero. The company retains earnings, likely prioritizing reinvestment and growth, while no share buybacks are reported for the period.
This approach aligns with a strategy focused on long-term value creation through capital allocation rather than immediate shareholder distributions. The absence of dividends combined with reinvestment suggests a focus on sustaining growth and operational expansion over direct cash returns.
Score analysis
Below is a radar chart illustrating Boston Scientific Corporation’s key financial scores across critical valuation and performance metrics:

The discounted cash flow score stands out as favorable at 4, while all other metrics—return on equity, return on assets, debt to equity, price to earnings, and price to book—score very unfavorably at 1, reflecting significant challenges in profitability and valuation measures.
Analysis of the company’s bankruptcy risk
Boston Scientific’s Altman Z-Score of 4.57 places it firmly in the safe zone, indicating a low risk of bankruptcy and strong financial stability:

Is the company in good financial health?
The Piotroski Score diagram provides insight into Boston Scientific’s financial health based on nine criteria:

With a Piotroski Score of 5, Boston Scientific shows average financial strength. This middling score suggests mixed signals in profitability, leverage, and efficiency, indicating neither strong nor poor financial health.
Competitive Landscape & Sector Positioning
This sector analysis examines Boston Scientific Corporation’s strategic positioning, revenue segments, and key products. I will evaluate whether the company maintains a competitive advantage over its main competitors.
Strategic Positioning
Boston Scientific concentrates on medical devices across Cardiovascular and MedSurg segments, showing steady revenue growth in both. It maintains a strong geographic presence, with about 64% of 2025 sales from the US and 36% international, reflecting a balanced yet US-centric market exposure.
Revenue by Segment
This pie chart illustrates Boston Scientific Corporation’s revenue distribution by segment for fiscal year 2025, highlighting the company’s primary business drivers.
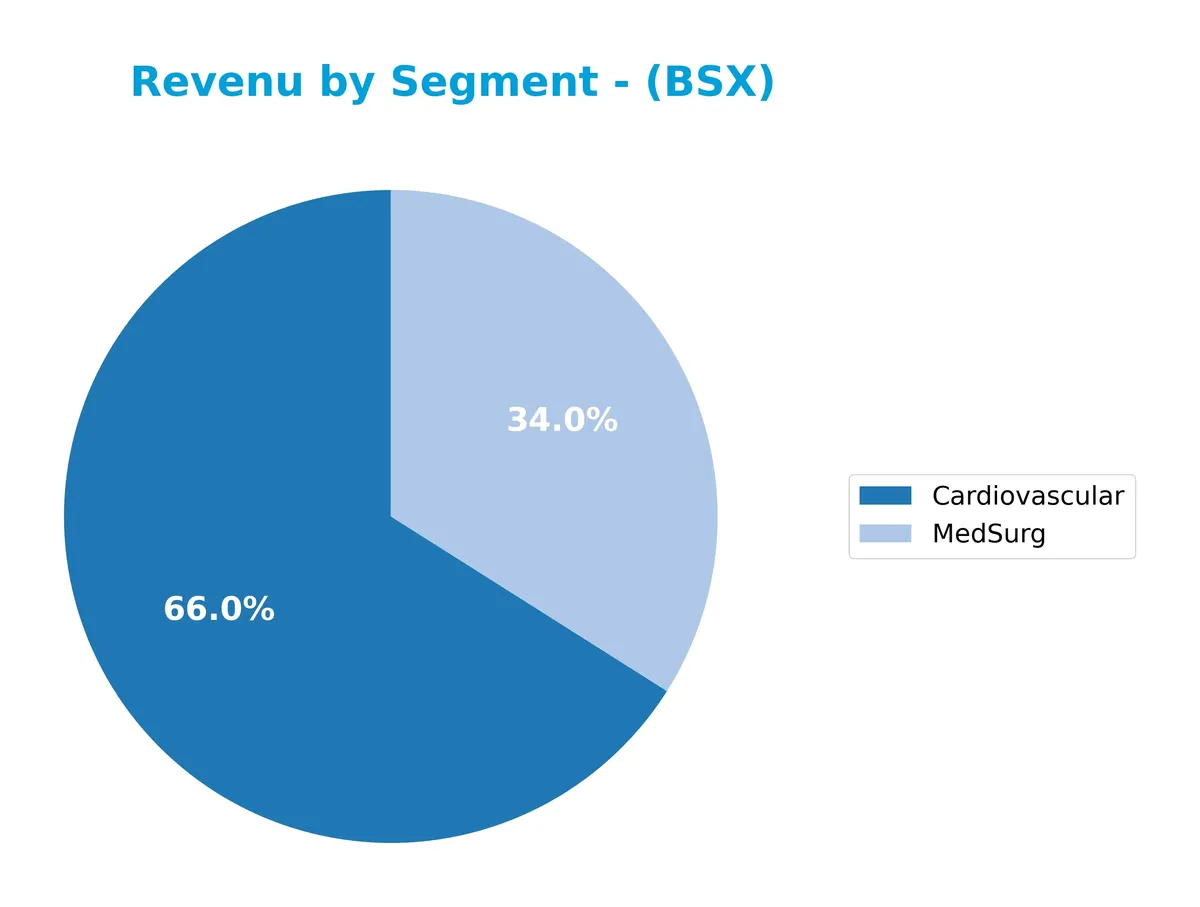
Cardiovascular leads Boston Scientific’s revenue, generating $13.3B in 2025, up from $10.8B in 2024, showing strong momentum. MedSurg follows with $6.8B, also growing steadily. The focus clearly remains on Cardiovascular, reflecting strategic emphasis on high-margin, innovative products. This concentration suggests both opportunity and risk, as reliance on one segment could impact resilience if market dynamics shift.
Key Products & Brands
The table below summarizes Boston Scientific Corporation’s main products and brands by segment and use:
| Product | Description |
|---|---|
| Cardiovascular | Devices for coronary artery disease, including drug-eluting stents, balloon catheters, and wires. |
| MedSurg | Medical devices for gastrointestinal, pulmonary, urological, and pelvic conditions. |
| Cardiac Rhythm Management | Implantable cardioverter defibrillators, pacemakers, and cardiac resynchronization therapy devices. |
| Electrophysiology | Catheters and mapping systems for diagnosing and treating heart rhythm disorders. |
| Endoscopy | Technologies to diagnose and treat gastrointestinal and pulmonary conditions. |
| Interventional Cardiology | Products for percutaneous coronary interventions and structural heart therapies. |
| Neuromodulation | Spinal cord stimulators and deep brain stimulation systems for chronic pain management. |
| Peripheral Interventions | Stents, atherectomy systems, and embolization devices for arterial and venous diseases. |
| Urology / Women’s Health | Devices addressing urological and pelvic health conditions. |
Boston Scientific’s portfolio spans cardiovascular, surgical, and neuromodulation devices. Cardiovascular products dominate revenue, reflecting strong market demand and innovation in interventional cardiology. MedSurg also contributes significantly, emphasizing diverse therapeutic areas.
Main Competitors
Boston Scientific Corporation faces competition from 10 key players in the Medical – Devices industry, listed here by market capitalization:
| Competitor | Market Cap. |
|---|---|
| Abbott Laboratories | 216B |
| Boston Scientific Corporation | 140B |
| Stryker Corporation | 133B |
| Medtronic plc | 123B |
| Edwards Lifesciences Corporation | 50B |
| DexCom, Inc. | 26B |
| STERIS plc | 25B |
| Insulet Corporation | 20B |
| Zimmer Biomet Holdings, Inc. | 18B |
| Align Technology, Inc. | 11B |
Boston Scientific ranks 2nd among its 10 main competitors, with a market cap about 52% of the leader, Abbott Laboratories. The company trades above both the average market cap of the top 10 (76B) and the sector median (38B). It maintains a significant 91% gap to Abbott Laboratories, highlighting a strong but clearly second-tier scale in the sector.
Comparisons with competitors
Check out how we compare the company to its competitors:
Does Boston Scientific Corporation have a competitive advantage?
Boston Scientific demonstrates a sustainable competitive advantage, consistently earning a return on invested capital (ROIC) 2.4% above its weighted average cost of capital (WACC). Its ROIC trend shows a 33.7% growth over 2021-2025, indicating efficient capital use and increasing profitability.
Looking ahead, Boston Scientific’s diverse product portfolio across MedSurg, Rhythm and Neuro, and Cardiovascular segments supports growth. Expanding international revenue—from $4.2B in 2020 to $7.2B in 2025—suggests opportunities in new markets and continued innovation in interventional medical technologies.
SWOT Analysis
This analysis highlights Boston Scientific’s key strategic factors to guide investment decisions.
Strengths
- strong global medical device portfolio
- favorable income statement with 92.86% positive metrics
- very favorable moat with ROIC > WACC by 2.4x
Weaknesses
- high valuation multiples (PE 48.9, PB 5.8)
- moderate ROIC of 8.8% limits capital efficiency
- no dividend yield to attract income investors
Opportunities
- expanding non-US revenue base
- growing demand for minimally invasive medical devices
- innovation in cardiac rhythm management and neurostimulation
Threats
- regulatory risks in healthcare sector
- competitive pressure from larger medtech firms
- potential pricing pressures due to healthcare cost containment
Boston Scientific’s robust fundamentals and innovation-driven moat support growth. Valuation and capital efficiency warrant cautious entry points. Strategic focus should balance expansion with margin discipline amid regulatory and competitive challenges.
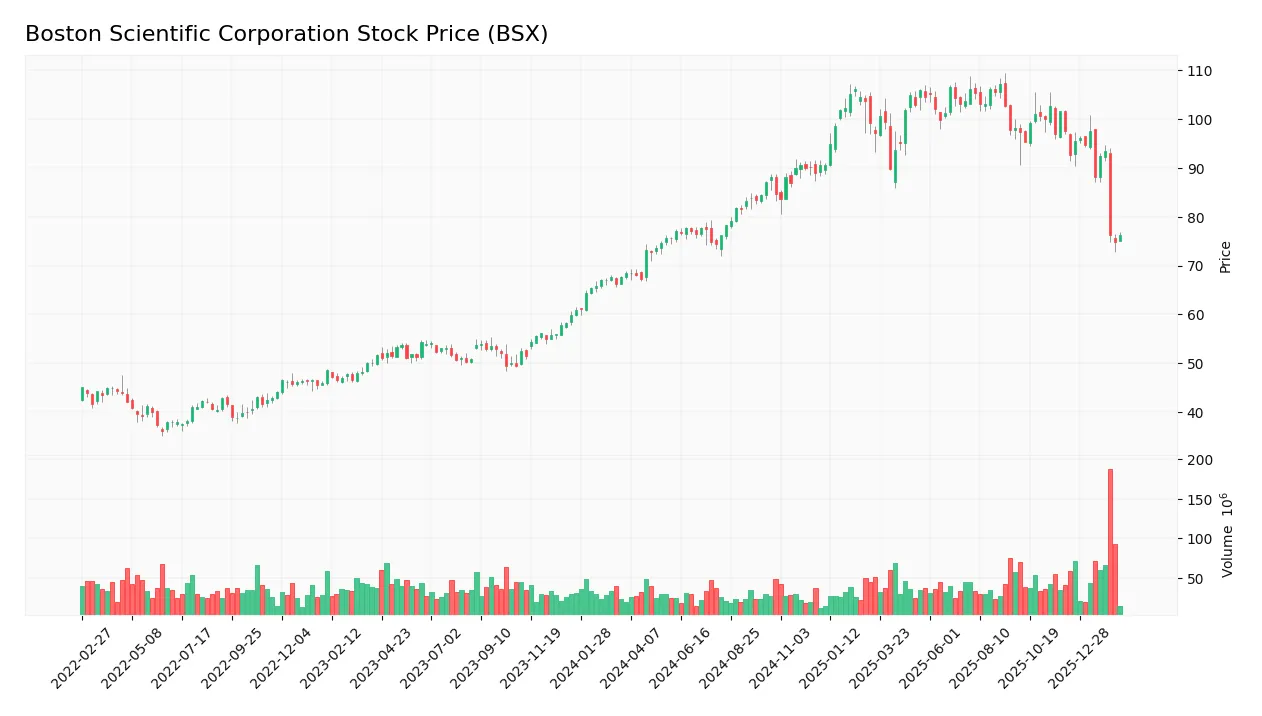
Stock Price Action Analysis
The weekly stock chart of Boston Scientific Corporation (BSX) highlights price movements and volatility over the recent period:
Trend Analysis
Over the past 12 months, BSX’s stock rose 11.39%, indicating a bullish trend despite deceleration in momentum. The price ranged from a low of 67.33 to a high of 107.22, with volatility at 11.58%. However, from December 2025 to February 2026, the trend reversed, dropping 21.77%, signaling short-term weakness.
Volume Analysis
Trading volumes have increased overall, with buyers accounting for 53.78% of 4.31B shares traded, signaling buyer-driven activity. However, in the last three months, sellers dominated 63.1% of volume, indicating a shift to seller-driven pressure and waning investor confidence.
Target Prices
Analysts set a target price consensus that suggests moderate upside potential for Boston Scientific Corporation.
| Target Low | Target High | Consensus |
|---|---|---|
| 94 | 130 | 108.35 |
The target range reflects cautious optimism, with a consensus price implying a steady appreciation from current levels.

Don’t Let Luck Decide Your Entry Point
Optimize your entry points with our advanced ProRealTime indicators. You’ll get efficient buy signals with precise price targets for maximum performance. Start outperforming now!
Analyst & Consumer Opinions
This section examines analyst ratings and consumer feedback concerning Boston Scientific Corporation’s recent performance and market perception.
Stock Grades
Here are the latest verified grades for Boston Scientific Corporation from leading financial firms:
| Grading Company | Action | New Grade | Date |
|---|---|---|---|
| BTIG | Maintain | Buy | 2026-02-09 |
| Truist Securities | Maintain | Buy | 2026-02-05 |
| RBC Capital | Maintain | Outperform | 2026-02-05 |
| Stifel | Maintain | Buy | 2026-02-05 |
| Baird | Maintain | Outperform | 2026-02-05 |
| TD Cowen | Maintain | Buy | 2026-02-05 |
| UBS | Maintain | Buy | 2026-02-05 |
| Evercore ISI Group | Maintain | Outperform | 2026-02-05 |
| Morgan Stanley | Maintain | Overweight | 2026-02-05 |
| Needham | Maintain | Buy | 2026-02-05 |
The consensus strongly favors Boston Scientific, with the majority maintaining Buy or Outperform ratings. No downgrades appear, indicating stable positive sentiment.
Consumer Opinions
Boston Scientific Corporation enjoys a mix of praise and criticism from its consumers, reflecting its complex role in the medical device sector.
| Positive Reviews | Negative Reviews |
|---|---|
| “Innovative products that improve patient outcomes.” | “Customer service response times can be slow.” |
| “High-quality devices with reliable performance.” | “Pricing feels steep compared to competitors.” |
| “Strong commitment to research and development.” | “Occasional delays in product availability.” |
Consumers consistently acknowledge Boston Scientific’s innovation and product quality. However, concerns about customer service and pricing recur, indicating areas for operational improvement.
Risk Analysis
Below is a summary table of key risks Boston Scientific faces, highlighting their likelihood and potential impact:
| Category | Description | Probability | Impact |
|---|---|---|---|
| Valuation Risk | Elevated P/E of 48.9 and P/B of 5.82 suggest the stock trades at a premium, risking correction. | High | High |
| Operational Risk | Asset turnover at 0.46 signals lower efficiency compared to sector peers, limiting growth. | Medium | Medium |
| Financial Health | Altman Z-Score of 4.57 places the company in a safe zone, indicating low bankruptcy risk. | Low | Low |
| Profitability Risk | ROE at 11.9% and ROIC at 8.8% are neutral, showing moderate returns on capital deployed. | Medium | Medium |
| Dividend Risk | Zero dividend yield may deter income-focused investors, affecting stock demand. | High | Low |
The most pressing risks for Boston Scientific are valuation and operational efficiency. The premium multiples expose investors to correction if growth falters. Meanwhile, the below-average asset turnover may constrain margin expansion. However, strong liquidity and a robust Altman Z-Score mitigate bankruptcy concerns, supporting a stable financial foundation.
Should You Buy Boston Scientific Corporation?
Boston Scientific Corporation appears to be creating value with a durable moat supported by a growing ROIC well above WACC. Despite very favorable competitive positioning, profitability and leverage profiles suggest operational challenges, reflected in a cautious C- rating overall.
Strength & Efficiency Pillars
Boston Scientific Corporation demonstrates robust operational efficiency with a net margin of 14.38% and an EBIT margin of 18.6%. The company’s return on invested capital (ROIC) stands at 8.8%, comfortably above its weighted average cost of capital (WACC) at 6.39%, confirming it as a clear value creator. Despite a moderate return on equity (ROE) of 11.91%, the firm exhibits strong gross margins of 69.01%, supporting sustainable profitability and competitive positioning in the medical devices sector.
Weaknesses and Drawbacks
While Boston Scientific’s Altman Z-Score at 4.57 places it securely in the safe zone, valuation metrics signal caution. The price-to-earnings ratio of 48.91 and price-to-book ratio of 5.82 indicate a premium market valuation that may limit upside. Additionally, the recent period shows seller dominance with buyers at just 36.9%, suggesting short-term market pressure. The unfavorable asset turnover of 0.46 points to potential inefficiencies in asset utilization, which could weigh on future returns.
Our Final Verdict about Boston Scientific Corporation
Boston Scientific presents a fundamentally strong profile with operational efficiency and a value-creating moat. However, despite a bullish long-term trend, recent seller dominance and stretched valuation metrics suggest a cautious stance. This profile might appear attractive for long-term exposure but may warrant a wait-and-see approach for improved entry points amid current market pressures.
Disclaimer: This content is for informational purposes only and does not constitute financial, investment, or other professional advice. Investing in financial markets involves a significant risk of loss, and past performance is not indicative of future results.
Additional Resources
- Boston Scientific Corporation (BSX) Maintains Analyst Ratings Amid Target Adjustments – Yahoo Finance (Feb 15, 2026)
- Assetmark Inc. Sells 82,501 Shares of Boston Scientific Corporation $BSX – MarketBeat (Feb 16, 2026)
- Peering Into Boston Scientific Corp’s Recent Short Interest – Sahm (Feb 16, 2026)
- Boston Scientific announces results for fourth quarter and full year 2025 – PR Newswire (Feb 04, 2026)
- Boston Scientific to participate in TD Cowen’s 46th Annual Health Care Conference (2026-02-13) – Seeking Alpha (Feb 13, 2026)
For more information about Boston Scientific Corporation, please visit the official website: bostonscientific.com