Home > Analyses > Consumer Cyclical > Booking Holdings Inc.
Booking Holdings transforms how millions experience travel and dining worldwide. It commands the travel services sector with flagship platforms like Booking.com, Priceline, and KAYAK, reshaping online reservations through innovation and superior user experience. Renowned for its technological edge and global reach, the company sets industry standards in convenience and choice. As travel rebounds and competition intensifies, I ask: does Booking Holdings’ financial strength still support its lofty valuation and future growth?

Table of contents
Business Model & Company Overview
Booking Holdings Inc., founded in 1997 and headquartered in Norwalk, Connecticut, commands a dominant position in the travel services industry. Its portfolio forms a cohesive ecosystem, including Booking.com, Priceline, Agoda, Rentalcars.com, KAYAK, and OpenTable, all unified by the core mission to simplify global travel and dining reservations. This integrated approach enhances user experience and fuels its leadership in online travel and restaurant booking worldwide.
The company’s revenue engine balances online accommodation, flight, and car rental reservations with dynamic price comparison and restaurant booking services. Its broad footprint spans the Americas, Europe, and Asia, creating diversified, recurring revenue streams. Booking Holdings’ economic moat lies in its vast network effect and brand recognition, shaping the future of digital travel commerce.
Financial Performance & Fundamental Metrics
I will analyze Booking Holdings Inc.’s income statement, key financial ratios, and dividend payout policy to assess its financial health and shareholder returns.
Income Statement
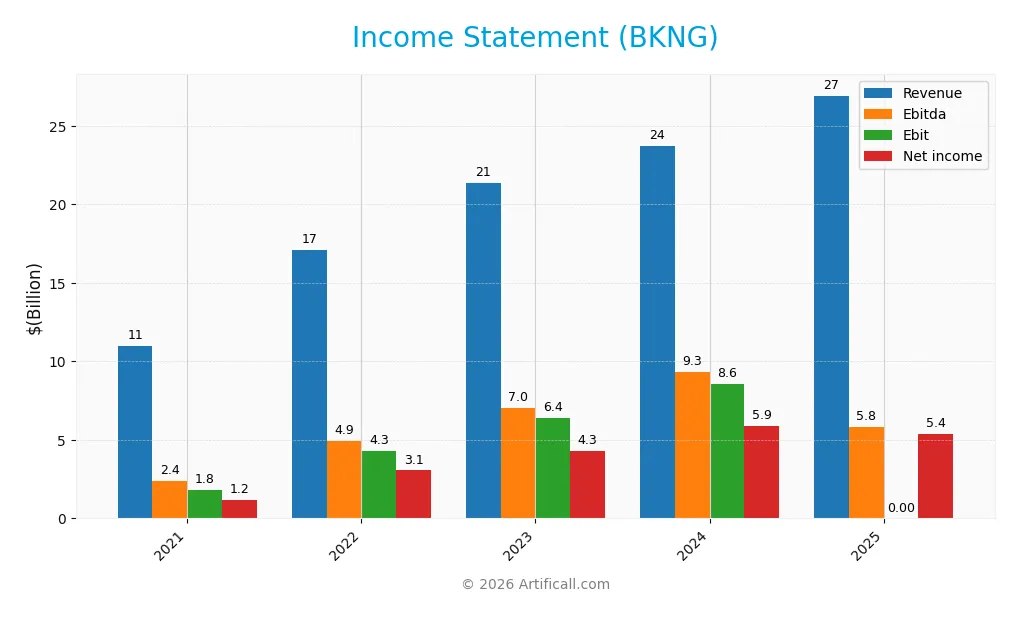
This table summarizes Booking Holdings Inc.’s key income statement figures for fiscal years 2021 through 2025, reflecting revenue growth and profitability trends.
| 2021 | 2022 | 2023 | 2024 | 2025 | |
|---|---|---|---|---|---|
| Revenue | 10.96B | 17.09B | 21.37B | 23.74B | 26.92B |
| Cost of Revenue | 0 | 0 | 0 | 0 | 0 |
| Operating Expenses | 8.46B | 11.99B | 15.53B | 16.18B | 18.09B |
| Gross Profit | 10.96B | 17.09B | 21.37B | 23.74B | 0 |
| EBITDA | 2.40B | 4.92B | 7.04B | 9.34B | 5.84B |
| EBIT | 1.80B | 4.31B | 6.38B | 8.59B | 0 |
| Interest Expense | 0.33B | 0.39B | 0.90B | 1.30B | 1.62B |
| Net Income | 1.17B | 3.06B | 4.29B | 5.88B | 5.40B |
| EPS | 28.39 | 76.70 | 118.67 | 174.96 | 166.52 |
| Filing Date | 2022-02-23 | 2023-02-23 | 2024-02-22 | 2025-02-20 | 2026-02-18 |
Income Statement Evolution
Booking Holdings Inc. shows strong revenue growth, expanding 146% from 2021 to 2025, with a 13.4% increase in the latest year. Net income surged 364% over five years but declined 19% in 2025, reflecting margin pressure. The net margin improved overall but fell recently. Operating expenses grew in line with revenue, maintaining operational leverage.
Is the Income Statement Favorable?
The 2025 income statement reveals solid fundamentals supported by a 20% net margin and favorable interest expense ratio at -6%. However, gross profit and EBIT margins registered as zero, signaling accounting or classification nuances. EBITDA remains robust at $5.8B. Overall, the income statement balances strong top-line growth and profitability with some margin volatility.
Financial Ratios
The table below summarizes key financial ratios for Booking Holdings Inc. over the past five fiscal years, providing insight into profitability, valuation, liquidity, leverage, and efficiency metrics:
| Ratios | 2021 | 2022 | 2023 | 2024 | 2025 |
|---|---|---|---|---|---|
| Net Margin | 10.6% | 17.9% | 20.1% | 24.8% | 20.1% |
| ROE | 18.9% | 110.0% | -156.3% | -146.3% | -96.9% |
| ROIC | 10.2% | 22.9% | 35.2% | 44.1% | 48.3% |
| P/E | 84.5 | 26.3 | 29.9 | 28.4 | 32.2 |
| P/B | 15.9 | 28.9 | -46.7 | -41.6 | -31.2 |
| Current Ratio | 2.10 | 1.86 | 1.28 | 1.31 | 1.33 |
| Quick Ratio | 2.10 | 1.86 | 1.28 | 1.31 | 1.33 |
| D/E | 1.83 | 4.69 | -5.39 | -4.25 | -3.46 |
| Debt-to-Assets | 47.7% | 51.4% | 60.7% | 61.6% | 65.9% |
| Interest Coverage | 7.47 | 13.0 | 6.51 | 5.83 | -5.46 |
| Asset Turnover | 0.46 | 0.67 | 0.88 | 0.86 | 0.92 |
| Fixed Asset Turnover | 8.31 | 13.0 | 14.3 | 17.1 | 18.7 |
| Dividend Yield | 0.0% | 0.0% | 0.0% | 0.7% | 0.7% |
Evolution of Financial Ratios
Booking Holdings’ Return on Equity (ROE) sharply declined to -96.88% in 2025, signaling significant challenges in shareholder profitability. The Current Ratio remained relatively stable around 1.3, indicating consistent liquidity. The Debt-to-Equity ratio turned negative, reflecting unusual leverage structure shifts. Profitability margins showed some volatility but net margin stayed favorable near 20%.
Are the Financial Ratios Fovorable?
In 2025, profitability is mixed: net margin and ROIC are favorable, but ROE and interest coverage are deeply unfavorable. Liquidity ratios are neutral to favorable, with a Current Ratio at 1.33 and quick ratio favorable. Leverage metrics are concerning; debt-to-assets is high at 65.9%, while debt-to-equity is unusually negative but considered favorable. Asset efficiency is neutral, and the dividend yield remains low and unfavorable. Overall, the financial ratios present a slightly favorable stance tempered by notable risks.
Shareholder Return Policy
Booking Holdings Inc. resumed dividends in 2024 with a payout ratio near 20%, rising to 23% in 2025, and a modest yield around 0.7%. The company supports distributions with strong free cash flow coverage and maintains share buybacks, reflecting balanced capital allocation.
This approach indicates a cautious return of capital while preserving cash flow for operations and growth. The moderate payout and consistent buybacks suggest a sustainable shareholder return framework aligned with long-term value creation, avoiding risks from over-distribution or excessive leverage.
Score analysis
The following radar chart displays Booking Holdings Inc.’s key valuation and financial performance scores for a comprehensive overview:
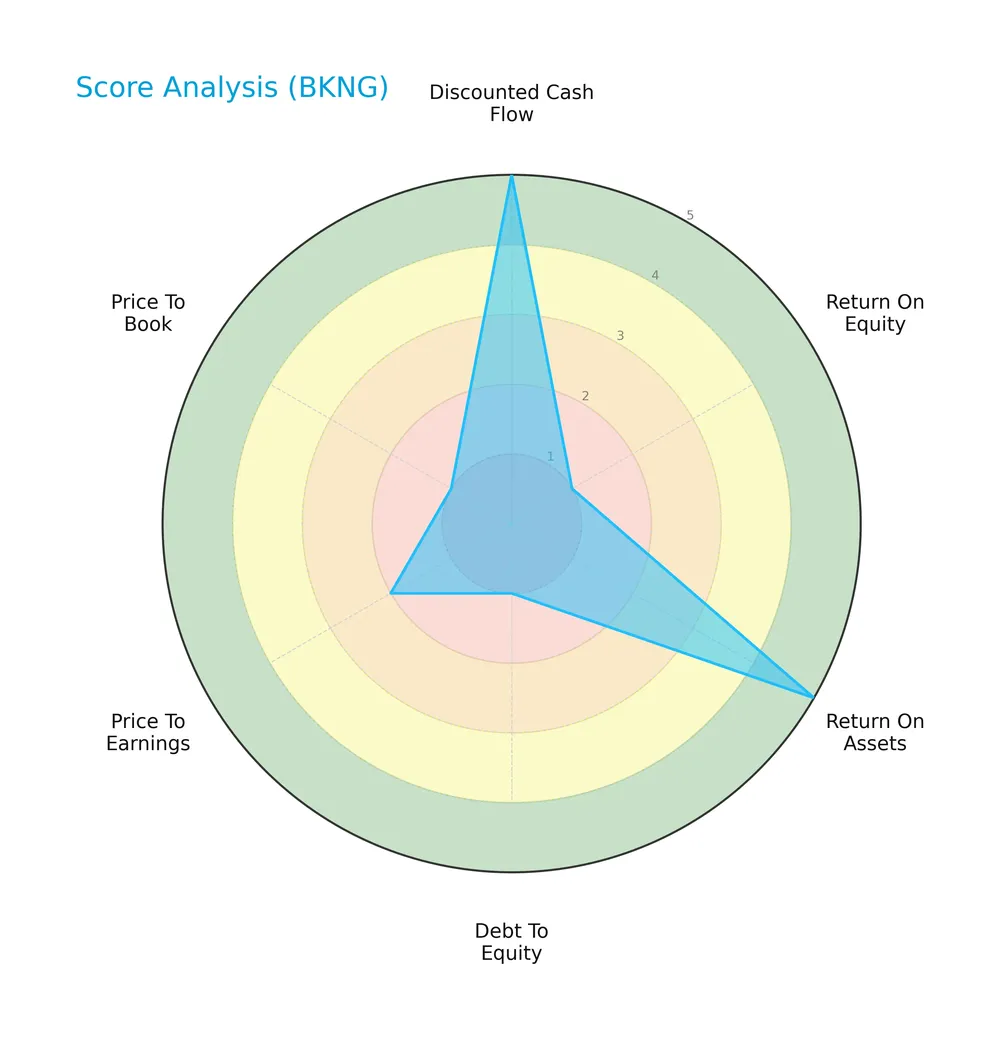
The company scores very favorably on discounted cash flow and return on assets, indicating strong cash generation and asset efficiency. However, it shows very unfavorable results on return on equity, debt-to-equity, and price-to-book ratios. Price-to-earnings is also unfavorable, reflecting valuation concerns.
Analysis of the company’s bankruptcy risk
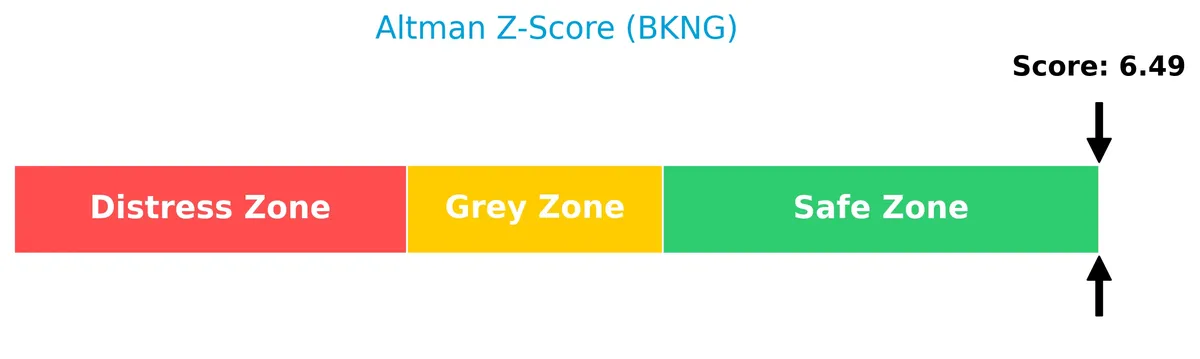
Booking Holdings Inc. sits comfortably in the safe zone, signaling a very low risk of bankruptcy based on its Altman Z-Score:
Is the company in good financial health?
The Piotroski Score diagram highlights the company’s financial strength as assessed by nine key criteria:

With a strong Piotroski Score of 7, Booking Holdings demonstrates solid financial health, signaling operational efficiency and prudent management, though not at the highest tier of financial robustness.
Competitive Landscape & Sector Positioning
This sector analysis reviews Booking Holdings Inc.’s strategic positioning, revenue streams, products, and competitors. I will assess whether the company holds a competitive advantage in the travel services industry.
Strategic Positioning
Booking Holdings concentrates its geographic exposure heavily in the Netherlands with $21.7B revenue in 2025, while U.S. sales lag at $2.6B. Its product portfolio spans accommodation, car rentals, flights, and restaurant reservations, balancing agency and merchant revenues near $8B and $17.8B respectively.
Revenue by Segment
The pie chart illustrates Booking Holdings Inc.’s revenue breakdown by segment for the fiscal year 2025, highlighting the key business drivers.
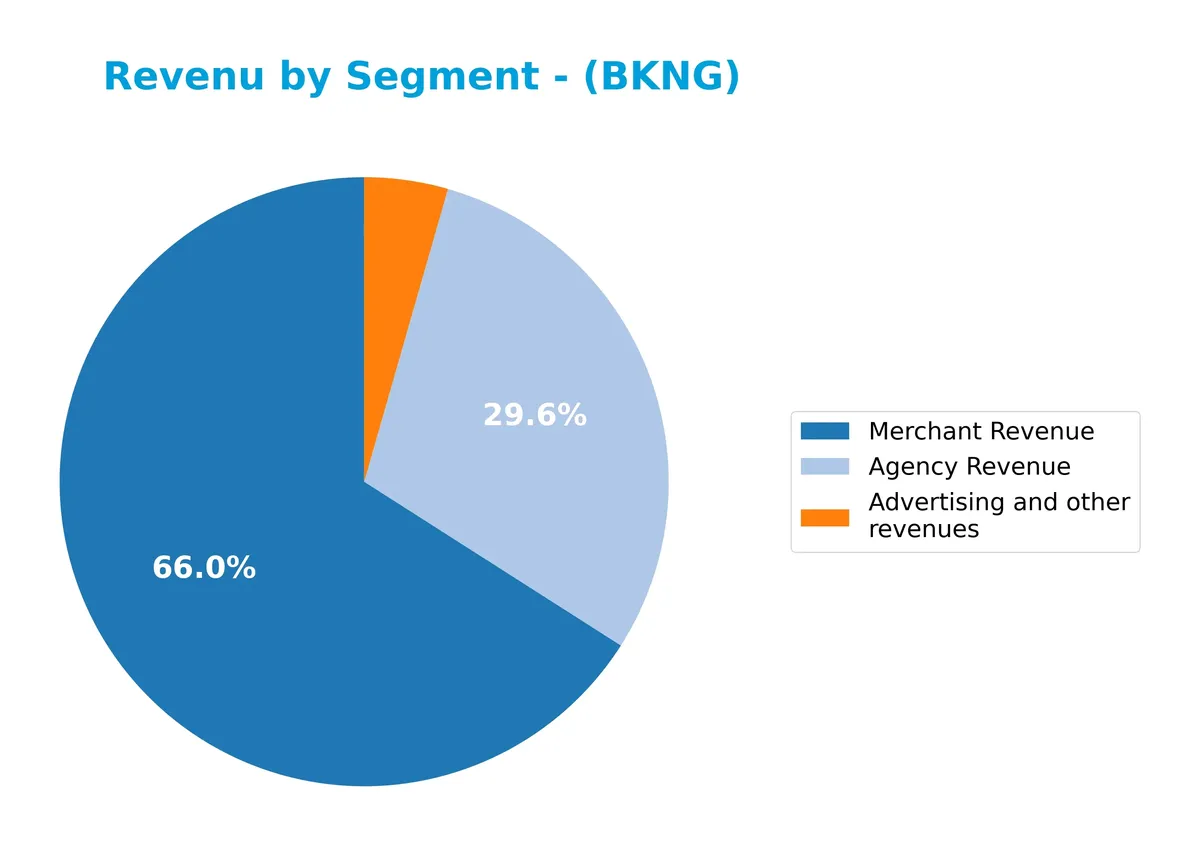
In 2025, Merchant Revenue leads decisively at 17.8B, reflecting strong direct booking growth. Agency Revenue follows with 8B, showing a modest decline from prior years. Advertising and other revenues grew to 1.2B, indicating expanding monetization avenues. The shift toward Merchant Revenue underscores Booking’s strategic focus on higher-margin, asset-light models, though Agency Revenue’s slowdown signals cautious investor attention to segment concentration risks.
Key Products & Brands
Booking Holdings Inc. generates revenue through multiple travel and restaurant reservation platforms and related services:
| Product | Description |
|---|---|
| Booking.com | Online accommodation reservations worldwide. |
| Rentalcars.com | Online rental car reservation services. |
| Priceline | Online travel reservations including hotels, flights, rental cars, vacation packages, and cruises. |
| Agoda | Online accommodation, flight, ground transportation, and activity reservations in Asia-Pacific. |
| KAYAK | Online travel price comparison across flights, hotels, and rental cars. |
| OpenTable | Online restaurant reservation platform. |
| Advertising and other revenues | Income from advertising and ancillary services related to travel and restaurants. |
| Agency Revenue | Commissions earned from booking services as an agent for suppliers. |
| Merchant Revenue | Earnings from acting as the merchant of record in travel transactions, capturing price markups. |
Booking Holdings operates a diverse portfolio of travel and restaurant booking brands. Its revenue streams split between merchant and agency models, complemented by advertising income. This mix supports resilience across travel cycles.
Main Competitors
In total, 5 competitors operate in the Travel Services industry, with the table listing the top 5 leaders by market capitalization:
| Competitor | Market Cap. |
|---|---|
| Booking Holdings Inc. | 172B |
| Airbnb, Inc. | 82.3B |
| Royal Caribbean Cruises Ltd. | 77.2B |
| Expedia Group, Inc. | 33.1B |
| Norwegian Cruise Line Holdings Ltd. | 10.4B |
Booking Holdings Inc. ranks 1st among its competitors, boasting a market cap 80% the size of the sector’s top player. It stands well above both the average market cap of the top 10 peers (75B) and the sector median (77B). The company holds a significant 67% lead over its closest competitor below.
Comparisons with competitors
Check out how we compare the company to its competitors:
Does BKNG have a competitive advantage?
Booking Holdings Inc. shows a very favorable competitive advantage, consistently creating value with ROIC exceeding WACC by nearly 40%. Its ROIC trend has grown over 370%, signaling efficient capital use and rising profitability.
The company leverages its diverse portfolio—including Booking.com, Agoda, and KAYAK—to expand globally. Continued innovation in travel services and entry into new markets suggest potential for sustained growth in the evolving travel industry.
SWOT Analysis
This SWOT analysis highlights Booking Holdings Inc.’s core strategic factors to guide investment decisions.
Strengths
- strong global brand portfolio
- very favorable moat with growing ROIC
- robust revenue growth over 5 years
Weaknesses
- negative ROE signals shareholder returns issues
- high debt-to-assets ratio at 65.9%
- recent decline in net margin and EPS growth
Opportunities
- expanding travel market post-pandemic
- increasing digital adoption in travel bookings
- potential for geographic revenue diversification
Threats
- intense competition in online travel services
- macroeconomic sensitivity to travel demand
- regulatory risks in multiple jurisdictions
Booking Holdings shows solid competitive advantages and growth potential. However, weaknesses in profitability ratios and leverage warrant caution. The company’s strategy should prioritize margin recovery and debt management while leveraging its strong brand ecosystem.
Stock Price Action Analysis
The weekly stock chart below depicts Booking Holdings Inc.’s price movements over the past 12 months, highlighting key highs, lows, and trend shifts:
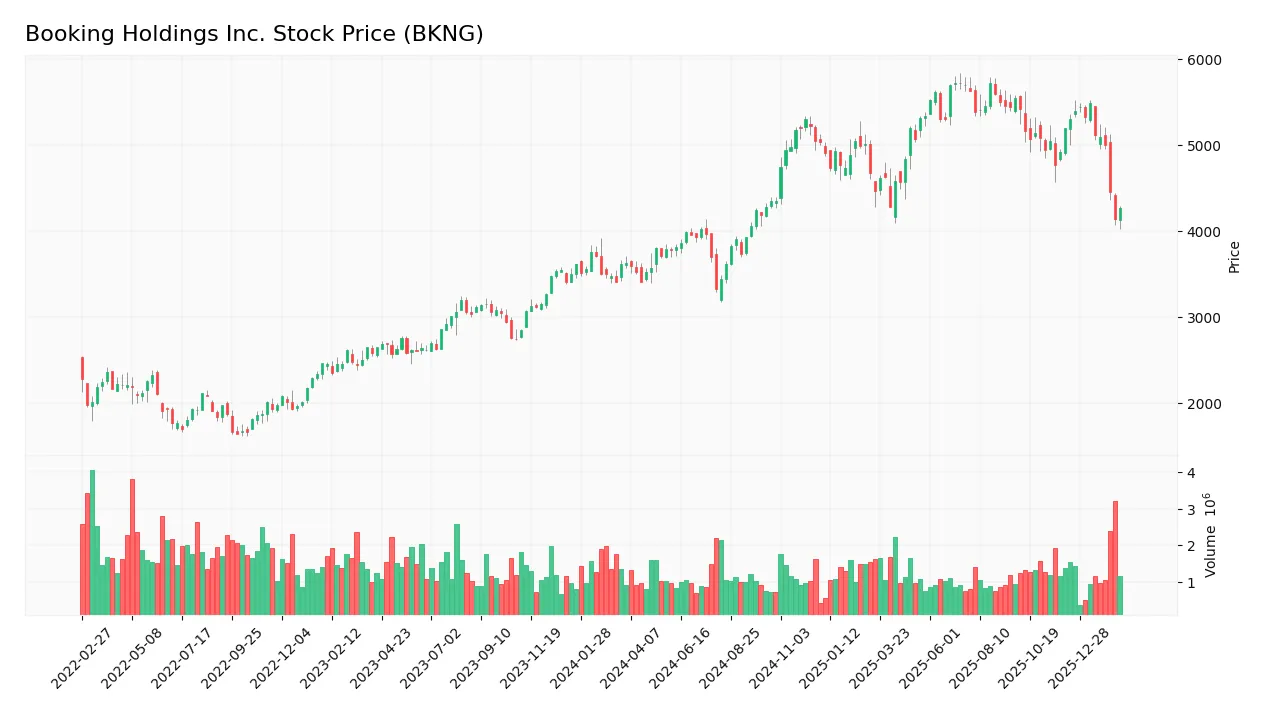
Trend Analysis
Over the past 12 months, BKNG’s stock rose 17.7%, confirming a bullish trend despite decelerating momentum. The price ranged from a low of 3,328 to a high near 5,721. Recent weeks show a 17.8% decline, signaling short-term weakness but not negating the year-long positive trajectory.
Volume Analysis
Trading volume increased overall, with buyer participation at 52.2% historically, indicating generally buyer-driven activity. However, over the last three months, seller volume dominated at 57.8%, suggesting recent cautious or bearish sentiment amid rising market engagement.
Target Prices
Analysts project a solid upside for Booking Holdings Inc. with a consensus target reflecting confidence in its growth.
| Target Low | Target High | Consensus |
|---|---|---|
| 5,407 | 6,630 | 6,054 |
The target range suggests moderate volatility but a strong bullish sentiment overall. Analysts expect Booking Holdings to outperform key market benchmarks.

Don’t Let Luck Decide Your Entry Point
Optimize your entry points with our advanced ProRealTime indicators. You’ll get efficient buy signals with precise price targets for maximum performance. Start outperforming now!
Analyst & Consumer Opinions
This section examines Booking Holdings Inc.’s analyst ratings and consumer feedback to gauge market sentiment and user satisfaction.
Stock Grades
Here are the latest verified analyst grades for Booking Holdings Inc., reflecting current market sentiment:
| Grading Company | Action | New Grade | Date |
|---|---|---|---|
| BTIG | Maintain | Buy | 2026-02-13 |
| Wedbush | Maintain | Outperform | 2026-02-06 |
| Citizens | Downgrade | Market Perform | 2026-02-04 |
| Keybanc | Maintain | Overweight | 2026-02-04 |
| UBS | Maintain | Buy | 2026-02-03 |
| Wells Fargo | Maintain | Equal Weight | 2026-01-09 |
| Cantor Fitzgerald | Maintain | Neutral | 2026-01-08 |
| Argus Research | Maintain | Buy | 2026-01-06 |
| Bernstein | Maintain | Market Perform | 2026-01-06 |
| BTIG | Maintain | Buy | 2025-12-23 |
Most analysts maintain a positive stance, favoring Buy or Outperform grades. The only downgrade to Market Perform from Citizens signals some caution amid predominantly bullish views.
Consumer Opinions
Booking Holdings Inc. continues to evoke strong reactions from its global user base, reflecting its dominant position in online travel services.
| Positive Reviews | Negative Reviews |
|---|---|
| “Seamless booking experience with excellent customer support.” | “Prices tend to spike unexpectedly close to travel dates.” |
| “Wide range of options and competitive rates worldwide.” | “Occasional issues with cancellations and refunds.” |
| “User-friendly interface makes planning trips effortless.” | “Some listings have outdated or inaccurate information.” |
| “Reliable and fast confirmation of reservations.” | “Mobile app can be glitchy during peak usage times.” |
Overall, consumers praise Booking Holdings for its user-friendly platform and broad inventory. However, price volatility and occasional service hiccups remain recurring concerns. This mix suggests solid operational execution tempered by areas needing improvement in customer reliability.
Risk Analysis
Below is a summary table highlighting key risks for Booking Holdings Inc. in 2026:
| Category | Description | Probability | Impact |
|---|---|---|---|
| Financial Leverage | High debt-to-assets ratio at 65.93% raises solvency risk | Medium | High |
| Profitability | Negative ROE (-96.9%) signals poor equity returns | High | Medium |
| Interest Coverage | Near zero coverage indicates vulnerability to rate hikes | High | High |
| Valuation | Elevated P/E of 32.16 suggests overvaluation risk | Medium | Medium |
| Market Volatility | Beta at 1.19 exposes stock to above-market swings | Medium | Medium |
| Dividend Yield | Low yield at 0.72% reduces income appeal | Low | Low |
| Liquidity | Current ratio at 1.33 is adequate but not robust | Medium | Medium |
The most pressing risks are Booking’s high debt load combined with insufficient interest coverage, which threaten financial stability amid rising rates. Negative ROE contrasts sharply with strong ROIC, indicating capital allocation challenges. While the Altman Z-Score places the company in the safe zone, investors should watch leverage closely given industry cyclicality and macroeconomic uncertainty.
Should You Buy Booking Holdings Inc.?
Booking Holdings Inc. appears to demonstrate robust value creation supported by a very favorable moat with growing ROIC well above WACC. While its leverage profile might raise caution, the overall B- rating suggests a moderate investment profile with solid operational efficiency.
Strength & Efficiency Pillars
Booking Holdings Inc. exhibits strong operational efficiency with a net margin of 20.08% and an impressive ROIC of 48.32%. The company’s ROIC significantly exceeds its WACC of 8.48%, marking it as a clear value creator. Despite a negative ROE of -96.88%, the growing ROIC trend underscores a sustainable competitive advantage. Historically, firms with such ROIC dynamics typically generate shareholder value over market cycles, reflecting robust capital allocation and profitability improvements.
Weaknesses and Drawbacks
While Booking Holdings operates in a safe financial zone with an Altman Z-Score of 6.49, valuation and leverage metrics raise caution. The price-to-earnings ratio stands elevated at 32.16, signaling a premium market valuation that may limit upside. Debt-to-assets ratio is a concerning 65.93%, indicating high leverage, and interest coverage is near zero, which poses risks if earnings falter. Additionally, recent market activity shows slight seller dominance (42.24% buyers), suggesting short-term headwinds.
Our Final Verdict about Booking Holdings Inc.
Booking Holdings may appear attractive for long-term exposure, given its strong ROIC and safe solvency profile. However, despite a bullish overall trend, recent seller dominance advises a cautious, wait-and-see approach for an improved entry point. The elevated valuation and leverage caution investors to monitor liquidity and market sentiment closely before committing significant capital.
Disclaimer: This content is for informational purposes only and does not constitute financial, investment, or other professional advice. Investing in financial markets involves a significant risk of loss, and past performance is not indicative of future results.
Additional Resources
- Booking Holdings sees strong growth as it uses generative AI to its advantage (BKNG:NASDAQ) – Seeking Alpha (Feb 18, 2026)
- Booking Holdings Posts Strong 2025 Results, Plans Stock Split – TipRanks (Feb 18, 2026)
- An Overview of Booking Holdings’s Earnings – Benzinga (Feb 17, 2026)
- Booking Holdings (BKNG) Q4 Earnings: How Key Metrics Compare to Wall Street Estimates – Yahoo Finance (Feb 18, 2026)
- Booking Holdings (BKNG) Releases Q4 2025 Earnings: Revenue Beats but EPS Misses – Quiver Quantitative (Feb 18, 2026)
For more information about Booking Holdings Inc., please visit the official website: bookingholdings.com