Home > Analyses > Technology > Block, Inc.
Block, Inc. revolutionizes how millions of merchants and consumers transact daily, blending seamless payment hardware with powerful software. Its flagship Square ecosystem dominates small business point-of-sale solutions, while Cash App transforms personal finance with ease and innovation. Renowned for driving digital commerce forward, Block sets the pace in fintech infrastructure. Yet, as competition intensifies and valuation debates persist, I ask: do Block’s fundamentals still support its ambitious growth trajectory?

Table of contents
Business Model & Company Overview
Block, Inc., founded in 2009 and headquartered in Oakland, CA, stands as a leader in software infrastructure for digital payments. It orchestrates an integrated ecosystem of hardware and software solutions that empower sellers to process card payments seamlessly. From Magstripe readers to Square Terminal devices, Block combines physical tools with innovative point-of-sale software, advancing its mission to simplify commerce worldwide.
The company generates revenue through a balanced mix of hardware sales, subscription-based software, and transaction fees, fueling its growth across the Americas, Europe, and Asia. Its diverse portfolio includes Cash App and Weebly, expanding beyond payments into digital finance and web services. Block’s robust economic moat lies in its comprehensive platform, which locks in customers through a seamless blend of technology and services shaping the future of commerce.
Financial Performance & Fundamental Metrics
I analyze Block, Inc.’s income statement, key financial ratios, and dividend payout policy to evaluate its operational efficiency and shareholder returns.
Income Statement
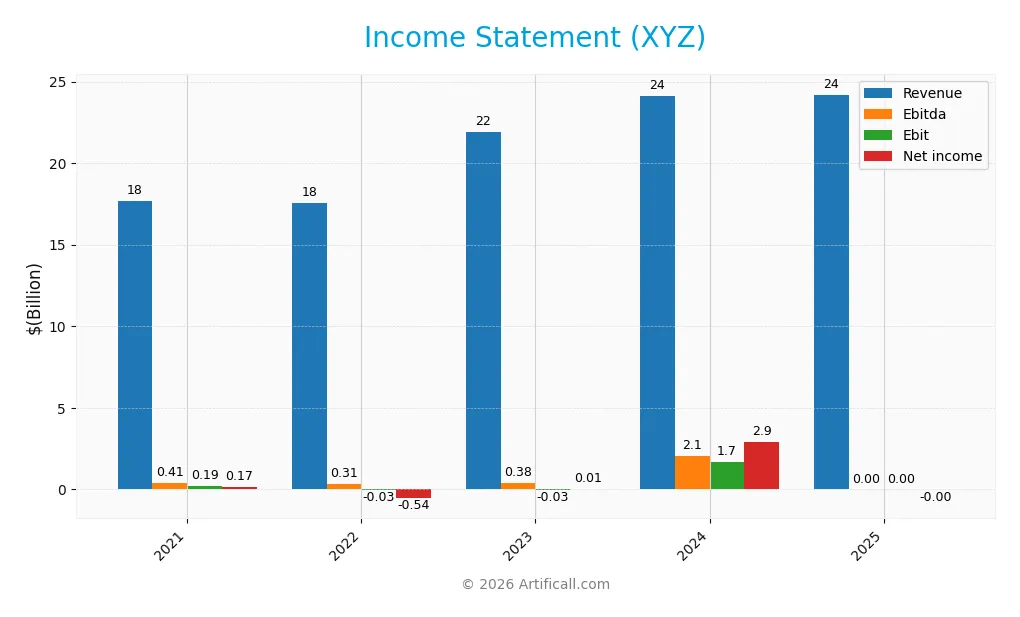
The table below presents key income statement figures for Block, Inc. (ticker: XYZ) over the past five fiscal years, reflecting revenue, expenses, profits, and earnings per share.
| 2021 | 2022 | 2023 | 2024 | 2025 | |
|---|---|---|---|---|---|
| Revenue | 17.66B | 17.53B | 21.92B | 24.12B | 24.19B |
| Cost of Revenue | 13.35B | 11.54B | 14.58B | 15.23B | 13.83B |
| Operating Expenses | 3.85B | 6.62B | 6.70B | 7.99B | 8.65B |
| Gross Profit | 4.31B | 5.99B | 7.33B | 8.89B | -39K |
| EBITDA | 408M | 313M | 379M | 2.06B | 0 |
| EBIT | 191M | -27M | -29M | 1.69B | 0 |
| Interest Expense | 33M | 36M | 0 | 9M | 1M |
| Net Income | 166M | -541M | 10M | 2.90B | -1M |
| EPS | 0.36 | -0.93 | 0.016 | 4.7 | 2.13 |
| Filing Date | 2022-02-24 | 2023-02-23 | 2024-02-22 | 2025-02-24 | 2026-02-26 |
Income Statement Evolution
Block, Inc.’s revenue grew 37% from 2021 to 2025, yet growth slowed to 0.3% in the latest year. Gross profit collapsed from $8.9B in 2024 to near zero in 2025, dragging gross margin into negative territory. Operating expenses rose, compressing EBIT margin to zero and net margin to slightly below zero in 2025.
Is the Income Statement Favorable?
The 2025 income statement shows weak fundamentals. Despite $24.2B revenue, gross profit nearly vanished, signaling cost control challenges. Operating income remained positive at $1.7B, but net income was negative at -$1.4M. Interest expense stayed low, a rare bright spot. Overall, profitability metrics deteriorated sharply, reflecting an unfavorable income profile.
Financial Ratios
The table below summarizes key financial ratios for Block, Inc. (ticker: XYZ) over the last five fiscal years:
| Ratios | 2021 | 2022 | 2023 | 2024 | 2025 |
|---|---|---|---|---|---|
| Net Margin | 0.9% | -3.1% | 0.04% | 12.0% | 0.0% |
| ROE | 5.1% | -3.1% | 0.05% | 13.6% | -0.01% |
| ROIC | 5.1% | -2.6% | 1.8% | 3.0% | -12.8% |
| P/E | 445.3 | -67.3 | 4819.4 | 18.1 | -27,945.9 |
| P/B | 22.6 | 2.11 | 2.52 | 2.47 | 1.79 |
| Current Ratio | 1.94 | 1.85 | 2.01 | 2.33 | -0.18 |
| Quick Ratio | 1.92 | 1.84 | 1.99 | 2.31 | -0.18 |
| D/E | 1.69 | 0.37 | 0.32 | 0.37 | 0.11 |
| Debt-to-Assets | 40.0% | 20.2% | 18.4% | 21.5% | -117.8% |
| Interest Coverage | 13.8 | -17.2 | 0.0 | 95.9 | 1,373.3 |
| Asset Turnover | 1.27 | 0.56 | 0.66 | 0.66 | -12.1 |
| Fixed Asset Turnover | 24.1 | 25.0 | 40.5 | 45.1 | -156.1 |
| Dividend Yield | 0.0% | 0.0% | 0.0% | 0.0% | 0.0% |
Evolution of Financial Ratios
From 2021 to 2025, Block, Inc.’s Return on Equity (ROE) declined sharply, turning negative by 2025. The Current Ratio showed stability around 2.0 until 2024 but plunged to -0.18 in 2025, signaling liquidity stress. Debt-to-Equity Ratio steadily decreased from 1.69 in 2021 to 0.11 in 2025, reflecting lower leverage. Profitability weakened markedly, with net margins slipping into negative territory by 2025.
Are the Financial Ratios Favorable?
In 2025, most ratios appear unfavorable. Profitability metrics such as ROE (-0.01%) and net margin (-0.01%) are negative, indicating losses. Liquidity ratios, including the Current Ratio (-0.18) and Quick Ratio (-0.18), signal poor short-term financial health. Leverage remains low (Debt-to-Equity 0.11), a rare positive. Market multiples show mixed signals: a very negative PE ratio contrasts with a neutral Price-to-Book of 1.79. Overall, the ratio profile is predominantly unfavorable.
Shareholder Return Policy
Block, Inc. does not pay dividends, reflecting negative net income in 2025 and a focus on reinvestment. The company maintains share buybacks, aligning with a strategy that prioritizes growth and capital allocation over immediate shareholder payouts.
This approach suits a high-growth phase but carries risks if operational profitability remains weak. Share buybacks may support valuation, yet sustained negative margins raise questions about long-term distribution sustainability and value creation.
Score analysis
The following radar chart presents a comprehensive view of the company’s key financial scores for 2026:
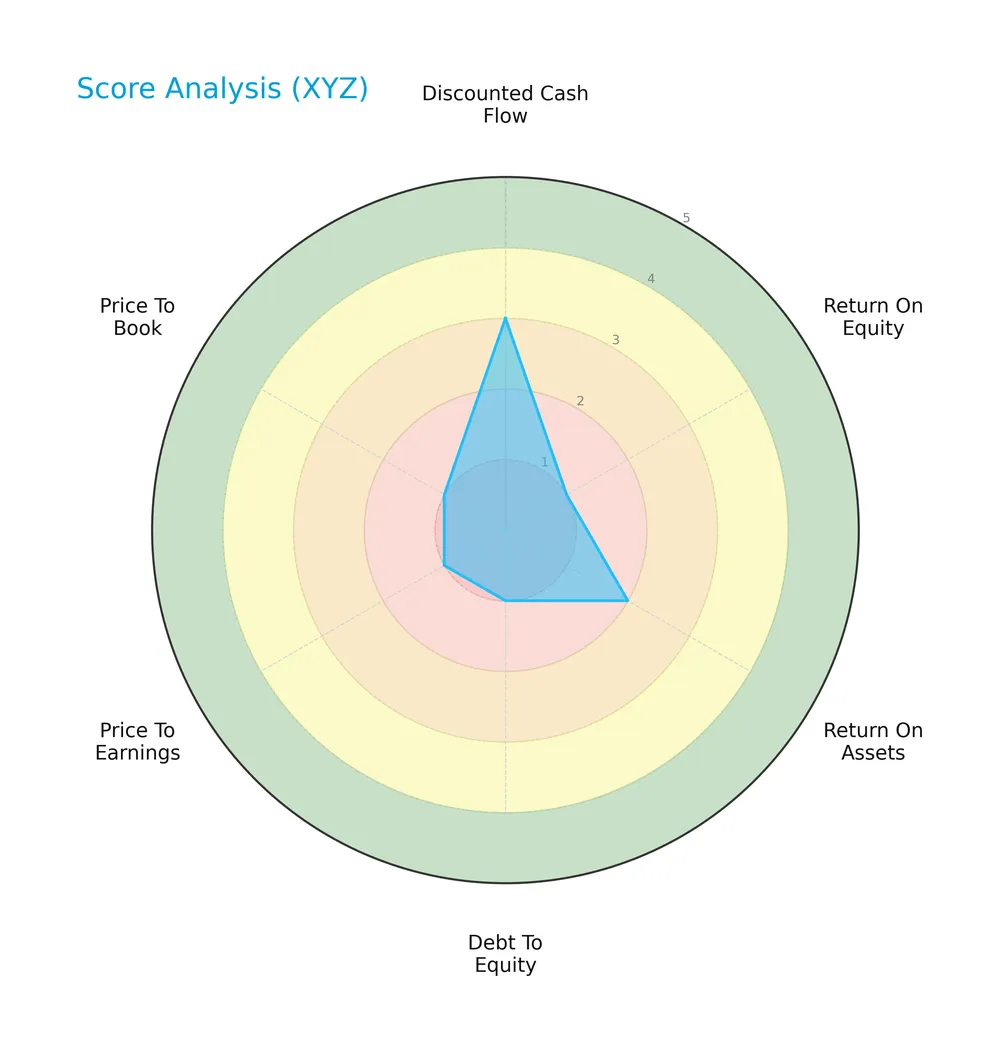
Block, Inc. scores moderately in discounted cash flow with a 3, but shows significant weakness across return on equity, return on assets, debt to equity, price to earnings, and price to book ratios, all rated very unfavorable or unfavorable.
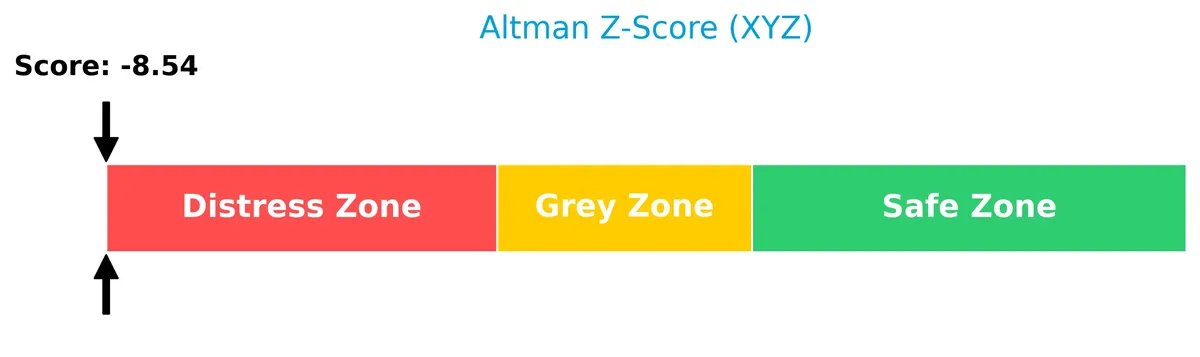
Analysis of the company’s bankruptcy risk
The Altman Z-Score indicates that Block, Inc. is deep in the distress zone, signaling a high risk of bankruptcy:
Is the company in good financial health?
This Piotroski diagram illustrates Block, Inc.’s financial health based on its score of 5, reflecting an average status:

With a Piotroski Score of 5, the company shows moderate financial strength but lacks the robustness seen in stronger firms, indicating some caution is warranted.
Competitive Landscape & Sector Positioning
This sector analysis examines Block, Inc.’s strategic positioning, revenue segments, key products, and main competitors. I will assess whether Block, Inc. holds a competitive advantage over its peers in the software infrastructure industry.
Strategic Positioning
Block, Inc. maintains a diversified product portfolio spanning software, hardware, transaction services, and cryptocurrency assets, generating over $25B in 2025 revenue. Its geographic exposure concentrates heavily in the US, with roughly 90% of sales, while expanding modestly into select international markets.
Revenue by Segment
This pie chart illustrates Block, Inc.’s revenue distribution across key segments for fiscal year 2024, highlighting the company’s diversified income streams.
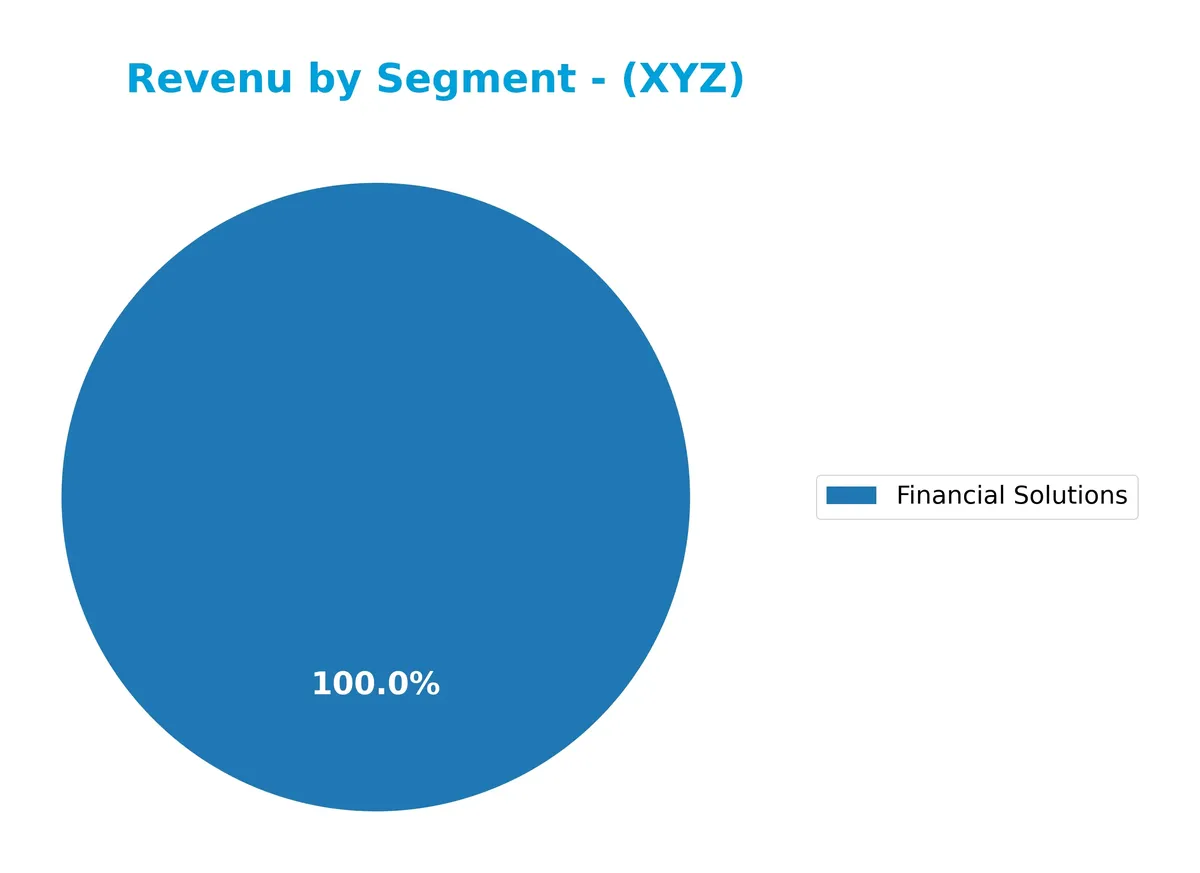
In 2024, Cryptocurrency Denominated Assets led with $10.2B, followed by Software and Data Products at $7.2B. Transaction revenue contributed $6.6B, while Hardware remained a minor segment at $143M. The 2024 data shows growth concentration in crypto and software sectors, signaling a strategic shift toward digital assets and data-driven services. Hardware’s limited scale suggests ongoing focus on high-margin, scalable solutions over physical products.
Key Products & Brands
The table below summarizes Block, Inc.’s key products and brands with their respective descriptions:
| Product | Description |
|---|---|
| Magstripe Reader | Hardware enabling swiped transactions of magnetic stripe cards. |
| Contactless and Chip Reader | Accepts Europay, MasterCard, Visa (EMV) chip cards and Near Field Communication payments. |
| Square Stand | Hardware that converts an iPad into a payment terminal or full point of sale solution. |
| Square Register | Combines hardware, point-of-sale software, and payments technology into one system. |
| Square Terminal | Payment device and receipt printer accepting tap, dip, and swipe payments, replacing traditional keypad terminals. |
| Square Point of Sale | Software product for payment processing and business management. |
| Square Appointments | Software solution for scheduling and appointment management. |
| Square for Retail | Software tailored to retail business operations. |
| Square for Restaurants | Software designed for restaurant management. |
| Square Online & Checkout | E-commerce platform and online payment processing tools. |
| Square Invoices | Software for billing and invoicing clients. |
| Square Virtual Terminal | Software enabling payment acceptance without physical hardware. |
| Square Team Management | Software for workforce scheduling and management. |
| Square Contracts | Contract management software. |
| Square Loyalty, Marketing, and Gift Cards | Suite of software tools for customer retention and marketing programs. |
| Square Dashboard | Analytics and reporting platform for business insights. |
| Developer Platform | APIs and software development kits for integrating payment solutions. |
| Cash App | Mobile app to send, spend, and store money. |
| Weebly | Website hosting and domain registration services. |
Block, Inc. offers a comprehensive range of hardware and software solutions centered on payment processing and business management. Its portfolio spans physical devices, e-commerce, customer engagement, and financial transaction tools, serving multiple international markets.
Main Competitors
There are 32 competitors in the sector; below is a table of the top 10 leaders by market capitalization:
| Competitor | Market Cap. |
|---|---|
| Microsoft Corporation | 3.52T |
| Oracle Corporation | 553B |
| Palantir Technologies Inc. | 383B |
| Adobe Inc. | 140B |
| Palo Alto Networks, Inc. | 120B |
| CrowdStrike Holdings, Inc. | 113B |
| Synopsys, Inc. | 92B |
| Cloudflare, Inc. | 69B |
| Fortinet, Inc. | 59B |
| Block, Inc. | 40B |
Block, Inc. ranks 10th among 32 competitors, with a market cap just 0.95% of the leader, Microsoft. The company sits below the top 10 average market cap of 508B but remains above the sector median of 18.8B. It maintains a 79% gap from its closest competitor above, underscoring a significant scale difference in the upper tier.
Comparisons with competitors
Check out how we compare the company to its competitors:
Does Block have a competitive advantage?
Block, Inc. currently lacks a competitive advantage, as its ROIC significantly trails its WACC, indicating value destruction and declining profitability. This unfavorable moat status signals inefficient capital use and shrinking economic profits.
Looking ahead, Block’s extensive product suite across payments hardware, software, and digital services targets diverse markets including the US, Canada, Japan, Australia, and Europe. These offerings present opportunities to capture new customers and expand internationally despite recent financial challenges.
SWOT Analysis
This SWOT analysis highlights Block, Inc.’s core strategic factors shaping its competitive position and growth potential.
Strengths
- Strong brand in payment solutions
- Diverse hardware and software ecosystem
- Expanding international revenue base
Weaknesses
- Negative net margin and ROIC
- Declining profitability and value destruction
- Weak liquidity ratios and financial distress signals
Opportunities
- Growth in global digital payments
- Expansion into new markets and services
- Leveraging developer platform for innovation
Threats
- Intense competition in FinTech sector
- Regulatory risks across multiple countries
- Macroeconomic headwinds affecting consumer spending
Block, Inc. possesses robust product diversity and brand strength but faces severe profitability and liquidity challenges. Strategic focus must prioritize improving operational efficiency and safeguarding against rising competitive and regulatory pressures.
Stock Price Action Analysis
The weekly stock chart of Block, Inc. (XYZ) over the past 12 months highlights notable price fluctuations and a clear directional trend:
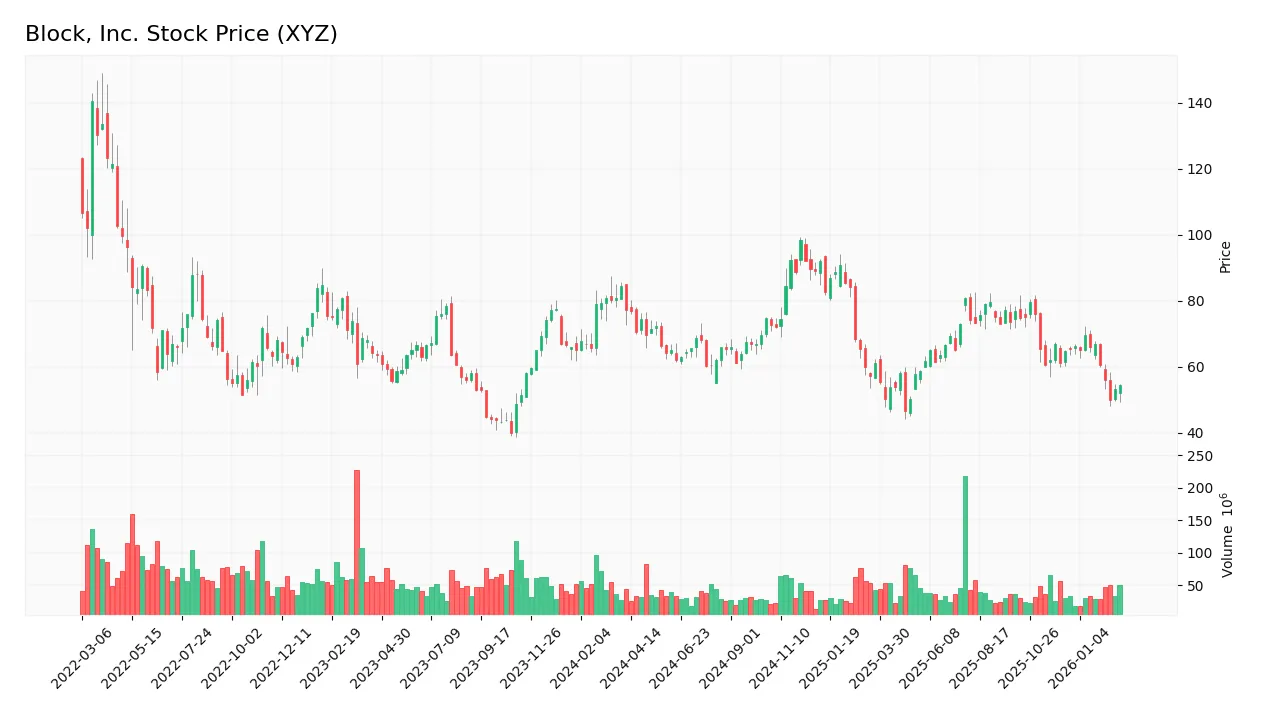
Trend Analysis
Over the past 12 months, the stock price of Block, Inc. fell by 29.34%, indicating a bearish trend. The price range spans from a high of 98.25 to a low of 46.53, with volatility measured by a 10.68 standard deviation. The trend shows deceleration in downward momentum.
Volume Analysis
Trading volume over the last three months shows a slightly buyer-dominant pattern with 55.67% buyer activity. Volume is decreasing, reflecting reduced market participation. This suggests cautious investor sentiment amid the ongoing bearish price trend.
Target Prices
Analysts set a clear target consensus for Block, Inc., reflecting cautious optimism.
| Target Low | Target High | Consensus |
|---|---|---|
| 70 | 100 | 84.67 |
The target range indicates moderate upside potential, with analysts expecting steady growth but acknowledging market volatility.

Don’t Let Luck Decide Your Entry Point
Optimize your entry points with our advanced ProRealTime indicators. You’ll get efficient buy signals with precise price targets for maximum performance. Start outperforming now!
Analyst & Consumer Opinions
This section examines analyst ratings and consumer feedback regarding Block, Inc. (XYZ) to provide balanced insight.
Stock Grades
Here are the latest verified grades for Block, Inc. from reputable financial institutions:
| Grading Company | Action | New Grade | Date |
|---|---|---|---|
| Cantor Fitzgerald | Maintain | Overweight | 2026-02-17 |
| Macquarie | Maintain | Neutral | 2026-02-11 |
| Citigroup | Maintain | Buy | 2026-02-05 |
| Piper Sandler | Maintain | Underweight | 2026-01-14 |
| Keefe, Bruyette & Woods | Maintain | Outperform | 2026-01-02 |
| Needham | Maintain | Buy | 2025-11-24 |
| B of A Securities | Maintain | Buy | 2025-11-21 |
| Morgan Stanley | Maintain | Equal Weight | 2025-11-21 |
| BTIG | Maintain | Buy | 2025-11-20 |
| RBC Capital | Maintain | Outperform | 2025-11-20 |
The ratings remain stable with a clear tilt toward positive sentiment, as most analysts maintain buy or outperform grades. However, a few hold and underweight views reflect some caution within the market.
Consumer Opinions
Block, Inc. sparks strong reactions from its user base, reflecting its bold moves in fintech and payments.
| Positive Reviews | Negative Reviews |
|---|---|
| Seamless payment processing speeds up checkout. | Occasional app glitches disrupt transactions. |
| Innovative features keep the platform ahead. | Customer support response times can lag. |
| Transparent fee structure builds trust. | Limited international coverage frustrates users. |
Consumers praise Block, Inc. for its innovation and transparent fees, which drive loyalty. However, technical hiccups and slower support responses remain persistent concerns.
Risk Analysis
Below is a summary of key risks facing Block, Inc., including their likelihood and potential impact:
| Category | Description | Probability | Impact |
|---|---|---|---|
| Financial Health | Negative ROIC (-12.8%) versus high WACC (15.3%) signals value destruction and poor capital use. | High | High |
| Liquidity Risk | Negative current ratio (-0.18) and quick ratio indicate potential short-term liquidity strain. | High | Medium |
| Profitability | Net margin near zero (-0.01%) and negative ROE reflect weak earnings generation. | High | High |
| Bankruptcy Risk | Altman Z-score in distress zone (-8.54) suggests elevated bankruptcy probability. | Medium | High |
| Market Volatility | Beta of 2.67 implies high sensitivity to market swings, increasing share price volatility risk. | High | Medium |
| Debt Management | Favorable low debt/equity (0.11) and debt/assets (-117.8%) ratios reduce financial leverage risk. | Low | Low |
| Dividend Policy | No dividend yield poses risk for income-focused investors and may signal reinvestment needs. | Medium | Low |
The most pressing risk is Block’s persistent value destruction, highlighted by ROIC falling well below its WACC. This signals the company struggles to generate returns above its cost of capital. Coupled with liquidity concerns and a distressed Altman Z-score, this raises red flags about financial stability. Market volatility amplifies short-term risk, but low leverage provides some cushion. Investors must weigh these factors carefully amid ongoing operational challenges.
Should You Buy Block, Inc.?
Block, Inc. appears to be in financial distress, with declining profitability and a deteriorating moat indicated by negative ROIC trends. Despite manageable leverage concerns, its overall C- rating and average Piotroski score suggest a cautious outlook on value creation.
Strength & Efficiency Pillars
Block, Inc. shows limited operational efficiency with a net margin of -0.01% and negative return on equity and invested capital. Its ROIC at -12.82% falls well below its WACC of 15.28%, signaling value destruction rather than creation. While interest expense is minimal at 0.01%, the company’s profitability metrics remain unfavorable. Historically in this sector, such negative returns raise concerns about sustainable value generation.
Weaknesses and Drawbacks
Block, Inc. is in financial distress with an Altman Z-Score of -8.54, indicating a high bankruptcy risk. This severe solvency concern overshadows any operational metrics. The company’s current ratio is negative (-0.18), highlighting liquidity issues. Its price-to-earnings is effectively negative, and the debt-to-equity ratio is low but insufficient to offset poor fundamentals. These factors suggest urgent caution amid ongoing market pressure and deteriorating financial health.
Our Final Verdict about Block, Inc.
Despite some operational aspects, Block, Inc.’s solvency risk, confirmed by the distress-zone Altman Z-Score, renders its profile highly speculative. The company’s inability to generate positive returns and critical liquidity weaknesses make it too risky for conservative capital. Investors might consider this a high-risk case, requiring close monitoring for any turnaround signals before considering exposure.
Disclaimer: This content is for informational purposes only and does not constitute financial, investment, or other professional advice. Investing in financial markets involves a significant risk of loss, and past performance is not indicative of future results.
Additional Resources
- Block shares soar as much as 24% as company slashes workforce by nearly half – CNBC (Feb 26, 2026)
- Block Gears Up to Report Q4 Earnings: What’s in the Offing? – Yahoo Finance (Feb 24, 2026)
- Block (XYZ) Surges 25% After Slashing Workforce by Over 40% and Raising Profit Outlook – Bitcoin Magazine (Feb 26, 2026)
- Block’s Q4 2025 earnings go live ahead of today’s call – Stock Titan (Feb 26, 2026)
- Block layoffs: Tech company slashes staff by 40% – FOX 29 Philadelphia (Feb 27, 2026)
For more information about Block, Inc., please visit the official website: block.xyz