Home > Analyses > Financial Services > Blackstone Inc.
Blackstone Inc. transforms the fabric of global finance by steering capital into diverse, high-impact assets. It commands the alternative asset management industry with a robust portfolio spanning real estate, private equity, credit, and hedge funds. Known for pioneering innovative investment strategies, Blackstone blends deep market insight with operational expertise. As market dynamics evolve, I question whether Blackstone’s strong fundamentals still justify its premium valuation and growth outlook.

Table of contents
Business Model & Company Overview
Blackstone Inc., founded in 1985 and headquartered in New York City, stands as a dominant player in alternative asset management. The firm operates a cohesive ecosystem spanning real estate, private equity, hedge funds, credit, and multi-asset strategies. Its portfolio reflects deep expertise in early-stage companies and large-scale investment projects, integrating opportunistic real estate and diverse corporate transactions worldwide.
Blackstone’s revenue engine balances capital markets services with recurring management fees from its diversified funds. Its global footprint spans North America, Europe, and Asia, capturing value across real estate debt, buyouts, credit instruments, and hedge funds. This competitive advantage cements its economic moat, shaping the future of asset management through scale, diversification, and strategic market presence.
Financial Performance & Fundamental Metrics
I analyze Blackstone Inc.’s income statement, key financial ratios, and dividend payout policy to assess its operational efficiency and shareholder returns.
Income Statement
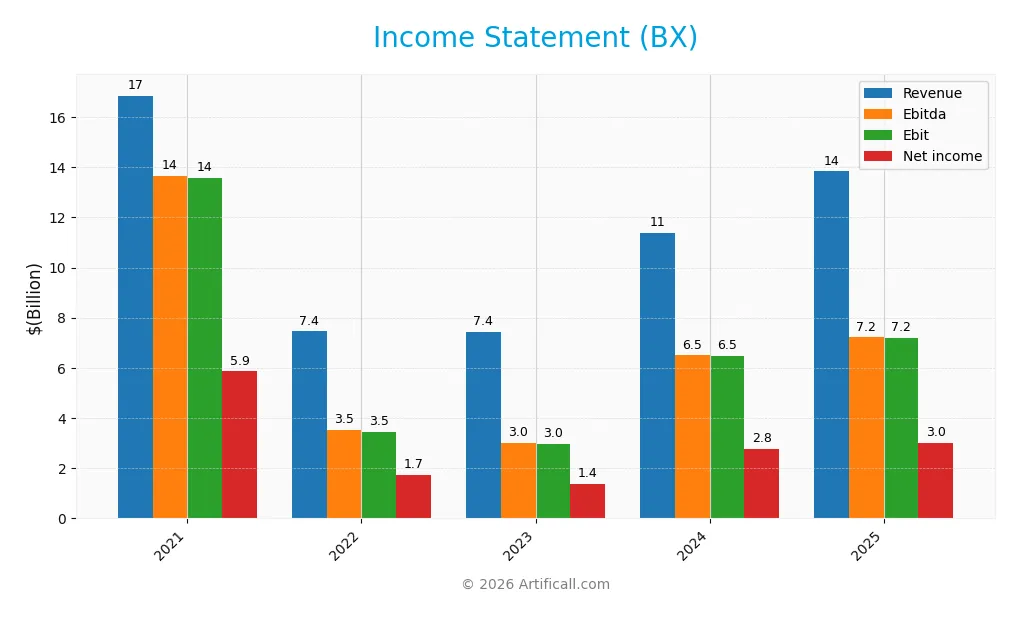
The table below summarizes Blackstone Inc.’s key income statement figures for the past five fiscal years, reflecting core profitability and earnings trends.
| 2021 | 2022 | 2023 | 2024 | 2025 | |
|---|---|---|---|---|---|
| Revenue | 16.9B | 7.4B | 7.4B | 11.4B | 13.8B |
| Cost of Revenue | 198M | 317M | 432M | 444M | 1.9B |
| Operating Expenses | 3.1B | 3.7B | 4.0B | 4.5B | 4.7B |
| Gross Profit | 16.7B | 7.1B | 7.0B | 10.9B | 11.9B |
| EBITDA | 13.6B | 3.5B | 3.0B | 6.5B | 7.2B |
| EBIT | 13.6B | 3.5B | 3.0B | 6.5B | 7.2B |
| Interest Expense | 198M | 317M | 432M | 444M | 508M |
| Net Income | 5.9B | 1.7B | 1.4B | 2.8B | 3.0B |
| EPS | 8.14 | 2.36 | 1.84 | 3.62 | 3.88 |
| Filing Date | 2022-02-25 | 2023-02-24 | 2024-01-25 | 2025-02-28 | 2026-02-27 |
Income Statement Evolution
Between 2021 and 2025, Blackstone’s revenue declined by 17.9%, while net income fell 48.5%. Despite this drop, gross margin remained strong at 86.1%, indicating efficient cost control. EBIT margin held favorably at 51.9%, showing operating profitability stability. However, net margin contracted by 37.2%, reflecting pressure on bottom-line profitability over the period.
Is the Income Statement Favorable?
In 2025, revenue rose 21.6% year-over-year, with gross profit up 8.9%, translating into an EBIT growth of 11.1%. Operating expenses scaled proportionately with revenue, maintaining margin structure. The net margin shrank by 10.6%, suggesting some cost or tax pressure. Overall, 64% of income statement metrics are favorable, supporting a generally positive fundamental assessment.
Financial Ratios
The table below summarizes key financial ratios for Blackstone Inc. from 2021 to 2025, highlighting profitability, valuation, liquidity, leverage, and efficiency metrics:
| Ratios | 2021 | 2022 | 2023 | 2024 | 2025 |
|---|---|---|---|---|---|
| Net Margin | 34.8% | 23.5% | 18.7% | 24.4% | 21.8% |
| ROE | 62.2% | 22.8% | 20.4% | 33.8% | 34.8% |
| ROIC | 30.7% | 7.2% | 6.4% | 12.5% | -48.3% |
| P/E | 15.9 | 31.4 | 69.6 | 47.6 | 39.9 |
| P/B | 9.9 | 7.2 | 14.2 | 16.1 | 13.9 |
| Current Ratio | 8.0 | 7.2 | 3.4 | 0 | 0 |
| Quick Ratio | 8.0 | 7.2 | 3.4 | 0 | 0 |
| D/E | 0.92 | 1.75 | 1.80 | 1.50 | 1.63 |
| Debt-to-Assets | 21.2% | 31.4% | 30.5% | 28.3% | 29.7% |
| Interest Coverage | 68.4 | 10.9 | 6.8 | 14.6 | 14.1 |
| Asset Turnover | 0.41 | 0.18 | 0.18 | 0.26 | 0.29 |
| Fixed Asset Turnover | 16.3 | 5.7 | 5.4 | 8.5 | 18.3 |
| Dividend Yield | 4.9% | 11.9% | 4.4% | 3.3% | 3.0% |
Evolution of Financial Ratios
From 2021 to 2025, Blackstone’s Return on Equity (ROE) declined from 62.16% to 34.84%, signaling slowing profitability. The Current Ratio fell sharply to zero in 2024 and 2025, indicating deteriorating liquidity. Debt-to-Equity ratio fluctuated, peaking at 1.80 in 2023 and settling at 1.63 in 2025, reflecting sustained leverage levels.
Are the Financial Ratios Favorable?
In 2025, profitability remains favorable with a net margin of 21.83% and ROE at 34.84%. However, liquidity ratios are unfavorable; the Current and Quick Ratios are zero, posing risk. Leverage is high with a Debt-to-Equity of 1.63 but manageable interest coverage at 14.12. Market valuation ratios like P/E at 39.87 and P/B at 13.89 are elevated, indicating expensive stock pricing. Overall, 57.14% of key ratios are unfavorable.
Shareholder Return Policy
Blackstone Inc. maintains a dividend payout ratio above 100%, with dividends per share declining from 8.80 in 2022 to 4.69 in 2025. The annual dividend yield ranges from 3.0% to 11.9%, supported by consistent free cash flow coverage near 100%. The company also executes share buybacks.
The high payout ratios may pressure sustainability, given fluctuations in dividend yield and share repurchases. While free cash flow coverage suggests coverage capability, the elevated payout ratio warrants monitoring to ensure long-term value creation aligns with shareholder interests.
Score analysis
The radar chart below displays key financial metric scores for Blackstone Inc. to highlight its valuation and profitability profile:
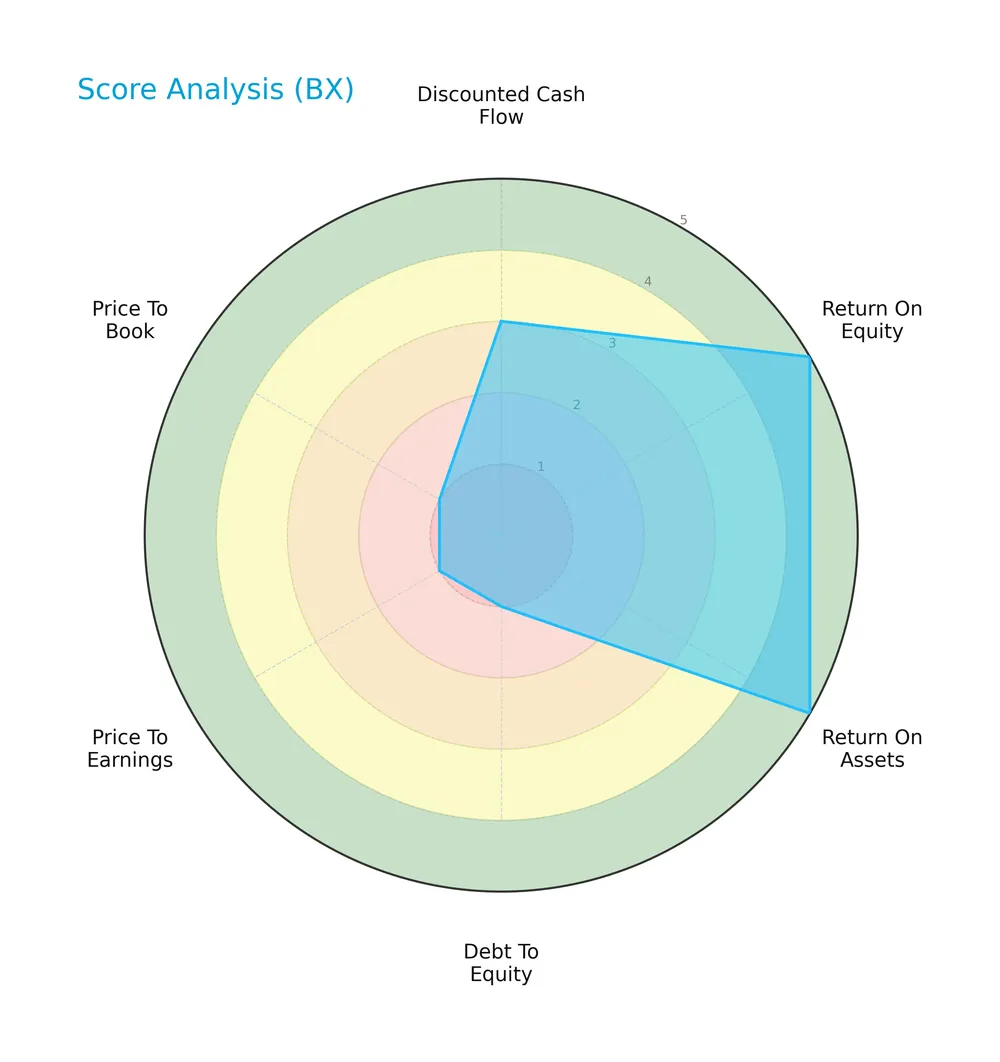
Blackstone shows very favorable profitability with top marks in return on equity and assets. However, valuation and leverage scores are very unfavorable, reflecting high price multiples and debt levels. The overall score stands at a moderate level.
Analysis of the company’s bankruptcy risk
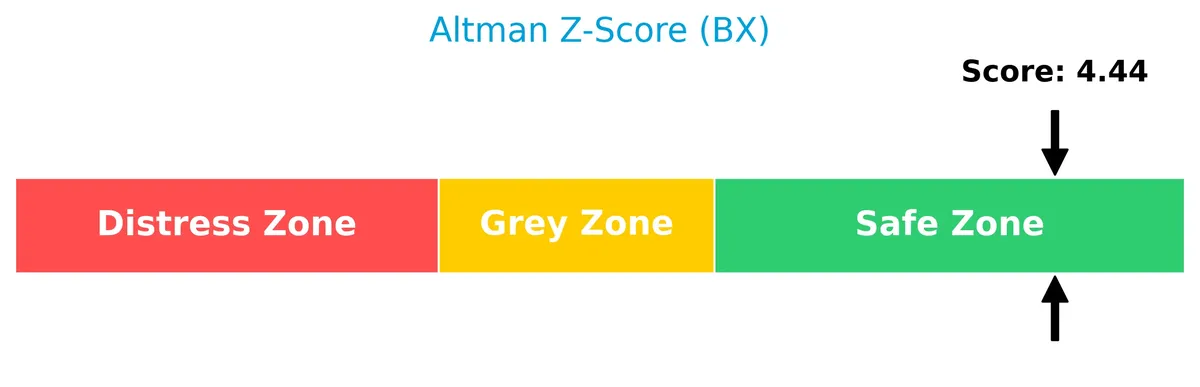
Blackstone’s Altman Z-Score places it confidently in the safe zone, indicating a low risk of bankruptcy:
Is the company in good financial health?
This Piotroski diagram illustrates Blackstone’s financial strength based on multiple key criteria:

A Piotroski score of 5 classifies the company’s financial health as average, suggesting moderate stability without strong indications of financial robustness or distress.
Competitive Landscape & Sector Positioning
This analysis explores Blackstone Inc.’s strategic positioning, revenue segments, key products, and main competitors. It will examine the firm’s competitive advantages within the asset management sector. I will assess whether Blackstone holds a sustainable edge over its rivals.
Strategic Positioning
Blackstone Inc. maintains a diversified portfolio spanning private equity, real estate, hedge funds, credit, and multi-asset strategies. Its geographic exposure includes North America, Europe, and Asia, reflecting a global footprint focused on early-stage investments and opportunistic real estate across key developed markets.
Revenue by Segment
This pie chart illustrates Blackstone Inc.’s revenue distribution by business segment for the fiscal year 2025, highlighting key contributors to its top-line growth.
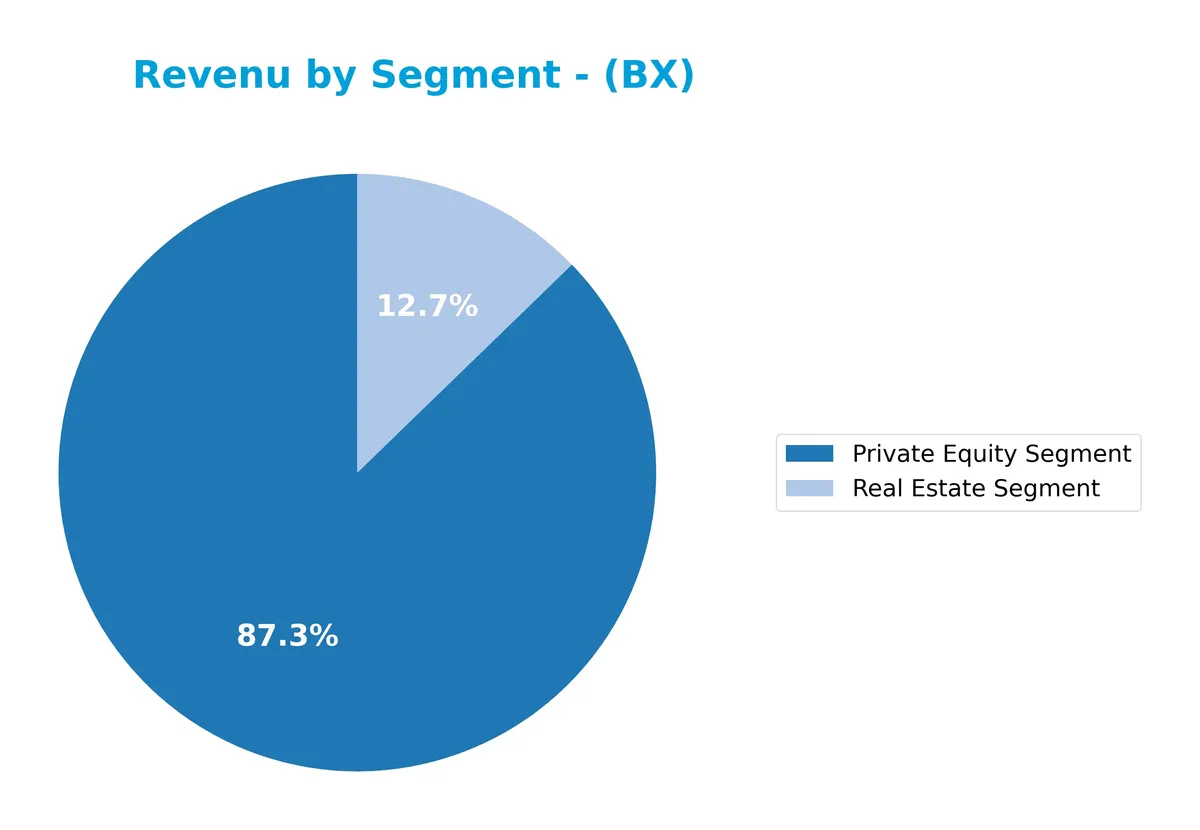
In 2025, Private Equity drives Blackstone’s revenue with $1.67B, showing strong growth from $1.39B in 2024. Real Estate rose to $490M, more than doubling from the prior year. This shift signals a strategic focus on asset-heavy segments. The concentration in Private Equity and Real Estate underscores their core role, while other segments appear less significant or absent, reflecting potential concentration risk.
Key Products & Brands
The table below outlines Blackstone Inc.’s main products and brand segments with concise descriptions:
| Product | Description |
|---|---|
| Private Equity Segment | Invests in early-stage companies, large and mid-cap buyouts, special situations, growth projects, and minority stakes globally. |
| Real Estate Segment | Focuses on opportunistic, core+ investments, debt opportunities, and stabilized income commercial real estate across major regions. |
| Hedge Fund Solutions | Manages a broad range of commingled and customized hedge fund strategies. |
| Credit Segment | Provides loans and securities to non-investment grade companies across the capital structure, including debt and equity. |
| Investment Advice | Offers advisory services related to asset management and capital markets. |
| Investment Performance | Reflects returns generated from Blackstone’s asset management activities. |
| Financial Advisory | Provides advisory services related to financial transactions and restructuring. |
Blackstone’s key products span private equity, real estate, hedge funds, and credit. The firm also delivers investment advice and performance, reflecting its diversified asset management business.
Main Competitors
There are 11 competitors in total; below is a table of the top 10 leaders by market capitalization:
| Competitor | Market Cap. |
|---|---|
| Blackstone Inc. | 191B |
| BlackRock, Inc. | 168B |
| KKR & Co. Inc. | 115B |
| The Bank of New York Mellon Corporation | 82B |
| Ares Management Corporation | 55B |
| Ameriprise Financial, Inc. | 46B |
| State Street Corporation | 36B |
| Northern Trust Corporation | 26B |
| T. Rowe Price Group, Inc. | 23B |
| Franklin Resources, Inc. | 12B |
Blackstone Inc. ranks first among its 11 competitors. Its market cap is 71% of the top player, reflecting strong scale leadership. The company sits above both the average market cap of the top 10 competitors (75B) and the sector median (46B). It enjoys a 19% market cap gap over the next competitor below, underscoring a solid dominant position.
Comparisons with competitors
Check out how we compare the company to its competitors:
Does Blackstone Inc. have a competitive advantage?
Blackstone Inc. does not currently present a competitive advantage, as its return on invested capital (ROIC) significantly trails its weighted average cost of capital (WACC), indicating value destruction. The firm’s ROIC trend is sharply declining, reflecting worsening profitability over the 2021-2025 period.
Looking ahead, Blackstone’s diversified exposure across real estate, private equity, hedge funds, and credit offers growth opportunities in Asia and Latin America. It also focuses on emerging sectors like alternative energy and consumer technologies, potentially expanding its investment horizons despite current challenges.
SWOT Analysis
This SWOT analysis highlights Blackstone Inc.’s strategic position by examining internal strengths and weaknesses alongside external opportunities and threats.
Strengths
- strong market presence with $136B market cap
- high gross margin at 86%
- diversified asset management portfolio
Weaknesses
- declining ROIC signaling value destruction
- unfavorable leverage with D/E at 1.63
- weak liquidity ratios (current and quick ratio at 0)
Opportunities
- expansion in Asia and Latin America
- growth in alternative energy investments
- rising demand for credit and hedge fund solutions
Threats
- market volatility impacting asset valuations
- regulatory risks in global markets
- competition from emerging asset managers
Blackstone’s strengths in scale and margin provide a solid foundation, but deteriorating profitability metrics and leverage raise caution. The company must leverage global growth and alternative assets while managing financial risks prudently.
Stock Price Action Analysis
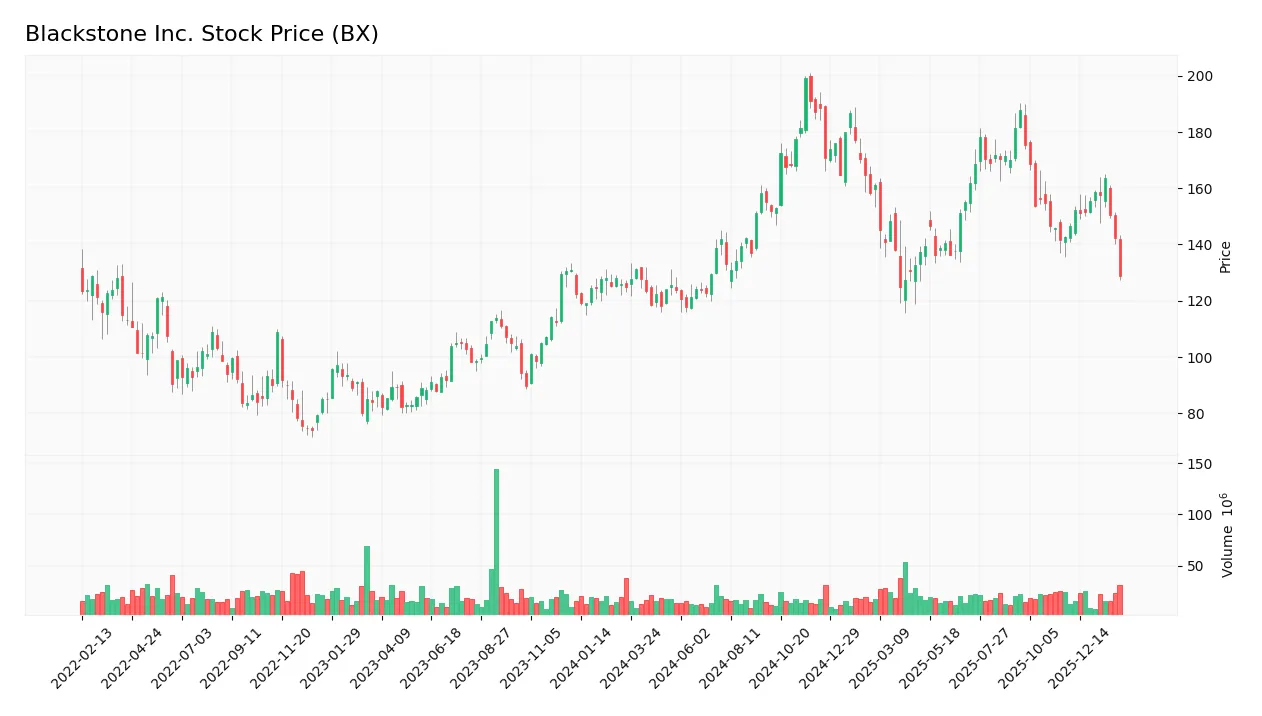
The following weekly chart illustrates Blackstone Inc. (BX) stock price movements over the past 12 months, highlighting key support and resistance levels:
Trend Analysis
Over the past 12 months, BX experienced an 11.14% price decline, indicating a bearish trend. The stock showed deceleration in its downward momentum. Volatility remains elevated with a 20.55 standard deviation. The highest price reached 199.05, while the lowest dropped to 113.37.
Volume Analysis
Trading volume is increasing overall, with a slight buyer majority of 50.78%. However, in the recent period (Dec 2025–Mar 2026), sellers dominate with only 29.5% buyer volume, signaling cautious or bearish investor sentiment and heightened selling pressure.
Target Prices
Analysts set a solid target consensus for Blackstone Inc., reflecting cautious optimism.
| Target Low | Target High | Consensus |
|---|---|---|
| 137 | 215 | 169.83 |
The target range from 137 to 215 suggests varied outlooks, but the consensus near 170 indicates a moderate upside from current levels.

Don’t Let Luck Decide Your Entry Point
Optimize your entry points with our advanced ProRealTime indicators. You’ll get efficient buy signals with precise price targets for maximum performance. Start outperforming now!
Analyst & Consumer Opinions
This section reviews recent analyst grades and consumer feedback to provide insight into Blackstone Inc.’s market perception.
Stock Grades
Here is the latest grading summary for Blackstone Inc. from established financial firms:
| Grading Company | Action | New Grade | Date |
|---|---|---|---|
| UBS | Maintain | Neutral | 2026-02-20 |
| Piper Sandler | Maintain | Neutral | 2026-02-02 |
| TD Cowen | Maintain | Buy | 2026-01-30 |
| JP Morgan | Maintain | Neutral | 2026-01-30 |
| Citizens | Maintain | Market Outperform | 2026-01-30 |
| Barclays | Maintain | Equal Weight | 2026-01-30 |
| TD Cowen | Maintain | Buy | 2026-01-14 |
| UBS | Maintain | Neutral | 2026-01-13 |
| Barclays | Maintain | Equal Weight | 2026-01-09 |
| Barclays | Maintain | Equal Weight | 2025-12-12 |
The consensus reflects a balanced view with a slight lean towards buying, as multiple firms maintain neutral or equal weight ratings while TD Cowen consistently supports a buy stance. The lack of upgrades or downgrades suggests stable market confidence in Blackstone’s current performance.
Consumer Opinions
Blackstone Inc. consistently draws strong reactions from consumers, reflecting its influential role in private equity and asset management.
| Positive Reviews | Negative Reviews |
|---|---|
| “Blackstone’s investment strategies deliver solid returns.” | “Fees feel high compared to industry peers.” |
| “Transparent communication during market volatility.” | “Customer support can be slow during peak times.” |
| “Robust portfolio diversification minimizes risk effectively.” | “Complex products are difficult to fully understand.” |
Overall, Blackstone earns praise for strong returns and clear communication. However, clients often cite high fees and occasional service delays as drawbacks. This feedback highlights the classic trade-off between premium asset management and cost sensitivity.
Risk Analysis
Below is a summary table highlighting key risks facing Blackstone Inc. in 2026:
| Category | Description | Probability | Impact |
|---|---|---|---|
| Market Volatility | High beta (1.76) exposes BX to sharp market swings affecting asset values. | High | High |
| Valuation Risk | Elevated P/E (39.9) and P/B (13.9) suggest overvaluation risk. | Medium | Medium |
| Leverage Risk | High debt/equity ratio (1.63) strains financial flexibility. | High | High |
| Liquidity Risk | Zero current and quick ratios indicate potential short-term liquidity issues. | Medium | High |
| Operational Risk | Negative ROIC (-48.3%) below WACC (10.4%) signals poor capital efficiency. | Medium | High |
| Dividend Risk | Dividend yield at 3.04% is sustainable but could be pressured by weaker cash flow. | Low | Medium |
Blackstone’s greatest vulnerabilities stem from high leverage and poor capital returns. Despite a safe Altman Z-Score (3.64), the negative ROIC versus WACC warns of inefficient investment deployment. Elevated valuation metrics increase downside risk amid volatile markets. I advise close monitoring of liquidity and debt levels given their potential to amplify shocks.
Should You Buy Blackstone Inc.?
Blackstone Inc. appears to be a moderately profitable firm with a deteriorating competitive moat, indicated by declining ROIC versus WACC. Despite a challenging leverage profile, the company’s overall B rating suggests a cautious but potentially resilient investment case.
Strength & Efficiency Pillars
Blackstone Inc. displays strong profitability with a net margin of 21.83% and return on equity (ROE) at 34.84%, both signaling solid operational control. However, the return on invested capital (ROIC) stands at -48.33%, well below the weighted average cost of capital (WACC) at 10.41%, indicating the company is currently destroying value rather than creating it. Despite this, Blackstone’s gross margin of 86.05% and interest coverage ratio of 14.12 support operational resilience in a competitive financial sector.
Weaknesses and Drawbacks
Blackstone faces significant valuation and leverage concerns. Its price-to-earnings (P/E) ratio at 39.87 and price-to-book (P/B) ratio at 13.89 suggest a richly priced stock that may not justify its fundamentals. The debt-to-equity ratio is elevated at 1.63, signaling high leverage, while current and quick ratios are zero, raising liquidity red flags. Recent seller dominance at 70.5% highlights short-term market pressure, reflecting bearish technical momentum and investor caution.
Our Final Verdict about Blackstone Inc.
Blackstone’s Altman Z-Score of 3.64 places it safely outside financial distress, but its value destruction via negative ROIC and stretched valuation metrics raise caution. Despite robust operational margins, the bearish price trend and seller dominance suggest investors might consider a wait-and-see approach. The profile might appear attractive for long-term exposure only if value creation metrics improve and market pressure subsides.
Disclaimer: This content is for informational purposes only and does not constitute financial, investment, or other professional advice. Investing in financial markets involves a significant risk of loss, and past performance is not indicative of future results.
Additional Resources
- Decoding Blackstone Inc (BX): A Strategic SWOT Insight – GuruFocus (Feb 28, 2026)
- Is Blackstone Inc. (BX) One of the Best Cheap Blue Chip Stocks to Buy According to Analysts? – Bitget (Feb 28, 2026)
- Blackstone Plans Public Company for AI Data-Center Buying Spree – Bloomberg.com (Feb 27, 2026)
- Blackstone Inc. $BX Shares Purchased by Close Asset Management Ltd – MarketBeat (Feb 27, 2026)
- RBC Capital Initiates Blackstone (BX) Coverage with $179 Target on Strong Growth Outlook – Yahoo Finance (Feb 27, 2026)
For more information about Blackstone Inc., please visit the official website: blackstone.com