Home > Analyses > Financial Services > BlackRock, Inc.
BlackRock transforms how billions secure their financial futures by managing trillions in assets worldwide. It dominates asset management with innovative ETFs, active funds, and cutting-edge risk analytics. Known for its unmatched scale and technology-driven insights, BlackRock sets industry standards and influences global markets. As market dynamics shift in 2026, I question whether BlackRock’s robust fundamentals continue to justify its premium valuation and growth prospects.

Table of contents
Business Model & Company Overview
BlackRock, Inc., founded in 1988 and headquartered in New York City, dominates the asset management industry with a comprehensive ecosystem serving institutional, intermediary, and individual investors. Its core mission integrates investment management, risk advisory, and diversified portfolio strategies across equity, fixed income, and alternative assets, creating a unified platform that addresses broad financial needs globally.
The company’s revenue engine balances recurring fees from managing mutual funds, ETFs, and hedge funds with advisory services, leveraging a strong presence across the Americas, Europe, and Asia. BlackRock’s ability to blend fundamental and quantitative analysis across multiple asset classes underpins its competitive advantage. This diversified, client-focused approach secures a durable economic moat, positioning it as a pivotal force in shaping the industry’s future.
Financial Performance & Fundamental Metrics
I analyze BlackRock, Inc.’s income statement, key financial ratios, and dividend payout policy to assess its profitability, efficiency, and shareholder returns.
Income Statement
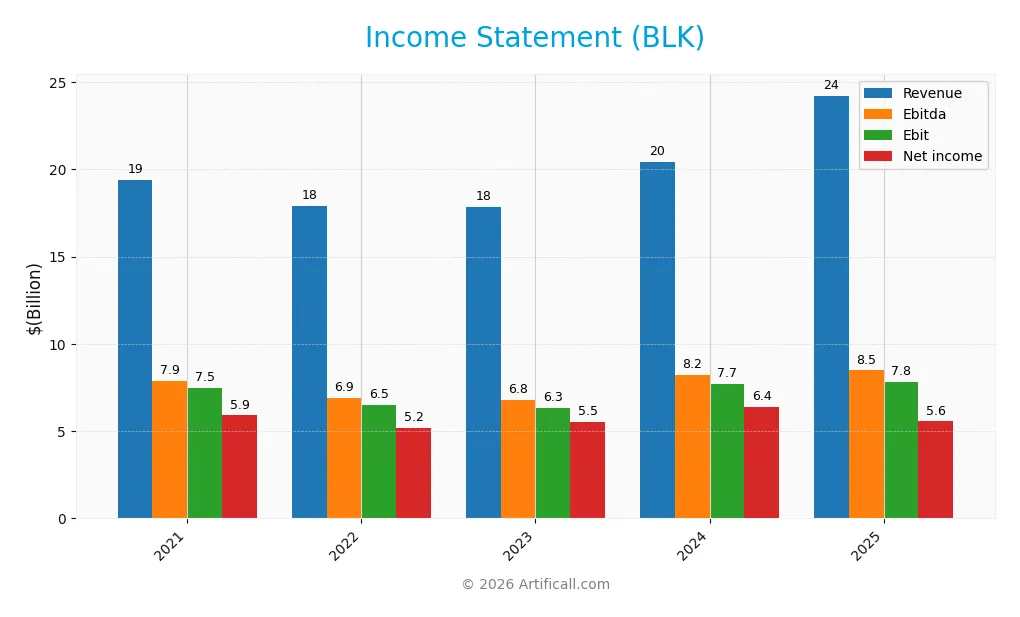
Below is the income statement for BlackRock, Inc. over the past five fiscal years, showing key profitability and expense metrics.
| 2021 | 2022 | 2023 | 2024 | 2025 | |
|---|---|---|---|---|---|
| Revenue | 19.4B | 17.9B | 17.9B | 20.4B | 24.2B |
| Cost of Revenue | 9.6B | 9.2B | 9.3B | 10.3B | 10.8B |
| Operating Expenses | 2.4B | 2.3B | 2.3B | 2.5B | 6.4B |
| Gross Profit | 9.8B | 8.7B | 8.6B | 10.1B | 13.4B |
| EBITDA | 7.9B | 6.9B | 6.8B | 8.2B | 8.5B |
| EBIT | 7.5B | 6.5B | 6.3B | 7.7B | 7.8B |
| Interest Expense | 205M | 212M | 292M | 538M | 706M |
| Net Income | 5.9B | 5.2B | 5.5B | 6.4B | 5.6B |
| EPS | 38.76 | 34.31 | 36.85 | 42.45 | 35.84 |
| Filing Date | 2022-02-25 | 2023-02-24 | 2024-02-23 | 2025-02-25 | 2026-02-25 |
Income Statement Evolution
BlackRock’s revenue rose 25% from 2021 to 2025, with an 18.7% jump between 2024 and 2025. Gross margin improved to 55.5%, supporting a stable EBIT margin near 32%. However, net income declined by 5.9% over the period, and net margin contracted nearly 25%, signaling margin pressure despite top-line growth.
Is the Income Statement Favorable?
In 2025, fundamentals appear generally favorable. Revenue growth accelerated 18.7%, and gross profit surged 33.3%, reflecting operational strength. EBIT growth was modest at 1.7%, while net margin and EPS declined, highlighting cost and profitability challenges. Overall, BlackRock maintains solid profitability but faces pressure on net earnings and margins.
Financial Ratios
The table below presents key financial ratios for BlackRock, Inc. from 2021 through 2025, offering a snapshot of profitability, liquidity, leverage, and efficiency metrics:
| Ratios | 2021 | 2022 | 2023 | 2024 | 2025 |
|---|---|---|---|---|---|
| Net Margin | 30.5% | 28.97% | 30.8% | 31.2% | 22.9% |
| ROE | 15.7% | 13.7% | 14.0% | 13.4% | 9.9% |
| ROIC | 3.7% | 4.4% | 4.1% | 4.3% | 6.6% |
| P/E | 23.6 | 20.7 | 22.0 | 24.1 | 29.9 |
| P/B | 3.7 | 2.8 | 3.1 | 3.2 | 3.0 |
| Current Ratio | 14.5 | 14.1 | 15.6 | 16.4 | 7.5 |
| Quick Ratio | 14.5 | 14.1 | 15.6 | 16.4 | 7.5 |
| D/E | 0.25 | 0.22 | 0.25 | 0.30 | 0.04 |
| Debt-to-Assets | 6.1% | 7.2% | 7.9% | 10.3% | 1.3% |
| Interest Coverage | 36.3 | 30.1 | 21.5 | 14.1 | 10.0 |
| Asset Turnover | 0.13 | 0.15 | 0.14 | 0.15 | 0.14 |
| Fixed Asset Turnover | 8.1 | 7.0 | 7.1 | 7.8 | 7.7 |
| Dividend Yield | 1.8% | 2.8% | 2.5% | 2.0% | 1.9% |
Evolution of Financial Ratios
From 2021 to 2025, BlackRock’s Return on Equity declined from 15.7% to 9.9%, signaling weakening profitability. The Current Ratio fell from an unusually high 14.5x to 7.5x, indicating reduced liquidity but still above typical industry norms. Debt-to-Equity dropped sharply from 0.25 to 0.04, reflecting a significant deleveraging trend over the period.
Are the Financial Ratios Favorable?
In 2025, profitability showed mixed signals: net margin was favorable at 22.9%, yet ROE lagged below the 10.8% WACC, marking capital inefficiency. Liquidity ratios diverged; the quick ratio was favorable at 7.46, but the current ratio was flagged unfavorable. Leverage remained conservatively low with a 0.04 debt-to-equity ratio. Asset turnover was weak, while fixed asset turnover remained strong, supporting a slightly favorable overall ratio assessment.
Shareholder Return Policy
BlackRock, Inc. maintains a consistent dividend payout ratio around 50-58%, with dividends per share increasing from $16.73 in 2021 to $20.84 in 2025. The annual dividend yield ranges between 1.8% and 2.8%, supported by free cash flow coverage and moderate share buyback activity.
This distribution strategy balances rewarding shareholders and preserving capital for growth. The payout ratio and dividend yield appear sustainable given BlackRock’s strong profitability and liquidity metrics, supporting a stable, long-term shareholder value creation framework.
Score analysis
The radar chart below illustrates BlackRock, Inc.’s key financial scores across valuation, profitability, and leverage metrics:
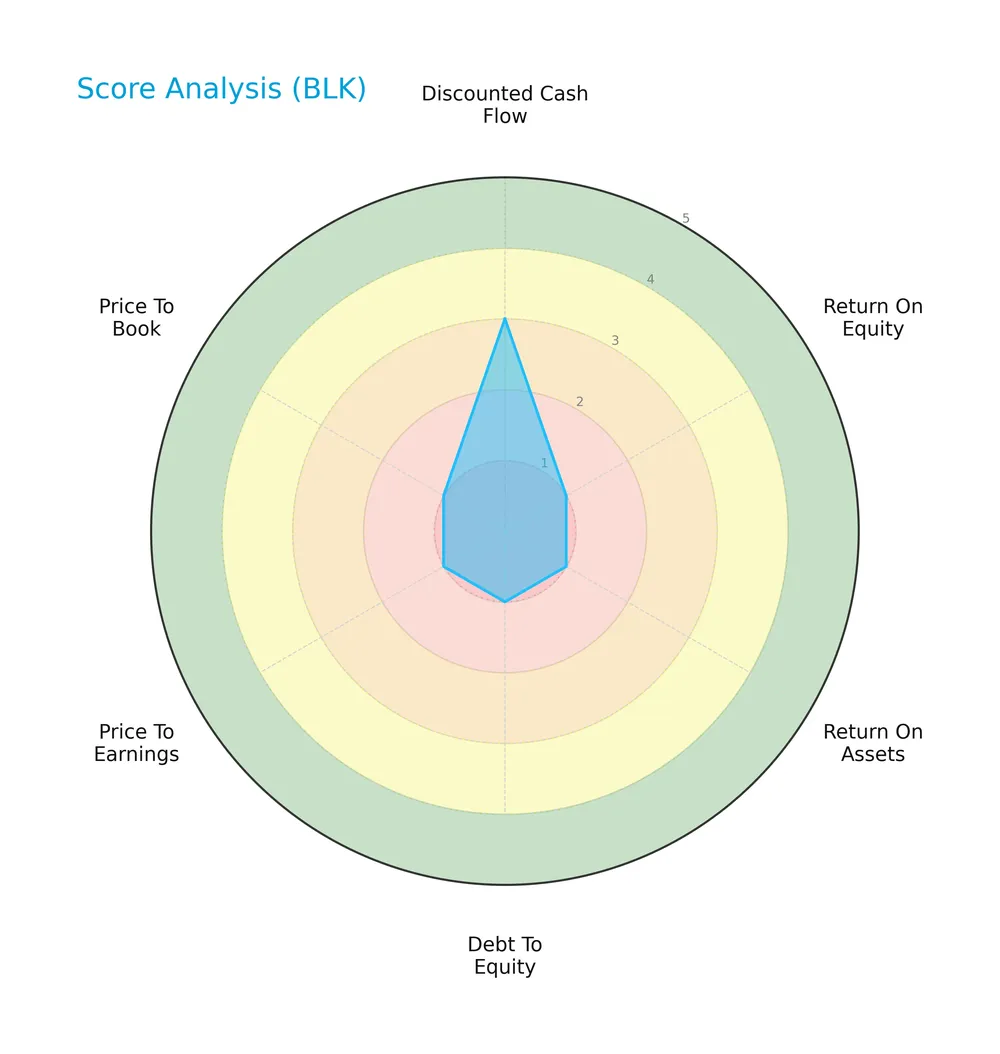
BlackRock’s discounted cash flow score stands at a moderate 3. However, its return on equity, return on assets, debt to equity, price to earnings, and price to book scores all register very unfavorable values of 1, signaling weak financial health in those areas.
Analysis of the company’s bankruptcy risk
The Altman Z-Score places BlackRock in the distress zone, indicating a high risk of financial distress and bankruptcy:

Is the company in good financial health?
The Piotroski Score diagram provides insight into BlackRock’s financial strength based on nine fundamental criteria:

With a Piotroski score of 4, BlackRock’s financial health is average, reflecting mixed signals in profitability and financial efficiency. This score suggests caution, as the company neither demonstrates strong nor very weak financial conditions.
Competitive Landscape & Sector Positioning
This section examines BlackRock, Inc.’s strategic positioning, revenue streams, key products, and main competitors. I will assess whether BlackRock holds a sustainable competitive advantage in its sector.
Strategic Positioning
BlackRock maintains a diversified product portfolio emphasizing investment advice, which generated $19.2B in 2025, complemented by distribution and performance services. Geographically, it focuses on the Americas ($15.9B) and Europe ($7.2B), with smaller exposure in Asia Pacific ($1.1B), reflecting broad but regionally weighted asset management.
Revenue by Segment
This pie chart displays BlackRock’s revenue distribution by segment for fiscal year 2025, illustrating the company’s diverse income streams within that period.
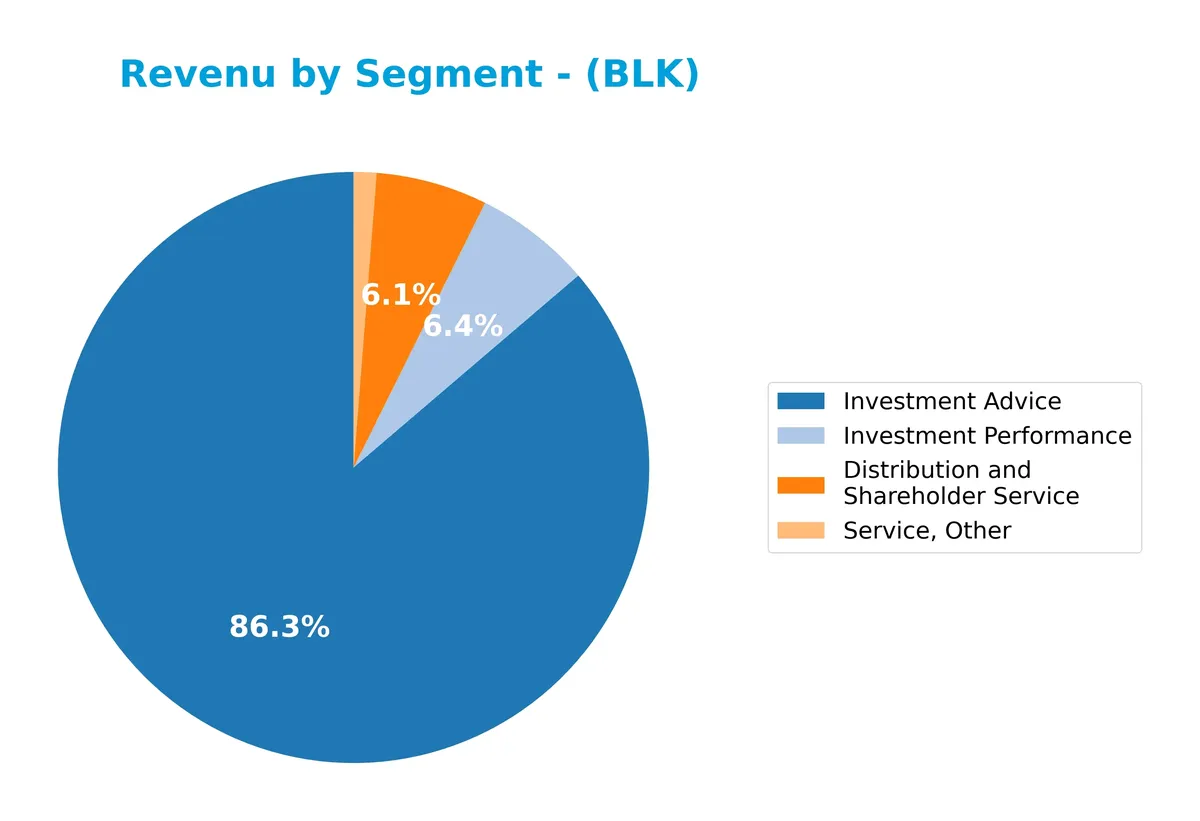
Investment Advice dominates BlackRock’s revenue, generating $19.2B in 2025 and showing strong growth since 2023. Distribution and Shareholder Service contributes $1.36B, slightly increasing year-over-year. Investment Performance rose notably to $1.42B, signaling an improving outcome in this segment. The smaller Service, Other segment accounts for $277M, indicating limited revenue concentration risk but highlighting reliance on core advisory services.
Key Products & Brands
The following table summarizes BlackRock’s primary products and services by category and function:
| Product | Description |
|---|---|
| Investment Advice | Advisory services focused on portfolio management for institutional and individual investors, generating $19.2B in 2025. |
| Distribution and Shareholder Service | Services supporting fund distribution and shareholder relations, contributing $1.36B in 2025. |
| Investment Performance | Performance-related fees from managing equity, fixed income, and alternative investments, totaling $1.42B in 2025. |
| Technology Service | Technology solutions including risk management and advisory platforms, reported $1.6B revenue in 2024 (discontinued in 2025). |
| Service, Other | Miscellaneous services generating $277M in 2025. |
BlackRock’s revenue mix centers on investment advisory, which dominates with nearly 80% of total segment revenue. Distribution and performance fees provide stable supplementary income. Technology services have been phased out recently, reflecting strategic shifts.
Main Competitors
There are 11 competitors in total, with the table below listing the top 10 leaders by market capitalization:
| Competitor | Market Cap. |
|---|---|
| Blackstone Inc. | 190.6B |
| BlackRock, Inc. | 168.1B |
| KKR & Co. Inc. | 114.9B |
| The Bank of New York Mellon Corporation | 81.6B |
| Ares Management Corporation | 54.6B |
| Ameriprise Financial, Inc. | 45.9B |
| State Street Corporation | 36.1B |
| Northern Trust Corporation | 26.3B |
| T. Rowe Price Group, Inc. | 23.1B |
| Franklin Resources, Inc. | 12.4B |
BlackRock ranks 2nd among its competitors, with a market cap about 89% the size of the leader, Blackstone. It stands above both the average market cap of the top 10 competitors (75.4B) and the sector median (45.9B). The 12.3% gap to Blackstone indicates a competitive but clear leading position, while it holds a significant 47.7% margin over the next competitor below.
Comparisons with competitors
Check out how we compare the company to its competitors:
Does BLK have a competitive advantage?
BlackRock, Inc. currently shows a slightly unfavorable competitive advantage, as its return on invested capital (ROIC) falls below its weighted average cost of capital (WACC), indicating value destruction. However, its ROIC trend is strongly positive, reflecting improving profitability over 2021-2025 despite overall value shedding.
Looking ahead, BlackRock’s growth in revenue across Americas, Europe, and Asia Pacific supports expansion opportunities. The firm’s launch of diverse investment products and focus on real estate in Poland and Germany could enhance future competitive positioning.
SWOT Analysis
This SWOT analysis highlights BlackRock’s key strategic factors shaping its market position and future prospects.
Strengths
- dominant global asset manager
- strong brand and scale
- diversified product portfolio
Weaknesses
- ROIC below WACC, destroying value
- declining net margin and EPS growth
- high P/E ratio signals valuation risk
Opportunities
- expanding in Europe and Asia Pacific
- growing demand for ESG and alternative investments
- digital transformation in asset management
Threats
- intense competition from fintech and peers
- market volatility affecting AUM
- regulatory changes in key markets
BlackRock’s scale and brand anchor its leadership, but value destruction signals caution. Growth hinges on geographic expansion and innovation amid stiff competition and regulatory risks.
Stock Price Action Analysis
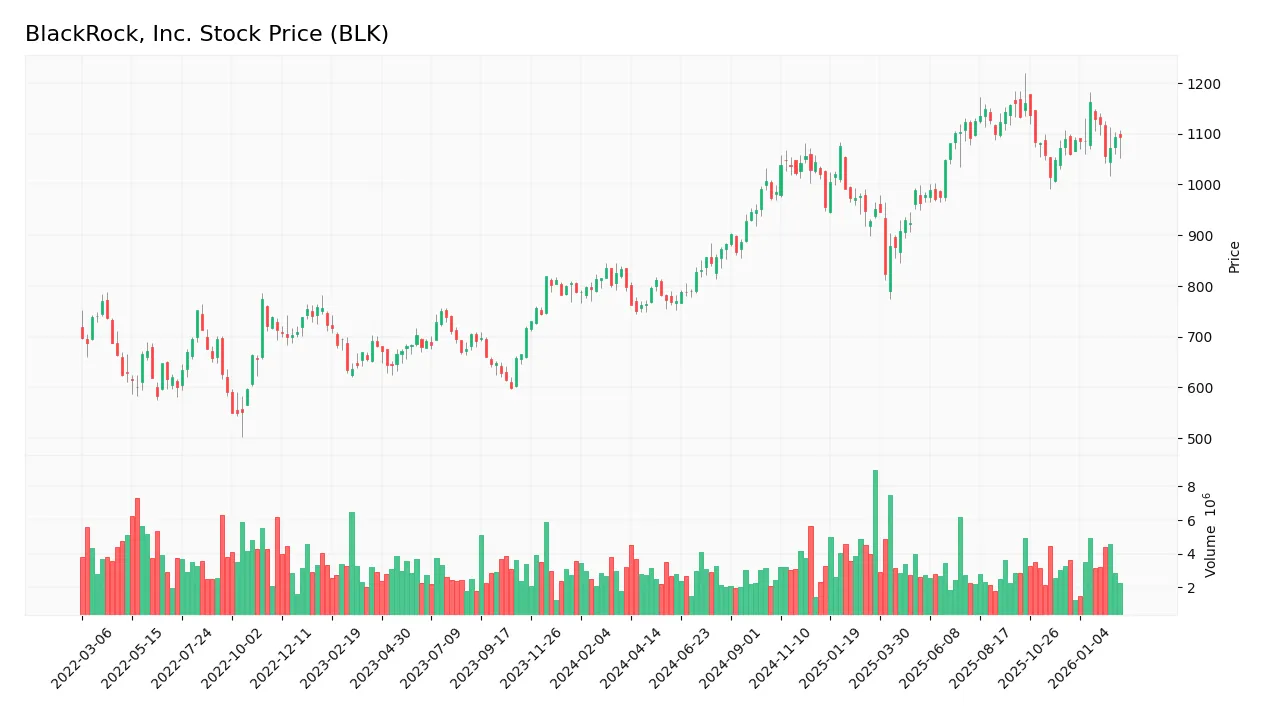
The weekly stock chart below illustrates BlackRock, Inc.’s price movements and volatility over the past 12 months:
Trend Analysis
Over the past 12 months, BlackRock’s stock price increased by 37.14%, signaling a bullish trend. The price peaked at 1163.17 and bottomed at 749.98. Despite the strong rise, the trend shows deceleration. The high volatility is confirmed by a standard deviation of 118.82.
Volume Analysis
Trading volume has been increasing with 61.43% buyer participation overall. In the recent three months, volume remains slightly buyer-dominant at 58.77%, suggesting modest bullish investor sentiment and steady market engagement. Seller volume is lower but persistent, indicating balanced but growing interest.
Target Prices
Analysts project a robust target consensus for BlackRock, Inc. reflecting confidence in its growth trajectory.
| Target Low | Target High | Consensus |
|---|---|---|
| 1200 | 1514 | 1333.7 |
The range between 1200 and 1514 indicates strong upside potential. The consensus near 1334 suggests steady investor optimism.

Don’t Let Luck Decide Your Entry Point
Optimize your entry points with our advanced ProRealTime indicators. You’ll get efficient buy signals with precise price targets for maximum performance. Start outperforming now!
Analyst & Consumer Opinions
This section examines BlackRock, Inc.’s recent analyst grades alongside consumer feedback to provide balanced insights.
Stock Grades
Here is a summary of recent stock grades from leading financial institutions for BlackRock, Inc.:
| Grading Company | Action | New Grade | Date |
|---|---|---|---|
| UBS | Upgrade | Buy | 2026-02-23 |
| UBS | Maintain | Neutral | 2026-01-16 |
| Keefe, Bruyette & Woods | Maintain | Outperform | 2026-01-16 |
| Barclays | Maintain | Overweight | 2026-01-16 |
| TD Cowen | Downgrade | Hold | 2026-01-14 |
| UBS | Maintain | Neutral | 2026-01-12 |
| Barclays | Maintain | Overweight | 2026-01-08 |
| Keefe, Bruyette & Woods | Maintain | Outperform | 2026-01-08 |
| Morgan Stanley | Maintain | Overweight | 2025-12-17 |
| Keefe, Bruyette & Woods | Maintain | Outperform | 2025-12-17 |
The overall trend shows consistent confidence in BlackRock, with most firms maintaining positive ratings such as Overweight and Outperform. UBS recently upgraded the stock to Buy, while TD Cowen’s Hold rating represents a relative caution.
Consumer Opinions
BlackRock commands respect among investors, but consumer sentiment reveals a nuanced picture balancing trust and concerns.
| Positive Reviews | Negative Reviews |
|---|---|
| “BlackRock’s transparent communication builds confidence.” | “High fees diminish long-term returns.” |
| “Innovative investment products meet diverse needs.” | “Customer service can be slow during peak times.” |
| “Strong global presence reassures about stability.” | “Digital platforms sometimes lack intuitive design.” |
Overall, consumers appreciate BlackRock’s transparency and product innovation. However, fee structures and service responsiveness remain common complaints, signaling areas for potential improvement.
Risk Analysis
Below is a detailed overview of BlackRock’s key risks, their likelihood, and potential impact:
| Category | Description | Probability | Impact |
|---|---|---|---|
| Financial Health | Altman Z-Score at 1.65 signals financial distress risk. | High | High |
| Valuation Risk | Elevated P/E at 29.9 suggests expensive stock pricing. | Medium | Medium |
| Profitability | ROE of 9.94% below WACC 10.8% implies value destruction. | High | High |
| Liquidity | Current ratio 7.46 may indicate inefficient asset use. | Medium | Low |
| Market Volatility | Beta of 1.49 shows above-market stock price volatility. | High | Medium |
| Debt Levels | Low debt-to-equity ratio (0.04) reduces financial risk. | Low | Low |
BlackRock faces significant financial distress risks, as reflected by its Altman Z-Score in the distress zone. Its ROE trailing WACC signals capital inefficiency, a red flag in asset management. Elevated valuation multiples heighten downside risk amid market volatility. While liquidity appears strong, the high current ratio suggests potential capital inefficiency. Investors should weigh these risks carefully against BlackRock’s scale and market position.
Should You Buy BlackRock, Inc.?
BlackRock appears to be shedding value despite growing profitability, suggesting a slightly unfavorable moat. Its leverage profile looks manageable, but key profitability metrics remain weak. The overall rating is a cautious C-, indicating moderate risk and operational challenges.
Strength & Efficiency Pillars
BlackRock, Inc. maintains robust operational margins, with a gross margin of 55.52% and net margin at 22.93%, indicating strong core profitability. Interest expense is well controlled at 2.92%, supporting earnings stability. However, its return on invested capital (ROIC) of 6.62% trails its weighted average cost of capital (WACC) at 10.8%, signaling value erosion despite a growing ROIC trend. These figures underscore efficiency in operations but caution on value creation, as the company does not yet generate economic profit.
Weaknesses and Drawbacks
Critically, BlackRock sits in the Altman Z-Score distress zone with a score of 1.65, highlighting significant financial distress and bankruptcy risk. This override signals solvency concerns that overshadow operational strengths. Additionally, the company faces valuation pressure with a high price-to-earnings ratio of 29.9, implying an expensive market premium. The current ratio at 7.46 flags potential liquidity management issues despite low debt-to-equity of 0.04, and asset turnover is weak at 0.14, indicating inefficient asset use. These factors collectively heighten investment risk.
Our Final Verdict about BlackRock, Inc.
Despite favorable margins and a bullish stock trend, BlackRock’s distressed Altman Z-Score makes it a highly speculative investment. The solvency risk dominates the profile, rendering it too risky for conservative capital. Investors might view operational strengths as insufficient to offset financial fragility. Caution and thorough risk management are paramount before considering exposure in this environment.
Disclaimer: This content is for informational purposes only and does not constitute financial, investment, or other professional advice. Investing in financial markets involves a significant risk of loss, and past performance is not indicative of future results.
Additional Resources
- Decoding BlackRock Inc (BLK): A Strategic SWOT Insight – GuruFocus (Feb 26, 2026)
- BlackRock, Inc. SEC 10-K Report – TradingView (Feb 25, 2026)
- Insider Sell: Stephen Cohen Sells Shares of BlackRock Inc (BLK) – GuruFocus (Feb 26, 2026)
- BlackRock (BLK) Slid on Investors’ Concerns – Yahoo Finance (Feb 18, 2026)
- Precision Trading with Blackrock Inc. (BLK) Risk Zones – Stock Traders Daily (Feb 22, 2026)
For more information about BlackRock, Inc., please visit the official website: blackrock.com