Home > Analyses > Consumer Defensive > BJ’s Wholesale Club Holdings, Inc.
BJ’s Wholesale Club transforms everyday shopping into a value-driven experience for millions along the U.S. East Coast. Its warehouse clubs combine bulk savings with quality merchandise, ranging from groceries to gasoline. Known for innovation in membership models and digital sales, BJ’s commands a loyal customer base in the competitive discount retail sector. As the retail landscape evolves, I question whether BJ’s fundamentals can sustain its market position and justify current valuation.

Table of contents
Business Model & Company Overview
BJ’s Wholesale Club Holdings, Inc. was founded in 1984 and is headquartered in Westborough, Massachusetts. It operates a network of 229 warehouse clubs and 160 gas locations across 17 states on the U.S. East Coast. The company’s core business integrates perishable goods, general merchandise, gasoline, and ancillary services into a seamless wholesale ecosystem focused on value and convenience for its members.
BJ’s generates revenue through a mix of membership fees, product sales in warehouse clubs, and online platforms like BJs.com. Its digital presence complements physical stores, enhancing customer reach across the Americas. This balance between brick-and-mortar and e-commerce strengthens its recurring revenue streams. BJ’s maintains a robust competitive advantage by combining scale, variety, and regional dominance, securing a durable moat in the discount retail sector.
Financial Performance & Fundamental Metrics
I analyze BJ’s Wholesale Club Holdings, Inc.’s income statement, key financial ratios, and dividend payout policy to assess its core financial health and shareholder value.
Income Statement
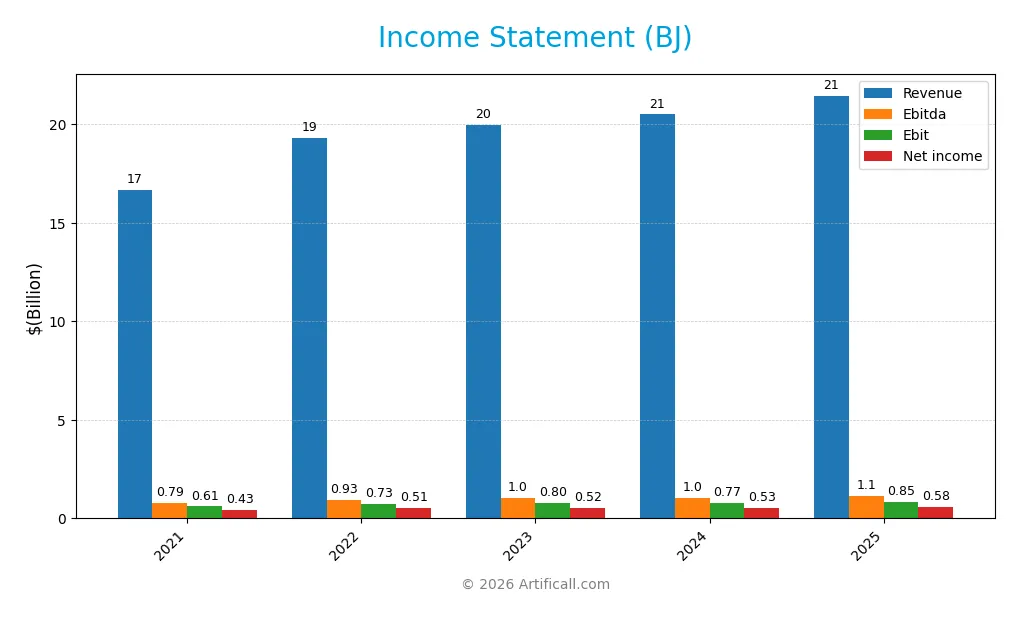
The table below summarizes BJ’s Wholesale Club Holdings, Inc. income statement figures for the fiscal years 2021 through 2025, presented in USD.
| 2021 | 2022 | 2023 | 2024 | 2025 | |
|---|---|---|---|---|---|
| Revenue | 16.7B | 19.3B | 20.0B | 20.5B | 21.5B |
| Cost of Revenue | 13.6B | 15.9B | 16.3B | 16.7B | 17.5B |
| Operating Expenses | 2.5B | 2.7B | 2.8B | 3.0B | 3.2B |
| Gross Profit | 3.1B | 3.4B | 3.6B | 3.8B | 4.0B |
| EBITDA | 789M | 933M | 1.0B | 1.0B | 1.1B |
| EBIT | 608M | 732M | 798M | 770M | 846M |
| Interest Expense | 59M | 47M | 63M | 50M | 42M |
| Net Income | 427M | 513M | 524M | 534M | 578M |
| EPS | 3.15 | 3.83 | 3.94 | 4.04 | 4.41 |
| Filing Date | 2022-03-17 | 2023-03-16 | 2024-03-18 | 2025-03-14 | 2026-03-12 |
Income Statement Evolution
BJ’s revenue grew steadily from $16.7B in 2021 to $21.5B in 2025, a 29% increase over five years. Net income rose 36% to $578M, reflecting consistent margin improvement. Gross margin held steady near 18.6%, while EBIT margin improved to 3.9%, signaling enhanced operational efficiency despite rising expenses.
Is the Income Statement Favorable?
In 2025, BJ posted a 4.7% revenue increase and a 9.8% EBIT growth, outpacing revenue expansion. Net margin of 2.7% remained stable, supported by favorable interest expense management. EPS grew 9.5%, underlining shareholder value creation. Overall, the income statement fundamentals appear favorable with solid profitability gains and controlled costs.
Financial Ratios
The table below summarizes key financial ratios for BJ’s Wholesale Club Holdings, Inc. over the last four fiscal years:
| Ratios | 2022 | 2023 | 2024 | 2025 |
|---|---|---|---|---|
| Net Margin | 2.66% | 2.62% | 2.61% | 2.70% |
| ROE | 49.02% | 35.90% | 28.93% | 26.32% |
| ROIC | 12.53% | 12.16% | 11.69% | 12.23% |
| P/E | 18.93 | 16.34 | 24.49 | 20.97 |
| P/B | 9.28 | 5.87 | 7.09 | 5.52 |
| Current Ratio | 0.67 | 0.73 | 0.74 | 0.75 |
| Quick Ratio | 0.13 | 0.14 | 0.15 | 0.16 |
| D/E | 2.98 | 2.05 | 1.54 | 1.19 |
| Debt-to-Assets | 49.08% | 44.69% | 40.25% | 34.73% |
| Interest Coverage | 15.55 | 12.77 | 15.29 | 19.96 |
| Asset Turnover | 3.04 | 2.99 | 2.90 | 2.86 |
| Fixed Asset Turnover | 5.55 | 5.37 | 5.13 | 4.94 |
| Dividend Yield | 0.0003% | 0.0003% | 0.00002% | 0.00% |
Evolution of Financial Ratios
Return on Equity (ROE) showed a declining trend from 65.8% in 2021 to 26.3% in 2025, indicating reduced profitability. The Current Ratio remained consistently below 1, fluctuating slightly around 0.75, signaling persistent liquidity constraints. Debt-to-Equity Ratio significantly improved from above 4.5 in 2021 to roughly 1.19 in 2025, reflecting stronger balance sheet leverage management.
Are the Financial Ratios Favorable?
Profitability ratios reveal mixed signals: ROE (26.3%) and Return on Invested Capital (12.2%) are favorable, but the net margin (2.7%) is unfavorable. Liquidity ratios are weak, with Current (0.75) and Quick (0.16) ratios below benchmark levels. Leverage remains high with a Debt-to-Equity of 1.19, deemed unfavorable. Market valuation ratios like P/E (20.97) are neutral, while asset efficiency and interest coverage ratios are favorable, resulting in an overall neutral assessment.
Shareholder Return Policy
BJ’s Wholesale Club Holdings, Inc. does not pay dividends, reflecting a strategic choice to reinvest earnings. The company focuses on growth and capital expenditure, supported by positive free cash flow, while maintaining no share buybacks.
This reinvestment approach aligns with sustaining long-term shareholder value by prioritizing operational expansion over immediate payouts. However, absence of dividends requires monitoring to ensure capital allocation consistently generates returns exceeding cost of capital.
Score analysis
The following radar chart illustrates BJ’s Wholesale Club Holdings, Inc.’s key financial scores across valuation, profitability, and leverage metrics:
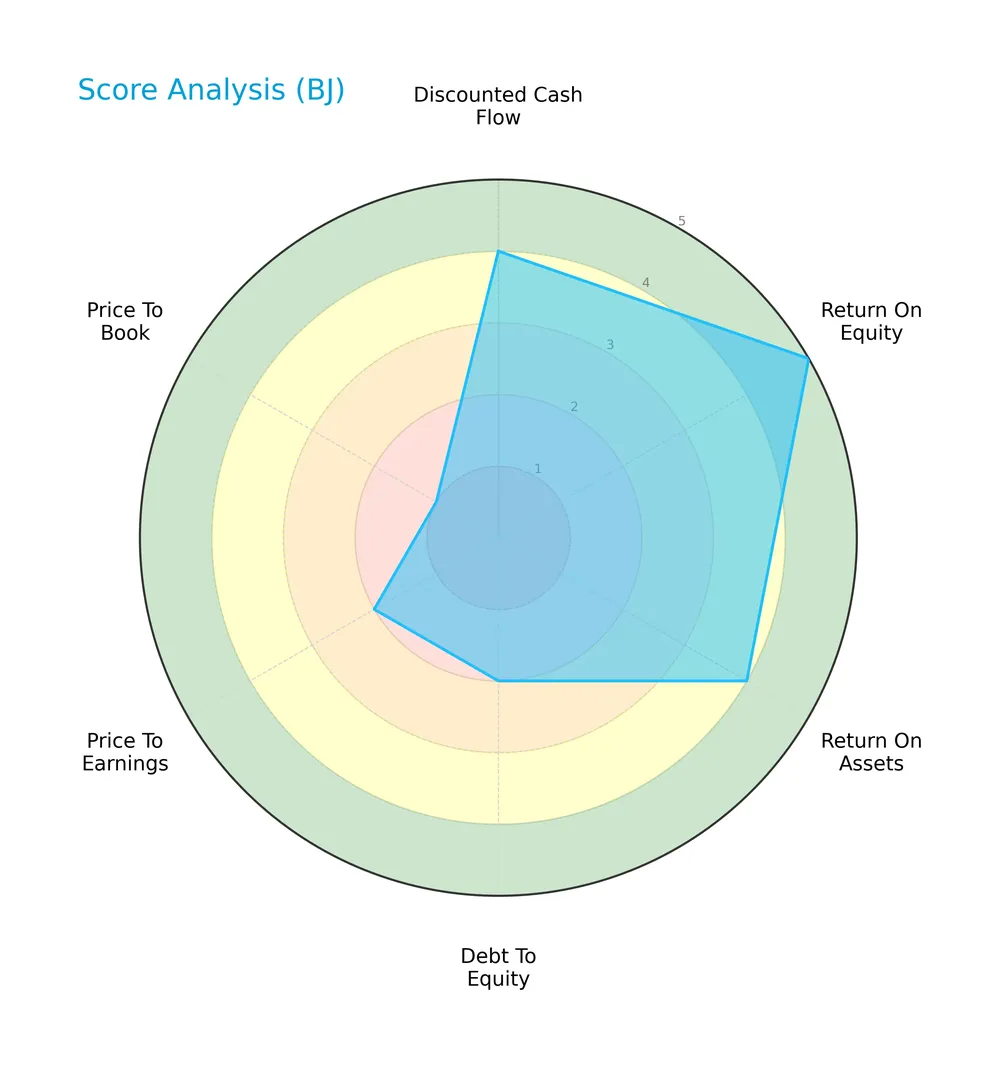
BJ scores very favorably on return on equity (5) and favorably on return on assets (4), indicating solid profitability. However, debt to equity (1) and price to book (1) scores signal significant leverage and valuation concerns. Discounted cash flow (3) and price to earnings (2) scores remain moderate to unfavorable.
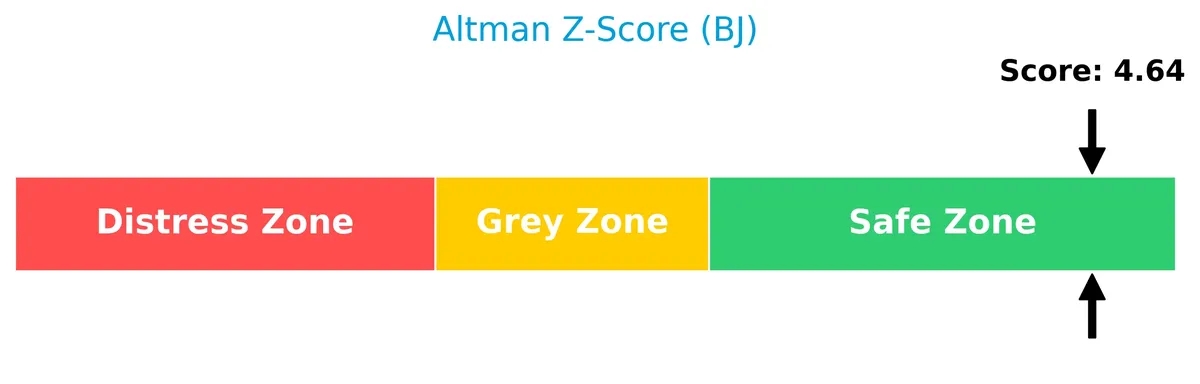
Analysis of the company’s bankruptcy risk
The Altman Z-Score places BJ in the safe zone, indicating a low risk of bankruptcy and strong financial stability:
Is the company in good financial health?
The Piotroski Score diagram reflects BJ’s financial strength with a strong score of 7, suggesting solid fundamentals and operational efficiency:

A score of 7 indicates BJ maintains good profitability, liquidity, and leverage management, placing it in a favorable position despite some valuation and debt concerns.
Competitive Landscape & Sector Positioning
This analysis examines BJ’s Wholesale Club Holdings, Inc.’s strategic positioning within the discount stores sector. I will evaluate its revenue segments, key products, and main competitors. Next, I will determine whether BJ holds a competitive advantage over its peers. Additionally, I will explore its strengths, weaknesses, opportunities, and threats through a SWOT framework.
Strategic Positioning
BJ’s Wholesale Club focuses on a concentrated geographic presence, operating 229 warehouse clubs and 160 gas stations in 17 U.S. states. Its product portfolio centers on membership fees and general merchandise sales, emphasizing recurring revenue through memberships alongside product diversification.
Revenue by Segment
This pie chart illustrates BJ’s Wholesale Club Holdings, Inc. revenue breakdown by Membership and Product segments for fiscal year 2025.
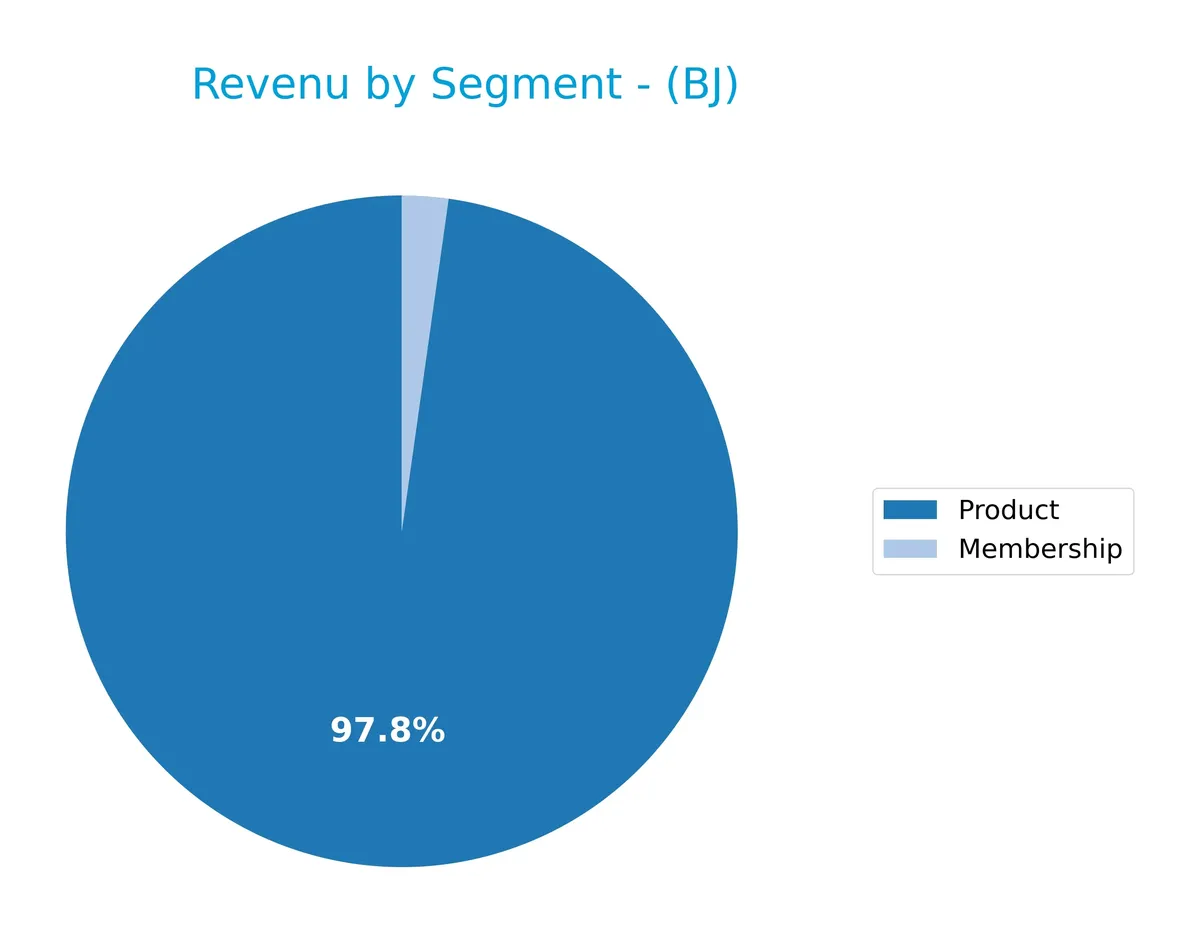
Product sales dominate BJ’s revenue, reaching $20.96B in 2025, significantly outpacing Membership revenue of $500M. Historically, product revenue has steadily grown, reflecting consumer demand and efficient inventory management. Membership fees show consistent growth, supporting a loyal customer base. The 2025 data confirms a concentration risk in product sales but highlights strong, stable dual-stream growth, which underpins BJ’s resilience amid retail sector challenges.
Key Products & Brands
The table below outlines BJ’s Wholesale Club’s main product and membership offerings:
| Product | Description |
|---|---|
| Membership | Recurring fees from club memberships, generating $500M in revenue in fiscal 2025. |
| Product | Sales of perishable goods, general merchandise, gasoline, and ancillary services, totaling $21B in fiscal 2025. |
BJ’s Wholesale Club generates the bulk of its revenue from product sales, supported by a growing membership base. Membership fees provide steady income, while product sales reflect the company’s broad retail offering in warehouse clubs.
Main Competitors
There are 6 main competitors in the Discount Stores industry; here are the top 10 leaders by market capitalization:
| Competitor | Market Cap. |
|---|---|
| Walmart Inc. | 899B |
| Costco Wholesale Corporation | 379B |
| Target Corporation | 46B |
| Dollar General Corporation | 30B |
| Dollar Tree, Inc. | 27B |
| BJ’s Wholesale Club Holdings, Inc. | 12B |
BJ’s Wholesale Club ranks 6th among its competitors. Its market cap represents just 1.45% of the leader, Walmart. BJ’s is below both the average market cap of the top 10 competitors (232B) and the sector median (38B). It maintains a 105.6% market cap gap from the next competitor above, Dollar Tree.
Comparisons with competitors
Check out how we compare the company to its competitors:
Does BJ have a competitive advantage?
BJ’s Wholesale Club Holdings, Inc. presents a slight competitive advantage, as it creates value with a ROIC 7% above its WACC. However, its profitability shows a declining trend, signaling potential challenges ahead.
Looking forward, BJ’s operates 229 warehouse clubs and expanding digital sales channels, positioning it to leverage new markets and ancillary services growth. The company’s large footprint on the U.S. East Coast supports these opportunities.
SWOT Analysis
This SWOT analysis highlights BJ’s Wholesale Club Holdings, Inc.’s key internal and external factors that influence its competitive position and strategic outlook.
Strengths
- strong ROE of 26%
- favorable ROIC above WACC
- solid revenue and net income growth
Weaknesses
- weak liquidity ratios (current and quick)
- high debt-to-equity ratio
- no dividend yield
Opportunities
- expansion in e-commerce and digital sales
- growth in gas station locations
- potential margin improvement through cost control
Threats
- intense competition in discount retail
- rising operational expenses
- economic downturn risks impacting consumer spending
BJ’s demonstrates healthy profitability and value creation but faces liquidity and leverage concerns. Strategic focus should prioritize operational efficiency and cautious debt management while leveraging digital growth avenues.
Stock Price Action Analysis
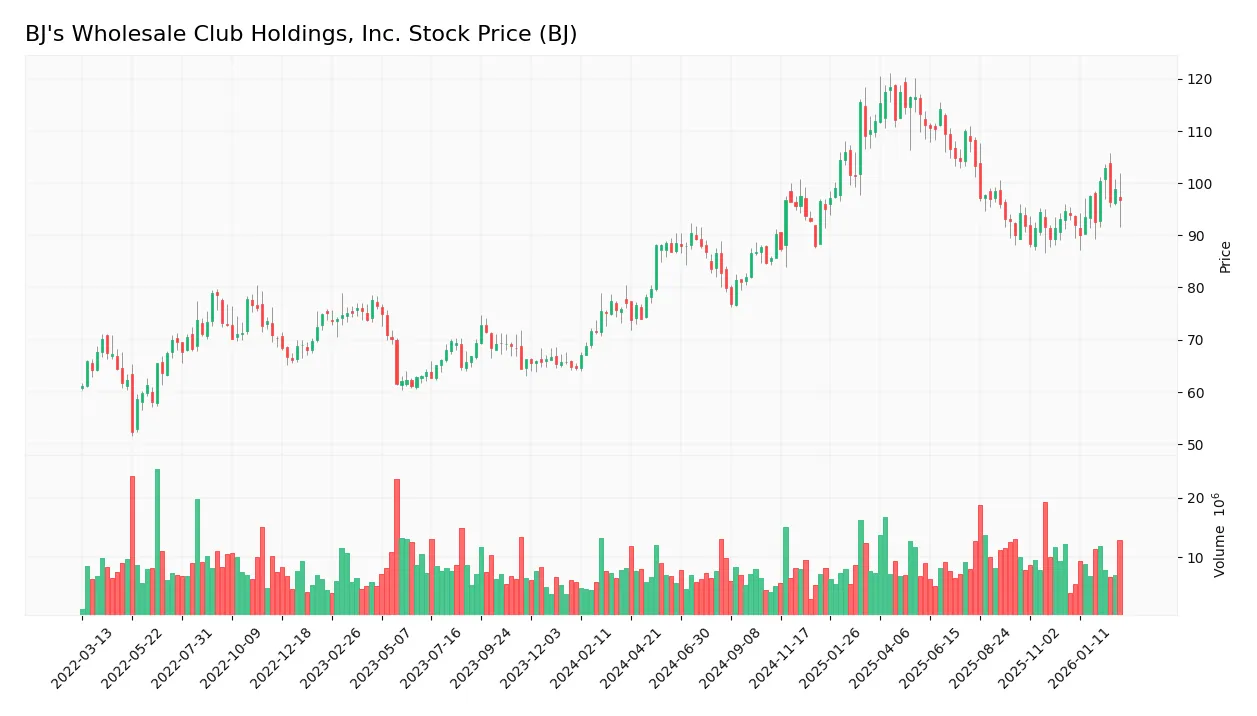
The weekly stock chart for BJ’s Wholesale Club Holdings, Inc. shows price movements over the past 12 months with notable highs and lows:
Trend Analysis
Over the past 12 months, BJ’s stock rose 34.64%, indicating a bullish trend with acceleration. The price ranged from a low of 73.98 to a high of 118.45. Volatility is elevated with a standard deviation of 10.54%, reflecting significant price swings.
Volume Analysis
Trading volume is increasing, with 54.79% buyer dominance in the recent three-month period. Buyer activity slightly exceeds seller activity, suggesting cautiously optimistic investor sentiment and growing market participation.
Target Prices
Analysts set a clear target consensus for BJ’s Wholesale Club Holdings, Inc., reflecting moderate upside potential.
| Target Low | Target High | Consensus |
|---|---|---|
| 95 | 114 | 104.67 |
The target range spans 95 to 114, with a consensus near 105, indicating cautious optimism among analysts about BJ’s future performance.

Don’t Let Luck Decide Your Entry Point
Optimize your entry points with our advanced ProRealTime indicators. You’ll get efficient buy signals with precise price targets for maximum performance. Start outperforming now!
Analyst & Consumer Opinions
This section examines BJ’s Wholesale Club Holdings, Inc.’s analyst ratings and consumer feedback to gauge market sentiment.
Stock Grades
The following table presents recent verified stock grades for BJ’s Wholesale Club Holdings, Inc. from recognized firms:
| Grading Company | Action | New Grade | Date |
|---|---|---|---|
| DA Davidson | Maintain | Buy | 2026-03-06 |
| Wells Fargo | Maintain | Overweight | 2026-02-27 |
| JP Morgan | Maintain | Neutral | 2026-02-26 |
| Goldman Sachs | Maintain | Buy | 2026-02-02 |
| Jefferies | Downgrade | Hold | 2026-01-28 |
| Morgan Stanley | Maintain | Equal Weight | 2026-01-15 |
| Barclays | Downgrade | Underweight | 2026-01-07 |
| DA Davidson | Maintain | Buy | 2025-11-24 |
| Morgan Stanley | Maintain | Equal Weight | 2025-11-24 |
| Baird | Maintain | Outperform | 2025-11-24 |
The overall trend shows a mix of stable buy and hold stances, with a few cautious downgrades earlier in 2026. This distribution reflects varied analyst sentiment, with no clear directional consensus beyond a moderate hold bias.
Consumer Opinions
Consumers express a mix of praise and frustration with BJ’s Wholesale Club Holdings, Inc., reflecting varied experiences across its offerings.
| Positive Reviews | Negative Reviews |
|---|---|
| Excellent value on bulk purchases | Checkout lines often too long |
| Friendly and helpful store staff | Limited variety in fresh produce |
| Competitive pricing compared to rivals | Website and app experience can be glitchy |
Overall, customers appreciate BJ’s competitive pricing and helpful staff but frequently cite long wait times and product variety as areas needing improvement. This feedback highlights operational challenges despite strong value perception.
Risk Analysis
Below is a summary table of key risks BJ’s Wholesale Club Holdings, Inc. faces, highlighting their likelihood and potential impact:
| Category | Description | Probability | Impact |
|---|---|---|---|
| Liquidity Risk | Current ratio at 0.75 signals tight short-term liquidity constraints. | High | Medium |
| Leverage Risk | Debt-to-equity ratio of 1.19 indicates elevated financial leverage. | Medium | High |
| Profitability Risk | Low net margin of 2.7% weakens earnings resilience. | High | Medium |
| Valuation Risk | Price-to-book ratio at 5.52 suggests potential overvaluation. | Medium | Medium |
| Dividend Policy | Zero dividend yield may deter income-focused investors. | Medium | Low |
| Market Volatility | Beta of 0.33 shows stock is less sensitive to market swings. | Low | Low |
The most pressing risks center on liquidity and profitability. BJ’s low current and quick ratios reveal potential cash flow tightness, demanding monitoring. Despite a strong Altman Z-score of 4.81 indicating financial stability, the high debt-to-equity ratio elevates vulnerability if sales soften. The modest net margin limits buffer against rising costs. These factors warrant cautious position sizing and ongoing reassessment.
Should You Buy BJ’s Wholesale Club Holdings, Inc.?
BJ’s Wholesale Club Holdings appears to be creating value with a slightly favorable moat despite a declining ROIC trend. Profitability remains robust, yet the leverage profile is substantial. The company’s overall rating is a cautious B, reflecting moderate financial strength.
Strength & Efficiency Pillars
BJ’s Wholesale Club Holdings, Inc. demonstrates operational resilience with a favorable return on equity of 26.32% and a return on invested capital (ROIC) of 12.23%. The company is a clear value creator, as its ROIC (12.23%) comfortably exceeds its weighted average cost of capital (WACC) at 5.19%. Despite a modest net margin of 2.7%, the solid interest coverage ratio of 19.96 and asset turnover of 2.86 highlight efficient capital use and manageable debt costs.
Weaknesses and Drawbacks
BJ faces valuation and liquidity challenges. Its price-to-book ratio of 5.52 signals a potential overvaluation relative to book value, while a current ratio of 0.75 and quick ratio of 0.16 raise red flags on short-term liquidity. Debt-to-equity at 1.19 points to significant leverage, increasing financial risk. These factors, combined with a neutral P/E of 20.97, suggest cautious investor sentiment, despite slightly buyer-dominant recent volumes of 54.79%.
Our Final Verdict about BJ’s Wholesale Club Holdings, Inc.
The company’s fundamentals suggest moderate financial health with clear value creation and a bullish long-term trend. Recent slight buyer dominance supports potential upside. However, valuation concerns and liquidity risks imply this equity might appear suitable for investors with a tolerance for risk and a focus on growth, but may warrant a wait-and-see stance for those seeking a safer entry point.
Disclaimer: This content is for informational purposes only and does not constitute financial, investment, or other professional advice. Investing in financial markets involves a significant risk of loss, and past performance is not indicative of future results.
Additional Resources
- Congress Asset Management Co. Acquires 41,817 Shares of BJ’s Wholesale Club Holdings, Inc. $BJ – MarketBeat (Mar 25, 2026)
- UBS Cuts BJ’s Wholesale Club Holdings, Inc. (BJ) Target to $117 After Q4 Earnings Review – Yahoo Finance (Mar 15, 2026)
- Vanguard disaggregates holdings; BJ’s (NYSE: BJ) shows 0 shares after realignment – Stock Titan (Mar 26, 2026)
- Evercore ISI Group Maintains BJ’s Wholesale Club Holdings (BJ) In-Line Recommendation – MSN (Mar 25, 2026)
- BJ’s Wholesale Club Holdings, Inc. 2025 Q4 – Results – Earnings Call Presentation (NYSE:BJ) 2026-03-10 – Seeking Alpha (Mar 10, 2026)
For more information about BJ’s Wholesale Club Holdings, Inc., please visit the official website: bjs.com