Home > Analyses > Healthcare > Biogen Inc.
Biogen transforms the fight against neurological diseases, profoundly impacting millions of lives worldwide. As a pioneer in neurodegenerative therapies, it commands respect with flagship drugs like Tecfidera and Aduhelm. Biogen’s blend of innovation and deep scientific expertise fuels its industry leadership in multiple sclerosis and Alzheimer’s treatments. Yet, in a sector marked by rapid change, I ask: do Biogen’s fundamentals justify its premium valuation and future growth prospects?

Table of contents
Business Model & Company Overview
Biogen Inc., founded in 1978 and headquartered in Cambridge, MA, commands a dominant position in neurological and neurodegenerative therapies. Its portfolio forms a cohesive ecosystem targeting multiple sclerosis, spinal muscular atrophy, Alzheimer’s, and autoimmune diseases. Biogen’s extensive pipeline and collaborations reinforce its leadership in drug innovation.
The company’s revenue engine balances proprietary pharmaceuticals like TECFIDERA and ADUHELM with biosimilars and emerging treatments. Biogen operates broadly across the Americas, Europe, and Asia, leveraging global reach to maximize impact. Its strong economic moat lies in patented therapies and strategic partnerships that shape the future of neuropharma.
Financial Performance & Fundamental Metrics
I analyze Biogen Inc.’s income statement, key financial ratios, and dividend payout policy to assess its core financial health and shareholder value creation.
Income Statement
The table below presents Biogen Inc.’s key income statement figures for fiscal years 2021 through 2025, highlighting revenue, expenses, and earnings metrics in USD.

| 2021 | 2022 | 2023 | 2024 | 2025 | |
|---|---|---|---|---|---|
| Revenue | 10.98B | 10.17B | 9.84B | 9.68B | 9.81B |
| Cost of Revenue | 2.11B | 2.28B | 2.53B | 2.31B | 2.90B |
| Operating Expenses | 6.08B | 5.01B | 5.20B | 4.88B | 5.04B |
| Gross Profit | 8.87B | 7.90B | 7.30B | 7.37B | 6.91B |
| EBITDA | 3.92B | 3.54B | 2.38B | 3.00B | 3.10B |
| EBIT | 3.44B | 3.02B | 1.88B | 2.32B | 2.17B |
| Interest Expense | 254M | 247M | 247M | 250M | 246M |
| Net Income | 1.56B | 3.05B | 1.16B | 1.63B | 1.29B |
| EPS | 10.44 | 20.97 | 8.02 | 11.20 | 8.85 |
| Filing Date | 2022-02-03 | 2023-02-15 | 2024-02-13 | 2025-02-12 | 2026-02-06 |
Income Statement Evolution
Biogen’s revenue declined by 10.7% from 2021 to 2025, with a slight 1.4% increase in 2025 alone. Gross profit and EBIT margins narrowed over this period, reflecting margin pressure. Net income fell 16.9%, while net margins contracted nearly 7%, indicating weaker profitability despite relatively stable cost management.
Is the Income Statement Favorable?
The 2025 income statement shows a 70.5% gross margin and 22.1% EBIT margin, both favorable by industry standards. However, net income dropped 21.9% year-over-year, with EPS falling 21.1%, signaling profitability challenges. Interest expense remained low at 2.5% of revenue, but overall fundamentals are unfavorable due to declining revenue, profits, and margins.
Financial Ratios
The following table presents key financial ratios for Biogen Inc. over the past five fiscal years, highlighting profitability, valuation, liquidity, leverage, and efficiency metrics:
| Ratios | 2021 | 2022 | 2023 | 2024 | 2025 |
|---|---|---|---|---|---|
| Net Margin | 14% | 30% | 12% | 17% | 13% |
| ROE | 14% | 23% | 8% | 10% | 7% |
| ROIC | 13% | 11% | 8% | 9% | 7% |
| P/E | 23 | 13 | 32 | 14 | 20 |
| P/B | 3.3 | 3.0 | 2.5 | 1.3 | 1.4 |
| Current Ratio | 1.8 | 3.0 | 2.0 | 1.3 | 2.7 |
| Quick Ratio | 1.5 | 2.6 | 1.3 | 0.9 | 2.0 |
| D/E | 0.70 | 0.49 | 0.50 | 0.40 | 0.36 |
| Debt-to-Assets | 32% | 27% | 27% | 24% | 22% |
| Interest Coverage | 11.0 | 11.7 | 8.5 | 9.9 | 7.6 |
| Asset Turnover | 0.46 | 0.41 | 0.37 | 0.34 | 0.33 |
| Fixed Asset Turnover | 2.9 | 2.7 | 2.6 | 2.7 | 3.0 |
| Dividend Yield | 0% | 0% | 0% | 0% | 0% |
Evolution of Financial Ratios
From 2021 to 2025, Biogen’s Return on Equity (ROE) declined steadily from 14.3% to 7.1%. The Current Ratio improved notably, rising from 1.83 in 2021 to 2.68 in 2025, signaling stronger liquidity. Meanwhile, the Debt-to-Equity ratio decreased from 0.70 to 0.36, reflecting reduced leverage. Profitability showed mixed trends with net margins dropping from nearly 30% in 2022 to 13.2% in 2025.
Are the Financial Ratios Favorable?
In 2025, Biogen’s ratios present a generally favorable picture. Liquidity is strong with a current ratio of 2.68 and a quick ratio above 2. Debt metrics are conservative, with a debt-to-equity ratio of 0.36 and solid interest coverage near 8.8x. Profitability is mixed: net margin is favorable at 13.2%, but ROE at 7.1% is weak compared to industry norms. Asset turnover is low, indicating efficiency challenges, while valuation multiples remain neutral.
Shareholder Return Policy
Biogen Inc. (BIIB) does not pay dividends, reflecting its strategic focus on reinvestment and growth rather than direct shareholder payouts. The absence of dividends aligns with the company’s operational priorities and investment in innovation.
The company does not engage in share buybacks either, emphasizing capital allocation towards sustaining competitive advantage. This approach supports sustainable long-term shareholder value by prioritizing internal growth over immediate income distribution.
Score analysis
The following radar chart presents Biogen Inc.’s key financial scores across valuation, profitability, and leverage metrics:
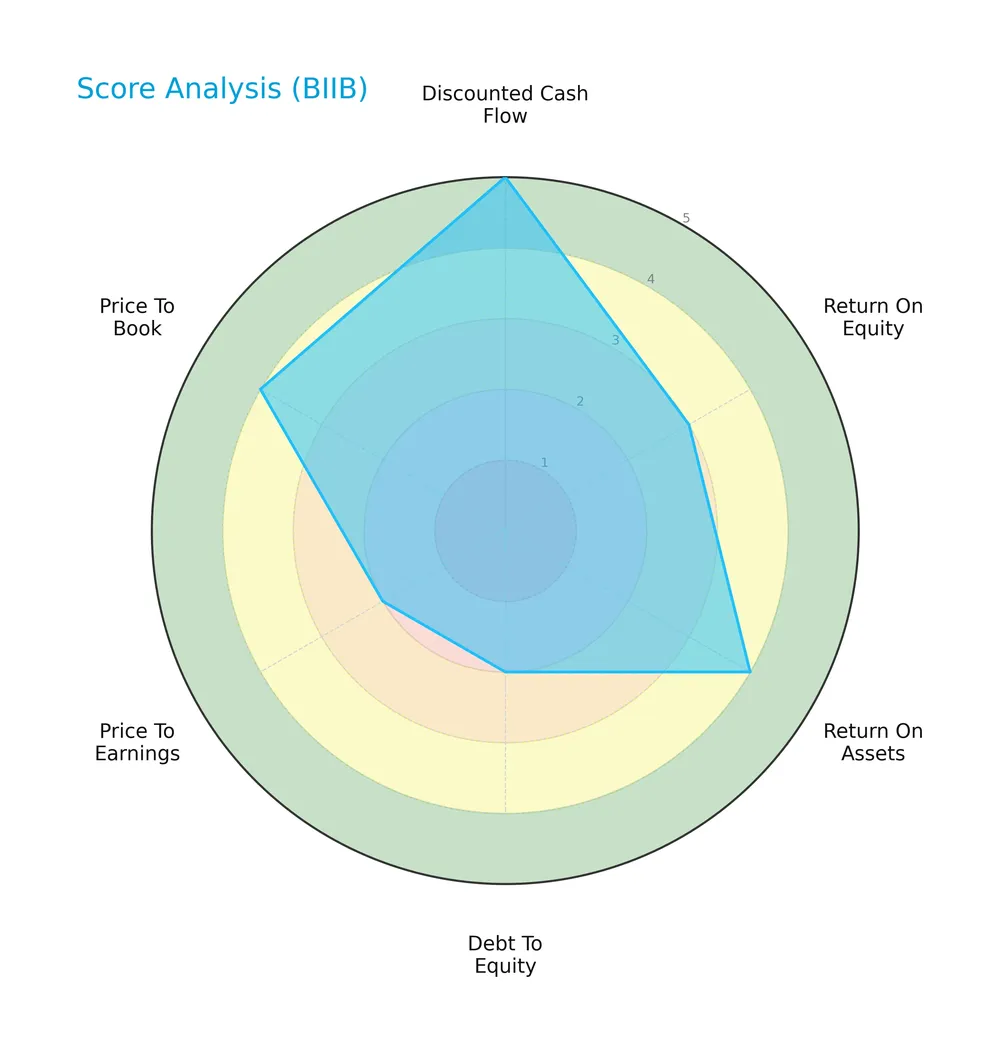
Biogen scores very favorably on discounted cash flow (5) and price-to-book (4), reflecting strong intrinsic value and asset backing. Return on assets is favorable (4), while return on equity is moderate (3). Debt-to-equity (2) and price-to-earnings (2) scores indicate weaker capital structure and valuation compared to peers.
Analysis of the company’s bankruptcy risk
Biogen’s Altman Z-Score of 3.37 places it firmly in the safe zone, signaling low bankruptcy risk and solid financial stability:

Is the company in good financial health?
The Piotroski Score diagram highlights Biogen’s financial strength based on nine accounting criteria:

With a score of 6, Biogen demonstrates average financial health. This suggests moderate operational efficiency and profitability, though not yet at the strong levels seen in top-tier firms.
Competitive Landscape & Sector Positioning
This analysis explores Biogen Inc.’s strategic role within the drug manufacturing sector. It examines its revenue sources, key products, and principal competitors. I will assess whether Biogen holds a sustainable competitive advantage over its peers.
Strategic Positioning
Biogen focuses on neurological and neurodegenerative therapies, with a concentrated product portfolio dominated by multiple sclerosis and neuromuscular treatments. Its geographic exposure spans the US and non-US markets, with a significant revenue presence in Europe and Asia, reflecting moderate international diversification.
Revenue by Segment
This pie chart illustrates Biogen Inc.’s revenue distribution by product segment for the fiscal year 2025, highlighting the company’s diversified portfolio across key therapeutic areas.

In 2025, MS Product Revenues dominate with $4B, followed by SPINRAZA at $1.5B and TYSABRI at $1.7B. Fumarate and Interferon contribute less, signaling a narrowing focus. Notably, MS revenues declined from previous years, reflecting a slowdown. The concentration in MS and neurological products suggests moderate risk but underscores Biogen’s specialization strength in this therapeutic niche.
Key Products & Brands
The table below summarizes Biogen Inc.’s principal products and their therapeutic focus:
| Product | Description |
|---|---|
| TECFIDERA | Oral fumarate therapy for multiple sclerosis (MS). |
| VUMERITY | Oral fumarate treatment targeting MS patients. |
| AVONEX | Interferon beta-1a injection for relapsing forms of MS. |
| PLEGRIDY | Pegylated interferon beta-1a for MS, offering less frequent dosing. |
| TYSABRI | Monoclonal antibody for relapsing MS, reducing disease activity. |
| FAMPYRA | Oral therapy to improve walking in MS patients. |
| SPINRAZA | Treatment for spinal muscular atrophy (SMA), a genetic neuromuscular disorder. |
| FUMADERM | Combined fumarate and dithranol formulation for plaque psoriasis. |
| BENEPALI | Etanercept biosimilar referencing ENBREL for autoimmune diseases. |
| ADUHELM | Monoclonal antibody for Alzheimer’s disease, targeting amyloid beta plaques. |
| IMRALDI | Adalimumab biosimilar referencing HUMIRA for inflammatory conditions. |
| FLIXABI | Infliximab biosimilar referencing REMICADE, used in autoimmune disorders. |
| RITUXAN | Anti-CD20 monoclonal antibody for lymphoma, leukemia, and autoimmune diseases. |
| RITUXAN HYCELA | Combination therapy for non-Hodgkin’s lymphoma and chronic lymphocytic leukemia. |
| GAZYVA | Monoclonal antibody for chronic lymphocytic leukemia and follicular lymphoma. |
| OCREVUS | Therapy for relapsing and primary progressive MS, targeting CD20-positive B cells. |
Biogen’s portfolio centers on neurological and neurodegenerative diseases, with a strong emphasis on multiple sclerosis and neuromuscular disorders. Its biosimilars and Alzheimer’s disease treatments diversify its product mix, reflecting a strategic focus on innovative and specialty therapies.
Main Competitors
In the Healthcare sector, there are 10 main competitors, with the table below listing the top 10 leaders by market capitalization:
| Competitor | Market Cap. |
|---|---|
| Eli Lilly and Company | 970B |
| Johnson & Johnson | 500B |
| AbbVie Inc. | 405B |
| AstraZeneca PLC | 285B |
| Merck & Co., Inc. | 268B |
| Amgen Inc. | 176B |
| Gilead Sciences, Inc. | 151B |
| Pfizer Inc. | 143B |
| Bristol-Myers Squibb Company | 109B |
| Biogen Inc. | 26B |
Biogen Inc. ranks 10th among its peers, with a market cap just 3.04% that of the sector leader, Eli Lilly. The company’s valuation sits well below both the average (303B) and median (222B) market caps of its top competitors. It also shows a significant 269% gap to the next competitor above, Bristol-Myers Squibb, highlighting a steep scale difference within this competitive landscape.
Comparisons with competitors
Check out how we compare the company to its competitors:
Does Biogen Inc. have a competitive advantage?
Biogen Inc. demonstrates a slight competitive advantage by generating returns on invested capital (ROIC) above its cost of capital (WACC +2%), indicating value creation despite a declining ROIC trend. The company maintains favorable gross and EBIT margins, supporting profitability in a challenging sector.
Looking ahead, Biogen’s extensive pipeline targets neurodegenerative diseases, multiple sclerosis, and immunology, with biosimilars and novel therapies expanding market opportunities. Collaborations with leading biotech firms further bolster its innovation potential and geographic reach.
SWOT Analysis
This SWOT analysis highlights Biogen Inc.’s key internal and external factors shaping its strategic outlook.
Strengths
- Strong neurological drug portfolio
- Favorable gross and EBIT margins (~70% and 22%)
- Low financial leverage (D/E 0.36)
Weaknesses
- Declining revenue and net income growth over 5 years
- Negative EPS growth (-15%)
- Moderate ROE (7.08%) below industry average
Opportunities
- Expansion in neurodegenerative disease treatments
- Collaborations with biotech innovators
- Growth potential in biosimilars market
Threats
- Intense competition in biotech and pharma sectors
- Patent expirations risk
- Regulatory and reimbursement uncertainties
Biogen’s robust product lineup and margin structure support value creation despite declining growth. The company must leverage R&D collaborations and biosimilars to offset maturation risks. Strategic focus on innovation and market diversification is critical amid competitive and regulatory headwinds.
Stock Price Action Analysis
The weekly stock chart below illustrates Biogen Inc.’s price movements over the last 12 months, highlighting key fluctuations and trend shifts:
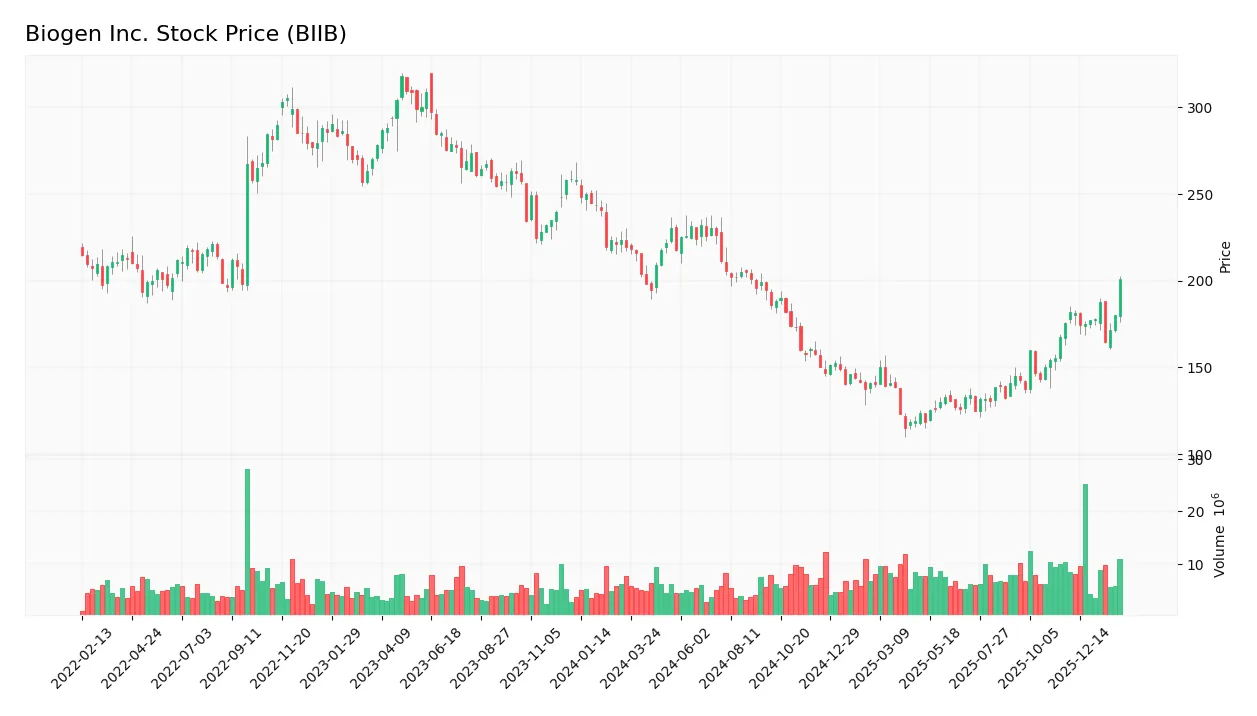
Trend Analysis
Over the past 12 months, Biogen’s stock price declined by 8.27%, indicating a bearish trend. The price range spanned from a high of 231.82 to a low of 115.17, with volatility measured by a 34.43 standard deviation. The decline accelerated over the period.
Volume Analysis
Trading volume increased recently, with total activity at 821.6M shares. Buyer volume slightly exceeds seller volume overall at 50.75%. In the last three months, buyer dominance rose sharply to 75.07%, indicating strong buying interest and heightened market participation.
Target Prices
Analysts project a target consensus of $188.75 for Biogen Inc., reflecting cautious optimism.
| Target Low | Target High | Consensus |
|---|---|---|
| 143 | 250 | 188.75 |
The range from $143 to $250 suggests varied expectations, yet the consensus near $189 signals confidence in Biogen’s growth potential.

Don’t Let Luck Decide Your Entry Point
Optimize your entry points with our advanced ProRealTime indicators. You’ll get efficient buy signals with precise price targets for maximum performance. Start outperforming now!
Analyst & Consumer Opinions
This section examines recent analyst grades and consumer feedback to provide a balanced view of Biogen Inc.’s market perception.
Stock Grades
Here are the latest verified analyst grades for Biogen Inc., reflecting current market perspectives:
| Grading Company | Action | New Grade | Date |
|---|---|---|---|
| Oppenheimer | Maintain | Outperform | 2026-01-30 |
| Citigroup | Maintain | Neutral | 2026-01-27 |
| Truist Securities | Maintain | Hold | 2026-01-08 |
| Citigroup | Maintain | Neutral | 2026-01-07 |
| Morgan Stanley | Maintain | Equal Weight | 2025-12-12 |
| HSBC | Downgrade | Reduce | 2025-12-10 |
| Wells Fargo | Maintain | Equal Weight | 2025-12-10 |
| Piper Sandler | Maintain | Neutral | 2025-11-21 |
| Stifel | Upgrade | Buy | 2025-11-06 |
| Bernstein | Maintain | Market Perform | 2025-11-03 |
The consensus leans moderately positive with a “Buy” rating overall. Most firms maintain neutral or hold positions, while a few upgrades and downgrades reflect cautious optimism mixed with selective risk concerns.
Consumer Opinions
Biogen Inc. garners a mix of enthusiasm and concern from its consumer base, reflecting its complex position in biotech innovation.
| Positive Reviews | Negative Reviews |
|---|---|
| Breakthrough therapies improve quality of life | High drug prices frustrate many customers |
| Strong focus on neurodegenerative diseases | Limited treatment options for some conditions |
| Responsive customer support | Occasional delays in medication availability |
Overall, consumers praise Biogen’s innovative treatments and patient support. However, pricing and access issues remain persistent challenges that affect satisfaction.
Risk Analysis
Below is a summary of key risks facing Biogen Inc., categorized by likelihood and potential impact:
| Category | Description | Probability | Impact |
|---|---|---|---|
| Regulatory Risk | Approval delays or rejections for new neurological drugs could stall revenue growth. | Medium | High |
| Product Pipeline | Dependency on a narrow set of therapies, especially Alzheimer’s treatments, adds concentration risk. | High | High |
| Competition | Biosimilar and generic drug competition may erode market share and pricing power. | High | Medium |
| Financial Metrics | Moderate return on equity (7.08%) vs. a low WACC (4.45%) signals cautious capital efficiency. | Medium | Medium |
| R&D Execution | High R&D spend with uncertain outcomes adds execution risk to long-term growth prospects. | Medium | High |
| Market Volatility | Low beta (0.16) suggests defensive stock, but sudden sector shifts could disrupt stability. | Low | Medium |
Biogen’s most pressing risks are pipeline concentration and regulatory hurdles, critical in the volatile biotech sector. I note its safe Altman Z-Score (3.37) reassures on bankruptcy risk, but a middling Piotroski Score (6) signals room for operational improvement. Vigilance on clinical trial progress and competitive biosimilars remains essential.
Should You Buy Biogen Inc.?
Biogen appears to be creating value with a slightly favorable moat despite declining profitability. Its leverage profile suggests moderate risk, while operational efficiency shows room for improvement. Overall, the company’s financial health could be seen as very favorable, rated A-.
Strength & Efficiency Pillars
Biogen Inc. exhibits solid operational efficiency with a gross margin of 70.47% and an EBIT margin of 22.07%. The net margin stands at a favorable 13.18%, reflecting effective cost management. Although the return on equity (7.08%) is below ideal levels, the company remains a value creator as its ROIC (6.64%) comfortably exceeds the WACC (4.45%). This spread indicates that Biogen generates returns above its cost of capital, supporting sustainable value creation despite a slightly declining ROIC trend.
Weaknesses and Drawbacks
Biogen faces several headwinds, notably an unfavorable revenue growth trend with a 10.66% decline over the period and a steep 21.85% drop in net margin growth last year. The moderate P/E ratio of 19.96 suggests a neutral valuation, but the average Piotroski score (6) signals room for financial improvement. While leverage metrics are favorable with a debt-to-equity ratio of 0.36, the unfavorable asset turnover (0.33) points to inefficient asset use. The absence of dividend yield further limits income appeal for certain investors.
Our Final Verdict about Biogen Inc.
Biogen’s profile may appear attractive for long-term exposure due to strong operational margins and value creation. However, the bearish overall stock trend (-8.27%) and recent acceleration in price volatility warrant caution. The recent period shows strong buyer dominance (75.07%), suggesting potential recovery. Investors might consider a measured approach, balancing Biogen’s fundamental strengths against market headwinds and moderate financial risks.
Disclaimer: This content is for informational purposes only and does not constitute financial, investment, or other professional advice. Investing in financial markets involves a significant risk of loss, and past performance is not indicative of future results.
Additional Resources
- Biogen Inc. (BIIB) Q4 Earnings and Revenues Top Estimates – Yahoo Finance (Feb 06, 2026)
- Biogen Inc (BIIB) Q4 2025 Earnings Call Highlights: Strong Growth in Key Products Amidst Revenue Challenges – GuruFocus (Feb 06, 2026)
- Biogen (Nasdaq: BIIB) posts $9.9B 2025 revenue and cautious 2026 outlook – stocktitan.net (Feb 06, 2026)
- Biogen (BIIB) Deep Dive: Navigating the Pivot from MS Giant to Neuro-Innovation Powerhouse – FinancialContent (Feb 06, 2026)
- Biogen stock gains after Q4 2025 beat (BIIB:NASDAQ) – Seeking Alpha (Feb 06, 2026)
For more information about Biogen Inc., please visit the official website: biogen.com