Home > Analyses > Healthcare > Bio-Techne Corporation
Bio-Techne Corporation transforms the future of biotechnology by providing critical tools that empower breakthroughs in research and clinical diagnostics. As a leader in life science reagents and advanced diagnostic solutions, Bio-Techne’s portfolio spans innovative protein analysis instruments and cutting-edge genomic assays. Renowned for its quality and market influence, the company continuously drives progress in healthcare. But in 2026, does Bio-Techne’s current valuation reflect its growth prospects and fundamental strengths?

Table of contents
Business Model & Company Overview
Bio-Techne Corporation, founded in 1976 and headquartered in Minneapolis, Minnesota, stands as a dominant player in biotechnology. It delivers an integrated ecosystem of life science reagents, instruments, and diagnostic services through its Protein Sciences and Diagnostics and Genomics segments. These offerings empower research and clinical diagnostics worldwide, spanning from biological reagents to advanced molecular diagnostic assays under well-recognized brands like R&D Systems and ProteinSimple.
The company’s revenue engine balances product sales with recurring diagnostic services, leveraging innovative instruments alongside consumables. Bio-Techne maintains a strategic footprint across the Americas, Europe, and Asia, ensuring global market penetration. Its robust portfolio and multi-segment operations create a durable economic moat, positioning it to influence the future trajectory of life sciences and clinical diagnostics.
Financial Performance & Fundamental Metrics
This section analyzes Bio-Techne Corporation’s income statement, key financial ratios, and dividend payout policy to assess its overall financial health and investor appeal.
Income Statement
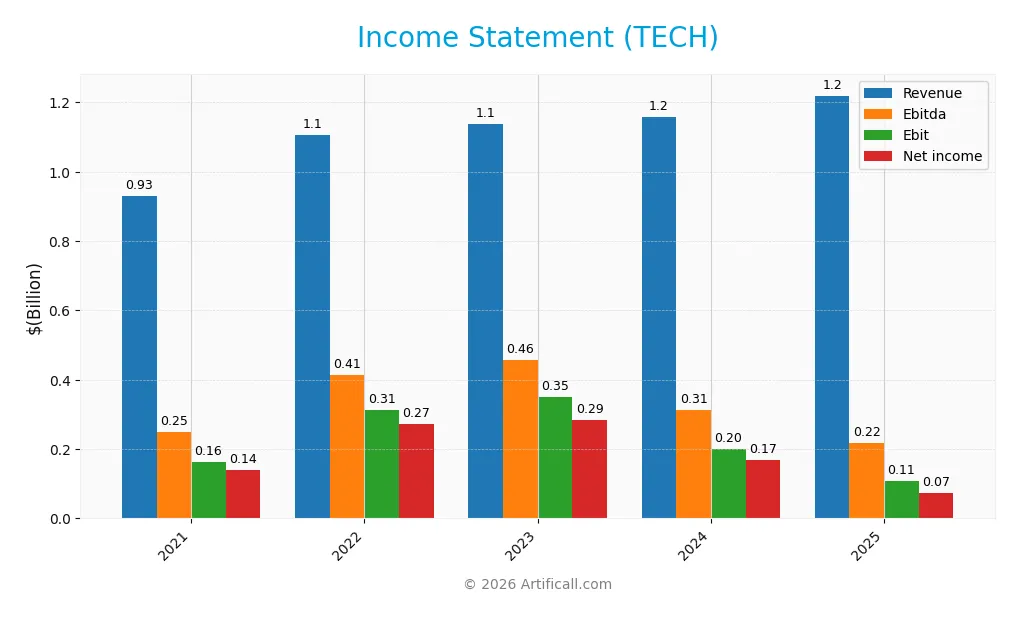
The table below summarizes Bio-Techne Corporation’s key income statement figures for fiscal years 2021 through 2025, reported in USD.
| 2021 | 2022 | 2023 | 2024 | 2025 | |
|---|---|---|---|---|---|
| Revenue | 931M | 1.11B | 1.14B | 1.16B | 1.22B |
| Cost of Revenue | 298M | 349M | 367M | 389M | 429M |
| Operating Expenses | 396M | 460M | 471M | 563M | 688M |
| Gross Profit | 633M | 756M | 770M | 770M | 790M |
| EBITDA | 250M | 414M | 457M | 313M | 217M |
| EBIT | 162M | 313M | 350M | 201M | 107M |
| Interest Expense | 14M | 11M | 11M | 16M | 9M |
| Net Income | 140M | 272M | 285M | 168M | 73M |
| EPS | 0.91 | 1.73 | 1.81 | 1.07 | 0.47 |
| Filing Date | 2021-08-25 | 2022-08-24 | 2023-08-23 | 2024-08-22 | 2025-08-22 |
Income Statement Evolution
Bio-Techne Corporation’s revenue grew steadily by 31.0% over 2021-2025 but showed a modest 5.23% increase in the latest year. Despite revenue growth, net income declined sharply by 47.72% over the period, with a further 58.51% drop in the last year. Gross margins remained favorable at 64.8%, while EBIT and net margins weakened, reflecting margin pressures and less efficient cost control.
Is the Income Statement Favorable?
In 2025, the company posted $1.22B in revenue with a net margin of 6.02%, classified as favorable, but EBIT margin was neutral at 8.77%. Operating expenses increased disproportionately relative to revenue, negatively impacting profitability. Declines in EBIT (-46.89%) and EPS (-56.19%) indicate underlying challenges. The overall income statement assessment is unfavorable, driven by deteriorating profitability despite stable revenue growth.
Financial Ratios
The table below presents key financial ratios for Bio-Techne Corporation (TECH) over the fiscal years 2021 to 2025, providing insight into profitability, valuation, liquidity, leverage, and operational efficiency:
| Ratios | 2021 | 2022 | 2023 | 2024 | 2025 |
|---|---|---|---|---|---|
| Net Margin | 15% | 25% | 25% | 15% | 6% |
| ROE | 9% | 16% | 15% | 8% | 4% |
| ROIC | 10% | 12% | 10% | 7% | 3% |
| P/E | 124 | 50 | 45 | 67 | 110 |
| P/B | 11 | 8 | 7 | 5 | 4 |
| Current Ratio | 3.35 | 3.44 | 4.84 | 3.87 | 3.46 |
| Quick Ratio | 2.59 | 2.64 | 3.50 | 2.75 | 2.38 |
| D/E | 0.27 | 0.19 | 0.23 | 0.20 | 0.23 |
| Debt-to-Assets | 19% | 14% | 17% | 16% | 17% |
| Interest Coverage | 17.0 | 26.2 | 26.7 | 13.1 | 12.0 |
| Asset Turnover | 0.41 | 0.48 | 0.43 | 0.43 | 0.48 |
| Fixed Asset Turnover | 3.30 | 3.83 | 3.50 | 3.38 | 3.82 |
| Dividend Yield | 0.28% | 0.37% | 0.39% | 0.45% | 0.62% |
Evolution of Financial Ratios
Between 2021 and 2025, Bio-Techne Corporation’s Return on Equity (ROE) showed a clear decline from 8.98% in 2021 to 3.83% in 2025, indicating a slowdown in profitability. The Current Ratio decreased from 4.84 in 2023 to 3.46 in 2025, reflecting a reduction in short-term liquidity. The Debt-to-Equity Ratio remained relatively stable, hovering around 0.23 in 2025, suggesting consistent leverage management.
Are the Financial Ratios Favorable?
In 2025, profitability ratios such as net margin (6.02%) were neutral, while ROE (3.83%) and ROIC (3.18%) were unfavorable compared to the weighted average cost of capital at 10.48%, signaling profitability challenges. Liquidity showed mixed signals with a favorable quick ratio (2.38) but an unfavorable current ratio (3.46). Leverage ratios, including debt-to-equity (0.23) and debt-to-assets (17.36%), were favorable, supported by a strong interest coverage ratio of 12.57. Overall, 35.7% of ratios were favorable, but the global evaluation remains unfavorable.
Shareholder Return Policy
Bio-Techne Corporation consistently pays dividends, with a payout ratio rising to 68.7% in 2025 and a dividend yield of 0.62%. The dividend per share has been stable around $0.32, supported by strong free cash flow coverage near 89%. There is no explicit mention of share buybacks.
The company’s dividend policy appears sustainable given its positive free cash flow and operating margins, though the increasing payout ratio warrants monitoring. The absence of reported share repurchases suggests a focus on dividend distributions as the primary shareholder return mechanism, supporting steady long-term value creation.
Score analysis
The following radar chart presents an overview of Bio-Techne Corporation’s key financial scores across several metrics:
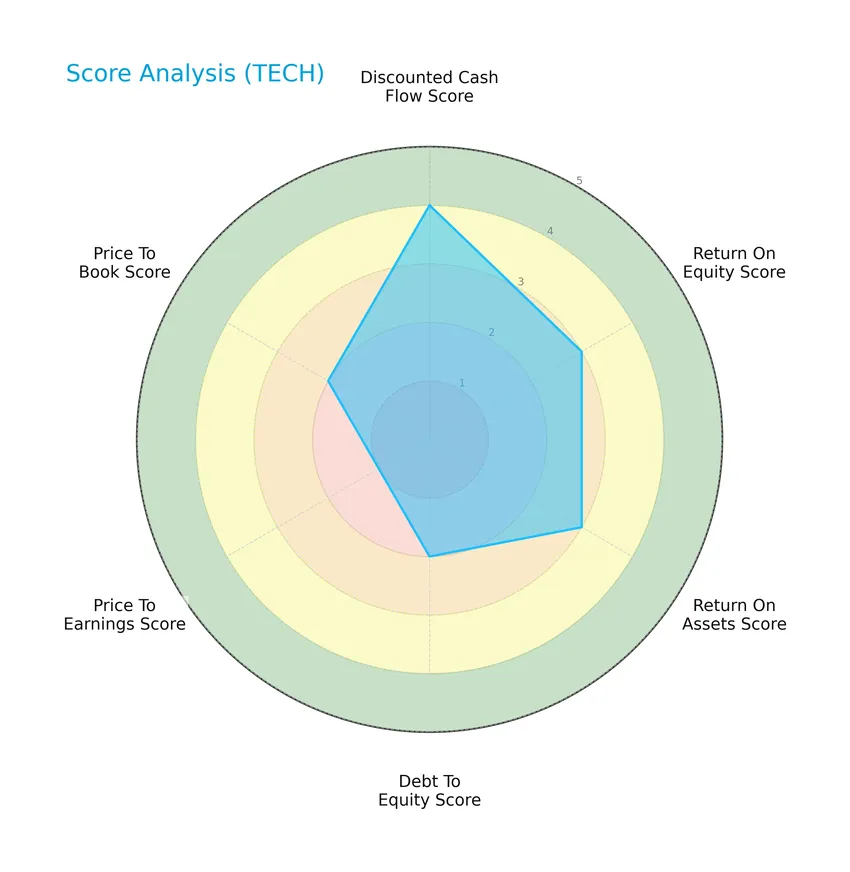
Bio-Techne shows a favorable discounted cash flow score of 4, with moderate returns on equity and assets at 3 each. The debt-to-equity and price-to-book ratios are moderate at 2, while the price-to-earnings score is very unfavorable at 1, highlighting valuation concerns.
Analysis of the company’s bankruptcy risk
Bio-Techne’s Altman Z-Score places it firmly in the safe zone, indicating a low risk of bankruptcy and strong financial stability:

Is the company in good financial health?
The Piotroski Score diagram provides insight into Bio-Techne’s financial strength and operational efficiency:

With a Piotroski Score of 7, Bio-Techne demonstrates strong financial health, reflecting solid profitability, liquidity, and efficiency metrics that support its investment profile.
Competitive Landscape & Sector Positioning
This sector analysis will explore Bio-Techne Corporation’s strategic positioning, revenue segments, key products, main competitors, and competitive advantages. I will assess whether Bio-Techne holds a competitive advantage over its peers within the biotechnology industry.
Strategic Positioning
Bio-Techne Corporation maintains a diversified product portfolio across consumables, instruments, and royalties, with 2025 revenues of $972M, $112M, and $24M respectively. Geographically, it exhibits broad exposure, generating significant sales in the U.S. ($683M), Europe ($266M), China ($100M), and other regions, reflecting a balanced global footprint.
Revenue by Segment
This pie chart displays Bio-Techne Corporation’s revenue distribution by segment for the fiscal year 2025, illustrating the contribution of each segment to the total annual revenue.
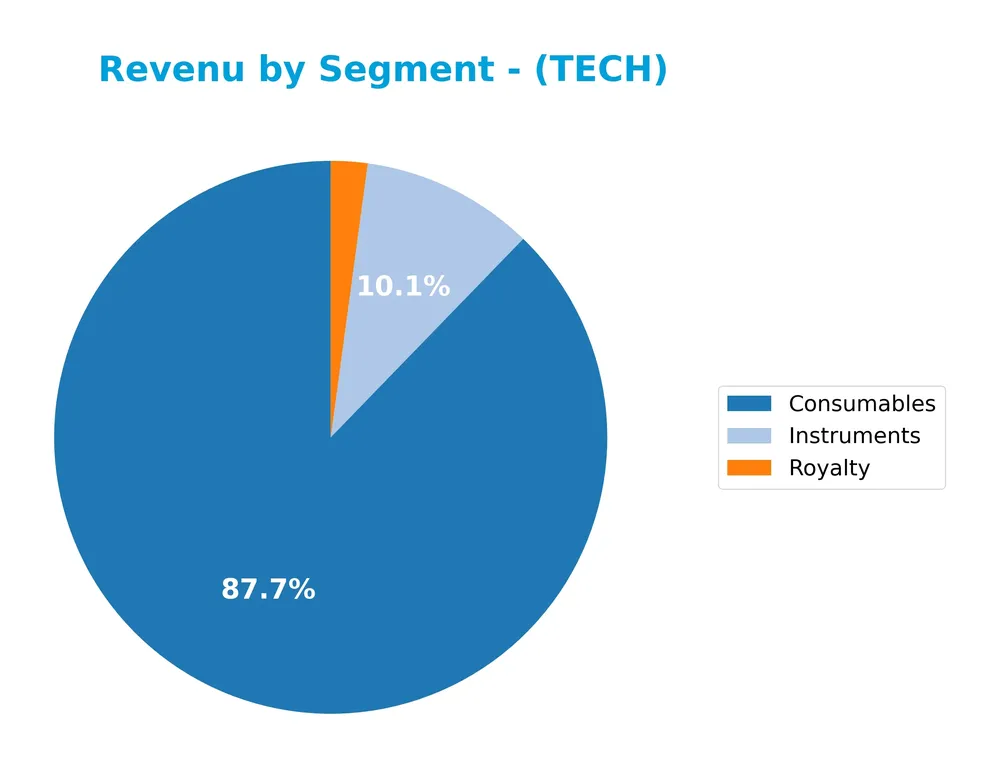
In 2025, the Consumables segment dominated Bio-Techne’s revenue with approximately 972M USD, showing consistent growth from 917M USD in 2023. Instruments also contributed significantly, generating 112M USD, slightly increasing from 108M USD in 2024. Royalty revenues remained stable around 24M USD. The data indicates a steady expansion in core product sales, with Consumables firmly driving the business, while other segments hold smaller, stable shares.
Key Products & Brands
The table below summarizes Bio-Techne Corporation’s main products and brands across its business segments:
| Product | Description |
|---|---|
| Consumables | Biological reagents such as cytokines, growth factors, antibodies, small molecules, tissue culture sera, and cell selection technologies. |
| Instruments | Protein analysis instruments including automated western blot and multiplexed ELISA systems, plus diagnostic instruments. |
| Royalty | Income generated from licensing and royalties related to proprietary technologies and products. |
| Protein Sciences Segment | Products for life science research, diagnostics, and cell and gene therapy, including proteomic analytical tools and immunoassays. |
| Diagnostics and Genomics Segment | Diagnostic assays, controls, calibrators, genetic carrier screening, oncology diagnostics, and molecular controls for clinical use. |
| Brands | Includes R&D Systems, Tocris Biosciences, Novus Biologicals, ProteinSimple, Advanced Cell Diagnostics, Exosome Diagnostics, and Asuragen. |
Bio-Techne’s product portfolio spans consumables, instruments, and diagnostic assays, marketed under multiple specialized brands supporting research and clinical diagnostics worldwide.
Main Competitors
There are 5 competitors in the Biotechnology industry, with the table listing the top 5 leaders by market capitalization:
| Competitor | Market Cap. |
|---|---|
| Vertex Pharmaceuticals Incorporated | 116B |
| Regeneron Pharmaceuticals, Inc. | 80.2B |
| Incyte Corporation | 19.9B |
| Moderna, Inc. | 12.1B |
| Bio-Techne Corporation | 9.4B |
Bio-Techne Corporation ranks 5th among its competitors, holding about 9.15% of the market cap of the leader, Vertex Pharmaceuticals. The company is positioned below both the average market capitalization of the top 10 competitors (47.5B) and the median market cap in the sector (19.9B). It maintains a 13.52% market cap gap to its next closest competitor above, Moderna.
Comparisons with competitors
Check out how we compare the company to its competitors:
Does TECH have a competitive advantage?
Bio-Techne Corporation currently does not present a competitive advantage, as evidenced by a very unfavorable moat status with declining ROIC and value destruction over the 2021-2025 period. The company’s ROIC is significantly below its WACC, indicating it is shedding value and experiencing decreasing profitability.
Looking ahead, Bio-Techne operates in biotechnology with diverse segments including Protein Sciences and Diagnostics and Genomics, supporting potential market opportunities. Its global presence, including growing revenue in regions like Europe and the US, suggests avenues for new product development and geographic expansion that could influence future performance.
SWOT Analysis
This SWOT analysis highlights the key internal and external factors influencing Bio-Techne Corporation’s strategic positioning.
Strengths
- strong brand portfolio
- diversified product segments
- favorable gross margin of 64.8%
Weaknesses
- declining net income over 5 years
- unfavorable EBIT and net margin growth
- high valuation multiples (PE 110.41, PB 4.22)
Opportunities
- expanding global market, especially in Europe and China
- growth in diagnostics and genomics demand
- leveraging advanced proteomic technologies
Threats
- intense biotechnology competition
- regulatory risks in healthcare markets
- sensitivity to economic cycles affecting research budgets
Overall, Bio-Techne shows solid strengths in product diversity and margin control but faces significant profitability and growth challenges. Strategic focus should prioritize operational efficiency and innovation to capitalize on growing diagnostics markets while managing valuation risks.
Stock Price Action Analysis
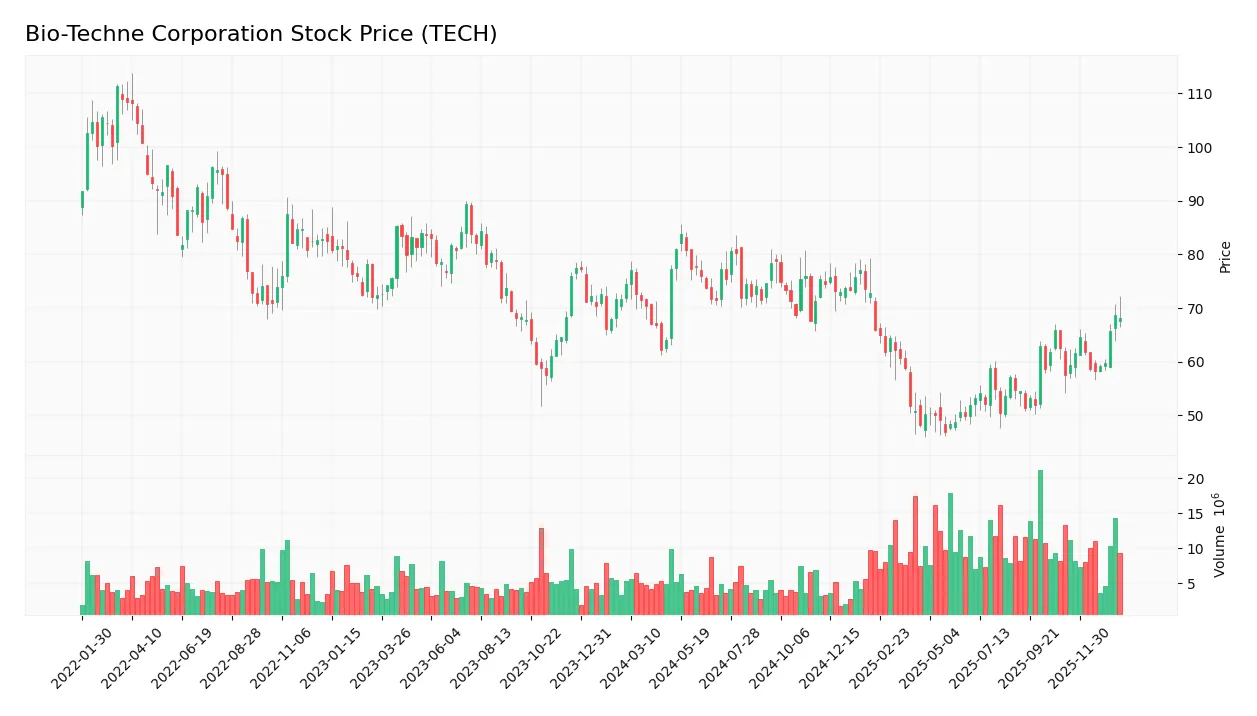
The following weekly stock chart illustrates the price movement and volatility of Bio-Techne Corporation (TECH) over the last 100 weeks:
Trend Analysis
Over the past 12 months, Bio-Techne Corporation’s stock price declined by 8.36%, indicating a bearish trend with accelerating downward momentum. The price fluctuated between a high of 83.81 and a low of 46.78, exhibiting significant volatility with a standard deviation of 10.06. Recent months show an 18.72% rebound from November 2025 to January 2026.
Volume Analysis
Trading volume has been increasing overall, with a total of 874M shares exchanged and sellers slightly dominating historically at 53.67%. However, in the recent period from November 2025 to January 2026, buyer volume slightly exceeded sellers with 53.52% dominance, signaling mildly positive investor sentiment and increased market participation.
Target Prices
The consensus target prices for Bio-Techne Corporation indicate moderate upside potential according to current analyst estimates.
| Target High | Target Low | Consensus |
|---|---|---|
| 73 | 62 | 68.75 |
Analysts expect the stock price to range between 62 and 73, with an average consensus target near 68.75, reflecting cautious optimism.

Don’t Let Luck Decide Your Entry Point
Optimize your entry points with our advanced ProRealTime indicators. You’ll get efficient buy signals with precise price targets for maximum performance. Start outperforming now!
Analyst & Consumer Opinions
This section examines recent analyst ratings and consumer feedback regarding Bio-Techne Corporation’s market performance and products.
Stock Grades
Here is the latest summary of Bio-Techne Corporation’s stock grades from recognized analysts:
| Grading Company | Action | New Grade | Date |
|---|---|---|---|
| Evercore ISI Group | Downgrade | In Line | 2026-01-05 |
| Argus Research | Maintain | Buy | 2025-11-20 |
| Wells Fargo | Maintain | Overweight | 2025-11-06 |
| UBS | Maintain | Buy | 2025-11-06 |
| TD Cowen | Maintain | Buy | 2025-10-14 |
| Evercore ISI Group | Maintain | Outperform | 2025-10-07 |
| RBC Capital | Upgrade | Outperform | 2025-09-03 |
| Citigroup | Upgrade | Buy | 2025-08-21 |
| RBC Capital | Maintain | Sector Perform | 2025-08-07 |
| Scotiabank | Maintain | Sector Outperform | 2025-07-11 |
Overall, the grades show a predominantly positive consensus with multiple firms maintaining or upgrading to buy and outperform ratings. The recent downgrade by Evercore ISI Group to “In Line” slightly contrasts this trend but does not outweigh the general optimism.
Consumer Opinions
Consumers have shared varied experiences with Bio-Techne Corporation, reflecting both satisfaction and areas needing improvement.
| Positive Reviews | Negative Reviews |
|---|---|
| High-quality products with reliable performance | Customer service can be slow to respond |
| Innovative solutions that meet research needs | Pricing is on the higher side for some customers |
| Strong technical support and helpful staff | Limited availability of certain product lines |
Overall, consumers praise Bio-Techne for its innovative and high-quality products, while common criticisms focus on pricing and occasional delays in customer support.
Risk Analysis
Below is an overview of the key risks associated with Bio-Techne Corporation’s investment profile, emphasizing their likelihood and potential impact:
| Category | Description | Probability | Impact |
|---|---|---|---|
| Market Volatility | High beta (1.47) indicates stock price sensitivity to market swings, risking valuation fluctuations. | High | Medium |
| Valuation Risk | Elevated P/E ratio (110.41) suggests overvaluation, increasing downside risk if growth disappoints. | High | High |
| Profitability | Low net margin (6.02%) and unfavorable ROE (3.83%) and ROIC (3.18%) reflect weak profit generation. | Medium | Medium |
| Liquidity & Solvency | Current ratio (3.46) unfavorable despite strong quick ratio and low debt, potential working capital concerns. | Medium | Low |
| Industry Competition | Biotechnology sector is highly competitive and innovation-driven, with risk of product obsolescence. | Medium | High |
| Regulatory | Stringent healthcare regulations may delay product approvals impacting revenue timelines. | Medium | High |
| Dividend Yield | Low dividend yield (0.62%) offers limited income, potentially reducing attractiveness for yield investors. | Low | Low |
| Financial Distress | Altman Z-Score (13.08) places the company safely out of bankruptcy risk; Piotroski score (7) is strong. | Low | Low |
The most significant risks are the high valuation coupled with moderate profitability and exposure to market volatility. Despite strong financial health indicated by the Altman Z-Score, investors should watch for potential profit margin pressure and sector-specific regulatory hurdles in 2026.
Should You Buy Bio-Techne Corporation?
Bio-Techne Corporation appears to exhibit moderate profitability with declining operational efficiency, while its competitive moat could be seen as very unfavorable due to value erosion. Despite a manageable leverage profile, the overall rating suggests a cautious B- profile with moderate financial strength.
Strength & Efficiency Pillars
Bio-Techne Corporation shows solid financial stability with an Altman Z-Score of 13.08, firmly placing it in the safe zone, which indicates a very low bankruptcy risk. The Piotroski Score of 7 reflects strong operational and financial health. Favorable debt metrics, including a low debt-to-equity ratio of 0.23 and a debt-to-assets ratio of 17.36%, support a sound capital structure. While net margin stands at a moderate 6.02%, the company maintains a quick ratio of 2.38 and interest coverage of 12.57, underscoring its liquidity strength. However, with a ROIC of 3.18% below its WACC of 10.48%, Bio-Techne is currently a value destroyer rather than a creator.
Weaknesses and Drawbacks
The valuation metrics present significant concerns. Bio-Techne’s price-to-earnings ratio is extremely elevated at 110.41, signaling a premium valuation that may not be supported by earnings growth, which has been negative over the recent period. The price-to-book ratio of 4.22 further underscores this high valuation risk. Despite a strong current ratio of 3.46, it is flagged as unfavorable likely due to potential inefficiencies in asset utilization, reflected in a low asset turnover of 0.48. The stock’s bearish overall trend with an 8.36% decline and seller dominance at 53.67% over the long term suggests persistent market pressure and a cautious investor sentiment.
Our Verdict about Bio-Techne Corporation
Bio-Techne Corporation’s long-term fundamental profile appears mixed but leans unfavorable due to value destruction and stretched valuation multiples. Despite solid financial health and liquidity measures, the company’s profitability and return metrics raise caution. The recent trend, however, shows a slight buyer dominance with a positive price change of 18.72% since November 2025, suggesting some renewed investor interest. Therefore, despite the long-term challenges, the profile may appear attractive for selective exposure while adopting a cautious, wait-and-see approach to confirm sustained recovery and valuation rationalization.
Disclaimer: This content is for informational purposes only and does not constitute financial, investment, or other professional advice. Investing in financial markets involves a significant risk of loss, and past performance is not indicative of future results.
Additional Resources
- How Investors May Respond To Bio-Techne (TECH) Doubling Down On Multi-Omic Integration Under New Leadership – Yahoo Finance (Jan 24, 2026)
- Bio-Techne to Host Conference Call on February 4, 2026, to Announce Second Quarter Fiscal 2026 Financial Results – Nasdaq (Jan 24, 2026)
- Massachusetts Financial Services Co. MA Trims Stake in Bio-Techne Corp $TECH – MarketBeat (Jan 21, 2026)
- Is Bio-Techne’s (TECH) Spatial Biology Push Under New CEO Quietly Redefining Its Core Strategy? – simplywall.st (Jan 23, 2026)
- Picks and Shovels of the Bio-Revolution: A Deep Dive into Bio-Techne Corporation (TECH) – FinancialContent (Jan 22, 2026)
For more information about Bio-Techne Corporation, please visit the official website: bio-techne.com