Home > Analyses > Consumer Cyclical > Best Buy Co., Inc.
Best Buy transforms how millions experience technology daily, blending retail with expert services. As a powerhouse in specialty retail, it leads with cutting-edge consumer electronics, appliances, and tech solutions. Its iconic Geek Squad and expansive footprint reinforce its market influence and brand loyalty. Yet, in an evolving digital landscape, I question if Best Buy’s fundamentals sustain its valuation and growth, making this analysis crucial for investors eyeing durable returns.

Table of contents
Business Model & Company Overview
Best Buy Co., Inc., founded in 1966 and headquartered in Richfield, Minnesota, stands as a dominant player in the specialty retail sector. With 1,144 stores primarily in the United States and Canada, it creates a cohesive ecosystem of technology and consumer products, ranging from computing devices and mobile phones to home appliances and entertainment hardware. This broad portfolio reflects a core mission to connect customers with innovative tech solutions across multiple lifestyle categories.
The company’s revenue engine balances product sales with value-added services, including consultation, installation, repair, and technical support. Its presence spans key global markets in North America, leveraging both physical stores and e-commerce platforms. Best Buy’s integrated approach, combining hardware and recurring service revenues, builds a durable economic moat that shapes the future of tech retail.
Financial Performance & Fundamental Metrics
I analyze Best Buy Co., Inc.’s income statement, key financial ratios, and dividend payout policy to assess its financial health and shareholder value creation.
Income Statement
The following table summarizes Best Buy Co., Inc.’s key income statement metrics for fiscal years 2022 through 2026, showing revenue, expenses, and profitability trends.

| 2022 | 2023 | 2024 | 2025 | 2026 | |
|---|---|---|---|---|---|
| Revenue | 51.8B | 46.3B | 43.5B | 41.5B | 41.7B |
| Cost of Revenue | 40.1B | 36.4B | 33.8B | 32.1B | 32.3B |
| Operating Expenses | 8.6B | 8.1B | 8.0B | 7.6B | 7.98B |
| Gross Profit | 11.6B | 9.9B | 9.6B | 9.4B | 9.4B |
| EBITDA | 3.9B | 2.7B | 2.6B | 2.2B | 2.3B |
| EBIT | 3.0B | 1.8B | 1.7B | 1.3B | 1.5B |
| Interest Expense | 25M | 35M | 52M | 51M | 47M |
| Net Income | 2.5B | 1.4B | 1.2B | 927M | 1.1B |
| EPS | 9.94 | 6.31 | 5.70 | 4.31 | 5.06 |
| Filing Date | 2022-03-18 | 2023-03-17 | 2024-03-15 | 2025-03-19 | 2026-03-18 |
Income Statement Evolution
Best Buy’s revenue declined 19.5% from 2022 to 2026, while net income dropped 56.4%. Gross profit fell slightly, reflecting margin pressure. The net margin shrank by nearly 46%, signaling diminished profitability. However, the latest year showed a modest 0.4% revenue increase and a 7.8% EBIT growth, indicating some operational improvement despite overall softness.
Is the Income Statement Favorable?
In 2026, Best Buy posted a gross margin of 22.48%, deemed favorable, yet EBIT and net margins remained neutral at 3.48% and 2.56%, respectively. Interest expenses are low at 0.11% of revenue, supporting financial stability. EPS rose 17.8% year-over-year, but revenue and gross profit growth remain weak. Overall, fundamentals present a mixed, largely unfavorable picture given long-term declines.
Financial Ratios
The following table presents key financial ratios for Best Buy Co., Inc. (BBY) over the last five fiscal years, illustrating trends in profitability, liquidity, leverage, and market valuation:
| Ratios | 2022 | 2023 | 2024 | 2025 | 2026 |
|---|---|---|---|---|---|
| Net Margin | 4.74% | 3.06% | 2.86% | 2.23% | 2.56% |
| ROE | 81.26% | 50.77% | 40.65% | 33.01% | 36.07% |
| ROIC | 32.42% | 19.04% | 15.66% | 16.61% | 13.87% |
| P/E | 9.82 | 13.49 | 13.28 | 19.93 | 12.85 |
| P/B | 7.98 | 6.85 | 5.40 | 6.58 | 4.63 |
| Current Ratio | 0.99 | 0.98 | 1.00 | 1.03 | 1.11 |
| Quick Ratio | 0.43 | 0.41 | 0.37 | 0.39 | 0.43 |
| D/E | 1.30 | 1.42 | 1.30 | 1.44 | 1.39 |
| Debt-to-Assets | 22.50% | 25.17% | 26.61% | 27.42% | 28.17% |
| Interest Coverage | 119.88 | 51.29 | 30.27 | 33.75 | 29.55 |
| Asset Turnover | 2.96 | 2.93 | 2.90 | 2.81 | 2.84 |
| Fixed Asset Turnover | 10.55 | 9.08 | 8.66 | 8.38 | 8.59 |
| Dividend Yield | 2.86% | 4.12% | 4.86% | 4.37% | 5.83% |
Evolution of Financial Ratios
From 2022 to 2026, Best Buy’s Return on Equity (ROE) showed significant variation, peaking at over 80% in 2022 and stabilizing around 36% in 2026. The Current Ratio improved slightly, rising from just under 1.0 to about 1.11, indicating modestly better liquidity. The Debt-to-Equity ratio remained consistently elevated near 1.3-1.4, reflecting stable but high leverage. Profitability margins narrowed, with net margin declining to 2.56% in 2026.
Are the Financial Ratios Fovorable?
In 2026, Best Buy’s profitability shows mixed signals: ROE and Return on Invested Capital (ROIC) exceed the Weighted Average Cost of Capital (WACC), signaling effective capital use. However, the net margin is low at 2.56%, an unfavorable factor. Liquidity is neutral with a current ratio of 1.11 but a weak quick ratio of 0.43. Leverage is unfavorable with a debt-to-equity ratio of 1.39, though interest coverage remains strong at 30.87. Market multiples reveal a favorable P/E of 12.85 but an elevated P/B of 4.63. Overall, the ratios are slightly favorable but warrant cautious interpretation.
Shareholder Return Policy
Best Buy Co., Inc. maintains a dividend payout ratio near 75%, with a dividend per share rising from $2.79 in 2022 to $3.80 in 2026. The annual dividend yield increased to 5.8%, supported by share buybacks and coverage through free cash flow.
This distribution policy balances returns with capital expenditure, as dividend and capex coverage ratio stands above 1.3 in 2026. The approach appears consistent with sustainable long-term shareholder value, though the relatively high payout ratio warrants monitoring for potential cash flow strain.
Score analysis
The radar chart below illustrates Best Buy Co., Inc.’s key financial scores across valuation, profitability, and leverage metrics:
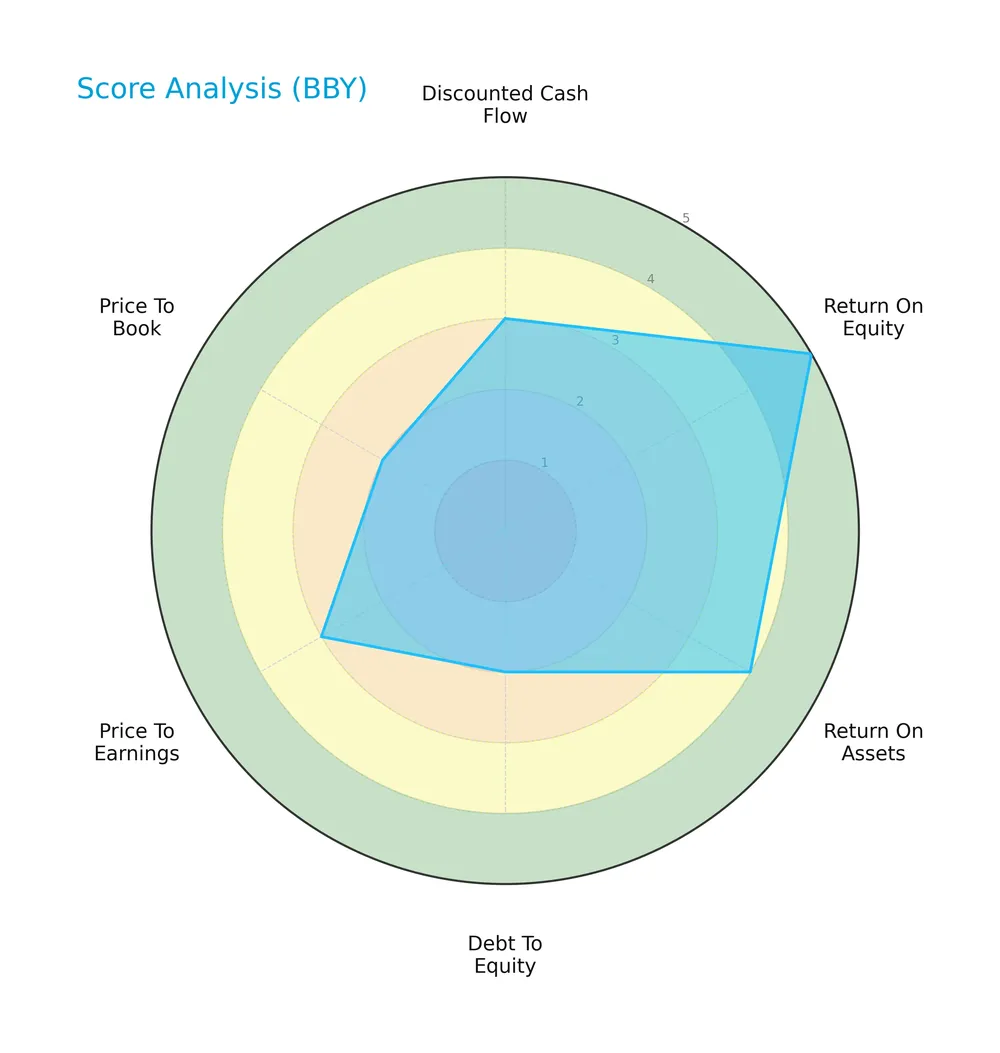
Best Buy shows very favorable return on equity (5) and favorable return on assets (4). However, debt-to-equity (1) and price-to-book (1) scores are very unfavorable. Discounted cash flow and price-to-earnings scores both rate moderate at 3.
Analysis of the company’s bankruptcy risk
The Altman Z-Score indicates Best Buy is in the safe zone, suggesting low bankruptcy risk and financial stability:

Is the company in good financial health?
The Piotroski Score diagram highlights Best Buy’s strong financial position based on profitability, leverage, and efficiency metrics:

With a score of 7, Best Buy demonstrates strong financial health, signaling solid fundamentals and operational efficiency.
Competitive Landscape & Sector Positioning
This sector analysis examines Best Buy Co., Inc.’s strategic positioning, revenue segments, and product offerings. I will evaluate whether Best Buy holds a competitive advantage over its main rivals.
Strategic Positioning
Best Buy concentrates primarily on the U.S. market, generating $38.3B in domestic revenue versus $3.4B internationally in 2026. Its product portfolio spans technology, appliances, entertainment, and services, reflecting moderate diversification within specialty retail.
Revenue by Segment
The pie chart illustrates Best Buy Co., Inc.’s revenue distribution by product segment for fiscal year 2026, highlighting the company’s diverse income streams.

In 2026, Computing and Mobile Phones dominate with $18B, followed by Consumer Electronics at $10.5B. Appliances contribute $4.2B, showing a decline from prior years. Services and Entertainment segments generate $2.5B and $2.8B, respectively, reflecting steady but smaller roles. The data reveal a concentration risk in the top two segments, while overall revenue shows modest deceleration compared to previous fiscal years.
Key Products & Brands
Best Buy’s revenue spans technology products, appliances, entertainment, and services as detailed below:
| Product | Description |
|---|---|
| Computing and Mobile Phones | Includes desktops, notebooks, tablets, smartwatches, mobile phones, and related network services. |
| Consumer Electronics | Covers digital imaging, health and fitness devices, home theater, portable audio, smart home products. |
| Appliances | Comprises dishwashers, laundry machines, ovens, refrigerators, blenders, coffee makers, vacuums. |
| Entertainment | Encompasses drones, peripherals, movies, music, toys, gaming hardware/software, virtual reality. |
| Services | Consultation, delivery, installation, repair, technical support, warranties, memberships, and design. |
| Other Segment | Includes baby products, food and beverage, luggage, outdoor living, and sporting goods. |
Best Buy operates primarily through its Domestic and International segments, with a strong focus on computing and mobile phones as the largest revenue driver. The services segment complements product sales by enhancing customer experience.
Main Competitors
The sector includes 10 main competitors. The table below lists the top 10 leaders by market capitalization:
| Competitor | Market Cap. |
|---|---|
| Amazon.com, Inc. | 2.42T |
| Alibaba Group Holding Limited | 340B |
| PDD Holdings Inc. | 159B |
| MercadoLibre, Inc. | 102B |
| eBay Inc. | 39.4B |
| Ulta Beauty, Inc. | 27.8B |
| Tractor Supply Company | 26.9B |
| Williams-Sonoma, Inc. | 23.0B |
| Genuine Parts Company | 17.2B |
| Best Buy Co., Inc. | 14.5B |
Best Buy ranks 10th among its top competitors by market cap. It holds just 0.55% of Amazon’s market capitalization, the sector leader. The company’s market cap is below both the 317B average of the top 10 and the 33.6B median for the sector. Best Buy’s market cap trails its nearest rival, Genuine Parts, by 30.7%, highlighting a notable gap in scale.
Comparisons with competitors
Check out how we compare the company to its competitors:
Does Best Buy have a competitive advantage?
Best Buy demonstrates a competitive advantage by generating returns above its cost of capital, indicating value creation despite declining profitability. Its gross margin of 22.48% compares favorably within specialty retail, supporting its earnings capacity.
Looking ahead, Best Buy’s diverse product portfolio and services, including health-related and technical support offerings, position it to capture evolving consumer technology demands. Expansion in international markets and innovation in smart home and wearable devices offer growth opportunities.
SWOT Analysis
This SWOT analysis highlights Best Buy Co., Inc.’s core strategic factors based on current financial and market insights.
Strengths
- strong ROE at 36%
- favorable ROIC above WACC
- diversified product and service portfolio
Weaknesses
- declining revenue and net income over 5 years
- low quick ratio signals liquidity risk
- high debt-to-equity ratio
Opportunities
- expanding digital and health-related services
- growth potential in international markets
- leveraging Geek Squad for service differentiation
Threats
- intense competition from e-commerce giants
- consumer discretionary spending volatility
- margin pressure from rising operating expenses
Best Buy’s value creation is solid but weakening profitability demands strategic focus. The company must leverage service innovation and international growth to offset competitive and margin pressures.
Stock Price Action Analysis
The weekly stock price chart for Best Buy Co., Inc. (BBY) over the past 12 months shows a clear directional movement with notable volatility:

Trend Analysis
Over the past 12 months, BBY’s stock price declined by 15.43%, indicating a bearish trend. The price range spanned from a high of 102.26 to a low of 60.43, with volatility measured by a 10.59 standard deviation. The downward trend shows deceleration, suggesting a slowing pace of decline.
Volume Analysis
In the last three months, trading volume for BBY has been increasing but remains slightly seller-driven, with sellers accounting for 51.5% of activity. Buyer volume is neutral, at 48.5%. This pattern suggests cautious investor sentiment with balanced market participation.
Target Prices
Analysts set a clear target consensus for Best Buy Co., Inc., reflecting cautious optimism.
| Target Low | Target High | Consensus |
|---|---|---|
| 66 | 96 | 77.89 |
The target range from 66 to 96 indicates moderate upside potential. The consensus near 78 suggests steady confidence in the stock’s performance.

Don’t Let Luck Decide Your Entry Point
Optimize your entry points with our advanced ProRealTime indicators. You’ll get efficient buy signals with precise price targets for maximum performance. Start outperforming now!
Analyst & Consumer Opinions
This section reviews the latest analyst grades and consumer feedback regarding Best Buy Co., Inc. (BBY).
Stock Grades
Here are the latest verified analyst grades for Best Buy Co., Inc. as of early 2026:
| Grading Company | Action | New Grade | Date |
|---|---|---|---|
| Guggenheim | Maintain | Buy | 2026-03-04 |
| Goldman Sachs | Maintain | Buy | 2026-03-04 |
| Piper Sandler | Maintain | Neutral | 2026-03-04 |
| Truist Securities | Maintain | Hold | 2026-03-04 |
| Morgan Stanley | Maintain | Equal Weight | 2026-03-04 |
| Evercore ISI Group | Maintain | In Line | 2026-03-04 |
| Citigroup | Maintain | Neutral | 2026-03-04 |
| BNP Paribas | Maintain | Neutral | 2026-03-04 |
| Telsey Advisory Group | Maintain | Outperform | 2026-02-24 |
| Wedbush | Maintain | Neutral | 2026-02-24 |
The consensus leans toward a Hold, reflecting a balanced view among analysts. Buy and Outperform ratings exist but are countered by numerous Neutral and Hold assessments, indicating cautious optimism.
Consumer Opinions
Consumers express mixed sentiments about Best Buy Co., Inc., reflecting its strengths in service and product variety alongside concerns about pricing and store experience.
| Positive Reviews | Negative Reviews |
|---|---|
| Friendly and knowledgeable staff. | Prices often higher than online rivals. |
| Wide selection of electronics and gadgets. | Long wait times during peak hours. |
| Convenient store locations nationwide. | Inconsistent product availability. |
Overall, customers appreciate Best Buy’s expert staff and broad inventory. However, pricing and occasional stock shortages remain notable drawbacks. These factors influence repeat visitation and competitive positioning.
Risk Analysis
Below is a summary of key risks facing Best Buy Co., Inc., with their likelihood and potential impact:
| Category | Description | Probability | Impact |
|---|---|---|---|
| Financial Leverage | High debt-to-equity ratio (1.39) increases financial risk despite manageable interest coverage | Medium | High |
| Liquidity | Low quick ratio (0.43) signals weak short-term liquidity, risking operational flexibility | High | Medium |
| Market Volatility | Beta of 1.44 exposes stock to above-average market swings, amplifying price fluctuations | High | Medium |
| Competitive Pressure | Intense competition in specialty retail may pressure margins, evidenced by low net margin (2.56%) | Medium | High |
| Valuation Concerns | Elevated price-to-book ratio (4.63) suggests potential overvaluation and downside risk | Medium | Medium |
Among these, liquidity risk is most likely due to the low quick ratio, which may constrain the company’s ability to meet immediate obligations. Simultaneously, high financial leverage combined with thin net margins poses the greatest threat to profitability under economic stress. Best Buy’s Altman Z-Score of 4.16 places it safely above distress levels, but investors must monitor debt levels and competitive dynamics closely in 2026.
Should You Buy Best Buy Co., Inc.?
Best Buy appears to be delivering robust profitability with a slightly favorable moat, despite a declining ROIC trend. Its leverage profile signals caution, marked by substantial debt. Overall, the company suggests a solid B rating, reflecting operational efficiency tempered by financial risks.
Strength & Efficiency Pillars
Best Buy Co., Inc. demonstrates solid operational efficiency with a return on equity of 36.07% and a return on invested capital (ROIC) of 13.87%. The company is a clear value creator, as its ROIC of 13.87% comfortably exceeds the weighted average cost of capital (WACC) of 9.04%. Gross margin stands at a favorable 22.48%, underpinning stable profitability despite a muted net margin of 2.56%. The Altman Z-Score of 4.16 confirms strong financial health and solvency.
Weaknesses and Drawbacks
The company faces valuation headwinds, with a high price-to-book ratio of 4.63 signaling possible overvaluation. Leverage remains a concern, as the debt-to-equity ratio is elevated at 1.39, and the quick ratio is weak at 0.43, indicating liquidity constraints. Recent revenue growth is nearly stagnant (+0.39%), while the overall period shows a troubling decline of -19.45%. Market dynamics reveal seller dominance at 57.5%, which could pressure share price further in the near term.
Our Final Verdict about Best Buy Co., Inc.
Best Buy’s robust solvency profile and strong value creation suggest a fundamentally sound company. However, bearish price trends and recent seller dominance imply caution. Despite long-term strength, recent market pressure suggests a wait-and-see approach for a better entry point. The profile might appear attractive for investors prioritizing operational efficiency but cautious on valuation and liquidity risks.
Disclaimer: This content is for informational purposes only and does not constitute financial, investment, or other professional advice. Investing in financial markets involves a significant risk of loss, and past performance is not indicative of future results.
Additional Resources
- Best Buy jumps amid speculation it could be target for GameStop (BBY:NYSE) – Seeking Alpha (Mar 26, 2026)
- Best Buy (BBY) Shares Rise Amid GameStop (GME) Acquisition Specu – GuruFocus (Mar 26, 2026)
- Best Buy Reports Q4 FY26 Results – Best Buy (Mar 03, 2026)
- [144] BEST BUY CO INC SEC Filing – Stock Titan (Mar 23, 2026)
- Best Buy (BBY) climbs 4.6% on higher dividends – MSN (Mar 27, 2026)
For more information about Best Buy Co., Inc., please visit the official website: investors.bestbuy.com/investor-relations/overview/default.aspx