Home > Analyses > Financial Services > Berkshire Hathaway Inc.
Berkshire Hathaway shapes industries from insurance to freight rail, powering daily life with its vast and diverse operations. The conglomerate dominates multiple sectors with flagship businesses in insurance, utilities, manufacturing, and retail, backed by a legacy of disciplined capital allocation and innovation. Known for its strong leadership and market influence, Berkshire commands respect across the financial landscape. Yet, in 2026, I question whether its sprawling empire still justifies its premium valuation and growth expectations.

Table of contents
Business Model & Company Overview
Berkshire Hathaway Inc., founded in 1998 and headquartered in Omaha, Nebraska, commands a dominant position in diversified insurance and industrial sectors. Its sprawling ecosystem integrates insurance, freight rail transportation, utilities, manufacturing, and retail, creating a multifaceted platform that serves global markets. The company’s core mission revolves around long-term value creation through diversified, resilient businesses.
The company’s revenue engine balances recurring insurance premiums with industrial product sales and utility services across the Americas, Europe, and Asia. This mix stabilizes cash flow and buffers cyclicality. Berkshire’s strategic presence in natural gas, railroads, and manufacturing underpins its wide economic moat, shaping the future of multiple industries through operational scale and diversification.
Financial Performance & Fundamental Metrics
I analyze Berkshire Hathaway Inc.’s income statement, key financial ratios, and dividend payout policy to assess its core financial health and shareholder value.
Income Statement
This table presents Berkshire Hathaway Inc.’s key income statement figures for fiscal years 2021 to 2025, reflecting revenue, expenses, and profitability metrics in USD.

| 2021 | 2022 | 2023 | 2024 | 2025 | |
|---|---|---|---|---|---|
| Revenue | 355B | 234B | 439B | 371B | 371B |
| Cost of Revenue | 170B | 187B | 230B | 285B | 284B |
| Operating Expenses | 72.9B | 77.4B | 88.7B | 27.1B | 28.2B |
| Gross Profit | 185B | 47B | 209B | 87B | 88B |
| EBITDA | 127B | -15.2B | 138B | 128B | 73B |
| EBIT | 116B | -26.1B | 125B | 116B | 60B |
| Interest Expense | 4.17B | 4.35B | 5.00B | 5.20B | 5.07B |
| Net Income | 89.9B | -22.8B | 96.2B | 89.0B | 67.0B |
| EPS | 39.64 | -10.36 | 44.27 | 41.27 | 31.04 |
| Filing Date | 2022-02-28 | 2023-02-27 | 2024-02-26 | 2025-02-24 | 2026-03-02 |
Income Statement Evolution
Between 2021 and 2025, Berkshire Hathaway’s revenue remained largely stable, ending near 371B in 2025 with minimal growth. Net income, however, declined significantly over the period, dropping by over 25%. Margins contracted as net margin fell by nearly 29%, despite a modest gross profit increase, signaling margin pressure at the operational and bottom-line levels.
Is the Income Statement Favorable?
The 2025 income statement reveals mixed fundamentals. Gross margin at 23.6% and EBIT margin at 16% remain solid and favorable, supporting operational efficiency. Yet, revenue growth stalled, EBIT and net income both declined sharply year-over-year, dragging net margin down to 18%. Overall, the income statement reflects unfavorable trends, underscoring headwinds for profitability despite stable revenue.
Financial Ratios
The following table presents key financial ratios for Berkshire Hathaway Inc. from 2021 to 2025, illustrating profitability, valuation, liquidity, leverage, and efficiency metrics:
| Ratios | 2021 | 2022 | 2023 | 2024 | 2025 |
|---|---|---|---|---|---|
| Net Margin | 25% | -10% | 22% | 24% | 18% |
| ROE | 18% | -5% | 17% | 14% | 9% |
| ROIC | 10% | -2% | 10% | 4% | 4% |
| P/E | 7.5x | -29.9x | 8.1x | 11.0x | 16.2x |
| P/B | 1.34x | 1.44x | 1.38x | 1.51x | 1.51x |
| Current Ratio | 4.7x | 3.8x | 4.1x | 5.9x | 6.8x |
| Quick Ratio | 4.3x | 3.4x | 3.8x | 5.6x | 6.4x |
| D/E | 0.24x | 0.27x | 0.24x | 0.22x | 0.19x |
| Debt-to-Assets | 12% | 13% | 12% | 12% | 11% |
| Interest Coverage | 27x | -7x | 24x | 11x | 12x |
| Asset Turnover | 0.37x | 0.25x | 0.41x | 0.32x | 0.30x |
| Fixed Asset Turnover | 1.8x | 1.2x | 2.0x | 1.6x | 1.5x |
| Dividend Yield | 0% | 0% | 0% | 0% | 0% |
Evolution of Financial Ratios
Berkshire Hathaway’s Return on Equity declined from 17.7% in 2021 to 9.3% in 2025, signaling reduced profitability. The Current Ratio improved substantially, rising from 4.7 to 6.75, indicating stronger liquidity. Debt-to-Equity Ratio decreased from 0.24 to 0.19, reflecting a modest reduction in leverage. Profit margins fluctuated but remained positive since 2022.
Are the Financial Ratios Favorable?
In 2025, profitability shows mixed signals: net margin at 18.0% is favorable, but ROE (9.3%) and ROIC (4.2%) lag behind the 6.4% WACC, suggesting weak capital efficiency. Liquidity is mixed; a high Current Ratio (6.75) may indicate excess cash but is flagged unfavorable, while Quick Ratio (6.41) is favorable. Leverage ratios, including debt-to-equity (0.19) and interest coverage (11.75), are favorable. Asset turnover is low (0.3), and market valuation ratios like P/E (16.2) and P/B (1.51) are neutral. Overall, ratios are slightly favorable with notable caution on efficiency and liquidity.
Shareholder Return Policy
Berkshire Hathaway Inc. (BRK-B) does not pay dividends, maintaining a zero payout ratio and dividend yield. The company prioritizes reinvestment and capital allocation over shareholder distributions, consistent with its long-standing strategy. It does not engage in share buybacks either, reflecting a cautious capital deployment approach.
This policy aligns with Berkshire’s focus on sustainable long-term growth rather than immediate returns. By avoiding dividends and buybacks, the company preserves capital to fund acquisitions and investments. This strategy supports shareholder value through compounding, assuming disciplined capital allocation continues.
Score analysis
Here is a radar chart illustrating the key financial scores for Berkshire Hathaway Inc.:
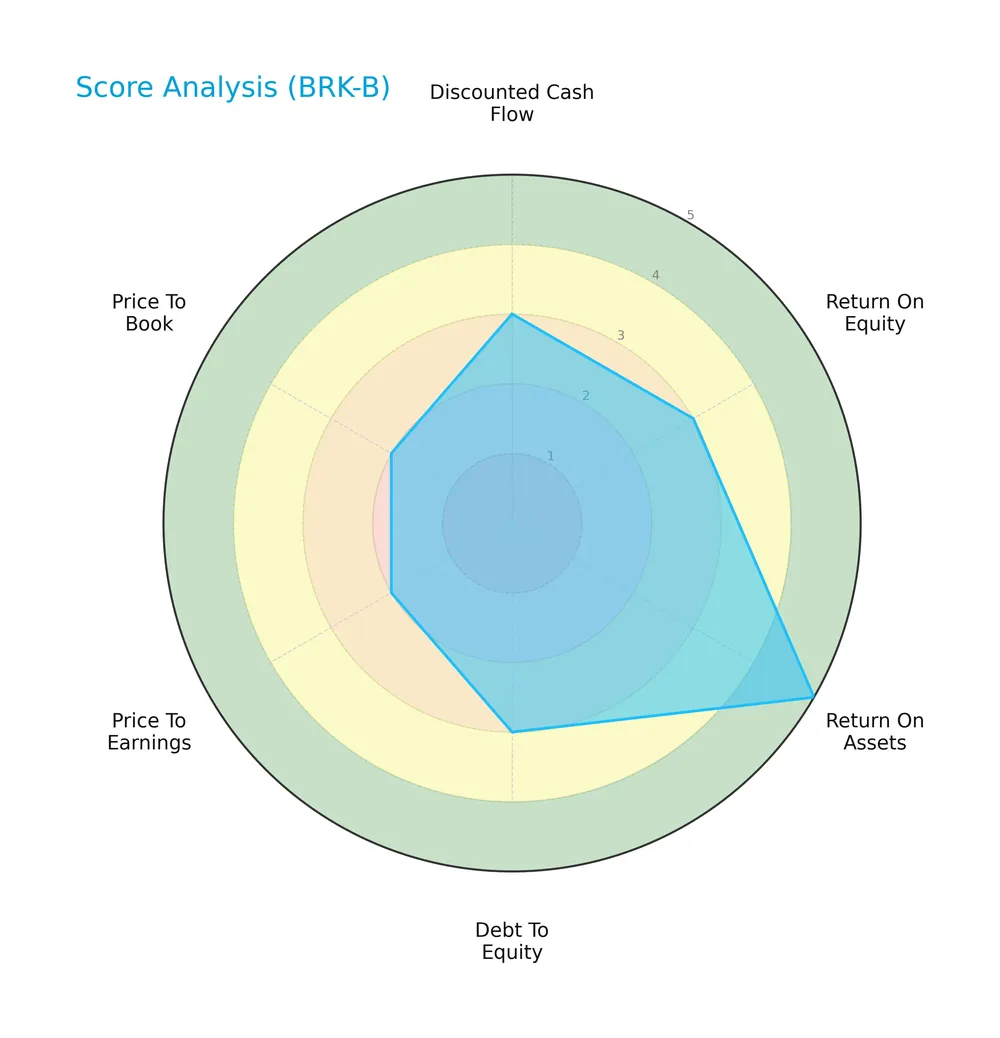
The company shows a mix of moderate and very favorable scores. Return on Assets ranks very favorable at 5, while Discounted Cash Flow, Return on Equity, and Debt to Equity scores hold moderate levels around 3. Price to Earnings and Price to Book scores are unfavorable at 2.
Analysis of the company’s bankruptcy risk
Berkshire Hathaway’s Altman Z-Score places it in the safe zone, indicating a low risk of bankruptcy and strong financial stability:

Is the company in good financial health?
The Piotroski Score diagram highlights Berkshire Hathaway’s average financial health, reflecting balanced but not outstanding financial strength:

With a score of 5, the company shows moderate profitability and efficiency, suggesting average overall financial health without clear indicators of exceptional strength or weakness.
Competitive Landscape & Sector Positioning
This analysis examines Berkshire Hathaway Inc.’s strategic positioning within the diversified insurance and financial services sector. I will evaluate its revenue segments, key products, and main competitors. I aim to determine whether Berkshire Hathaway holds a competitive advantage over its peers.
Strategic Positioning
Berkshire Hathaway maintains a highly diversified portfolio, spanning insurance, energy, rail transportation, manufacturing, retail, and services. Its geographic exposure is global but heavily focused on North America. This broad scope underpins resilience across economic cycles, balancing stable insurance cash flows with cyclical industrial and retail operations.
Revenue by Segment
This pie chart displays Berkshire Hathaway Inc.’s revenue distribution by segment for the fiscal year 2025, detailing the company’s diverse business drivers and their relative scale.

In 2025, Berkshire Hathaway Insurance Group leads with $104B, reinforcing its role as the core revenue engine. Manufacturing Businesses also contribute significantly at $78B, reflecting steady industrial demand. Mc Lane Company and Pilot Travel Centers generate $51B and $42B respectively, showing solid retail and logistics operations. Energy and Railroads segments hold stable revenues near $26B and $23B. The distribution indicates a well-balanced portfolio, though insurance concentration remains a critical factor to monitor.
Key Products & Brands
The table below outlines Berkshire Hathaway Inc.’s main products and brands with concise descriptions:
| Product | Description |
|---|---|
| Berkshire Hathaway Insurance Group | Provides property, casualty, life, accident, health insurance, and reinsurance services worldwide. |
| Burlington Northern Santa Fe Corporation | Operates freight rail transportation systems across North America. |
| Berkshire Hathaway Energy Company | Generates and distributes electricity from diverse sources; operates pipelines and natural gas facilities. |
| Manufacturing Businesses | Produces boxed chocolates, specialty chemicals, metal tools, flooring, paints, building materials, and aerospace components. |
| Mc Lane Company | Distributes groceries and foodservice products to retail and convenience stores. |
| Pilot Travel Centers (“Pilot”) | Operates travel centers providing fuel, food, and services to motorists and truckers. |
| Service And Retailing Businesses | Engages in retailing automobiles, furniture, appliances, apparel, jewelry, and offers home construction services. |
Berkshire Hathaway’s diverse portfolio spans insurance, transportation, energy, manufacturing, distribution, travel centers, and retail. This breadth supports stable revenue streams and cross-sector resilience in volatile markets.
Main Competitors
There are 5 competitors in total; the table below lists the top 5 leaders by market capitalization:
| Competitor | Market Cap. |
|---|---|
| Berkshire Hathaway Inc. | 1.07T |
| American International Group, Inc. | 45.5B |
| The Hartford Financial Services Group, Inc. | 38.2B |
| Arch Capital Group Ltd. | 34.9B |
| Principal Financial Group, Inc. | 20.1B |
Berkshire Hathaway ranks 1st among its competitors, with a market cap nearly equal to the sector leader (96.63%). It stands well above both the average market cap of the top 10 (242B) and the sector median (38.2B). The company maintains a significant lead over the next competitor below, showing strong dominance in the diversified insurance space.
Comparisons with competitors
Check out how we compare the company to its competitors:
Does BRK-B have a competitive advantage?
Berkshire Hathaway Inc. currently does not present a competitive advantage, as it is shedding value with a declining ROIC well below its WACC. The company’s profitability trend is very unfavorable, indicating decreasing returns on invested capital.
Looking ahead, Berkshire Hathaway’s diverse operations across insurance, utilities, railroads, and manufacturing provide multiple growth opportunities. New products and markets in energy and transportation could offer future avenues to stabilize and potentially improve its competitive position.
SWOT Analysis
This analysis identifies Berkshire Hathaway’s internal capabilities and external market challenges to guide strategic decisions.
Strengths
- Diversified business portfolio
- Strong brand reputation
- Low debt-to-equity ratio
Weaknesses
- Declining ROIC and profitability
- Stagnant revenue growth
- Low dividend yield
Opportunities
- Expansion in renewable energy
- Strategic acquisitions
- Growth in insurance and utilities sectors
Threats
- Economic downturn risks
- Regulatory changes in financial services
- Intense competition in core markets
Berkshire Hathaway’s diversified model shields it from sector-specific shocks but declining returns and profitability warn for strategic renewal. Focus on renewable energy and selective acquisitions could reverse value erosion.
Stock Price Action Analysis
The weekly stock chart displays Berkshire Hathaway Inc.’s price movements over the past 12 months, highlighting key highs, lows, and trend shifts:
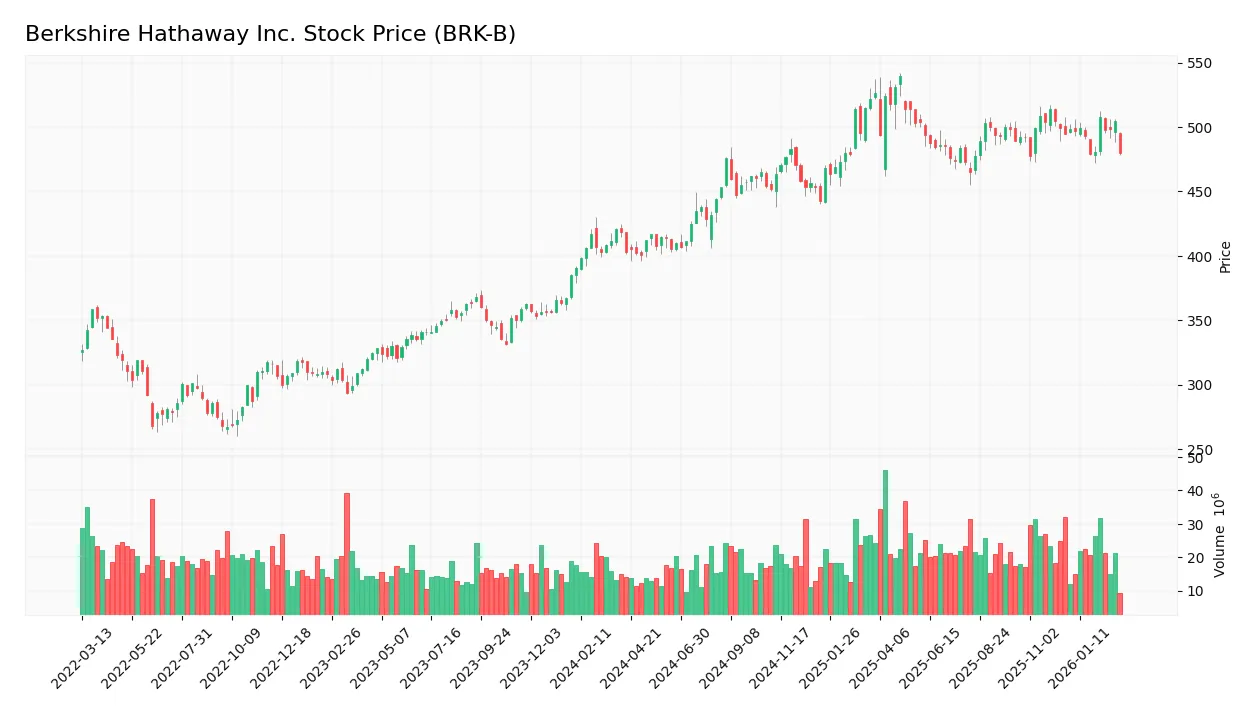
Trend Analysis
Over the past 12 months, BRK-B gained 19.07%, indicating a bullish trend, though with decelerating momentum. The stock ranged from a low of 400.87 to a high of 539.8. Volatility remains elevated, with a standard deviation of 34.08, reflecting notable price swings.
Volume Analysis
Trading volumes have increased, with buyers accounting for 52.32% of total activity, suggesting mild buyer dominance. In the recent three months, buyer volume slightly exceeds sellers at 51.48%, indicating neutral buyer behavior and stable market participation without aggressive directional conviction.
Target Prices
Analysts present a confident target consensus for Berkshire Hathaway Inc.
| Target Low | Target High | Consensus |
|---|---|---|
| 450 | 481 | 465.5 |
The target range suggests moderate upside potential, indicating steady market confidence in the stock’s valuation.

Don’t Let Luck Decide Your Entry Point
Optimize your entry points with our advanced ProRealTime indicators. You’ll get efficient buy signals with precise price targets for maximum performance. Start outperforming now!
Analyst & Consumer Opinions
This section examines Berkshire Hathaway Inc.’s analyst ratings alongside consumer feedback to provide a balanced perspective.
Stock Grades
Here are the recent grades for Berkshire Hathaway Inc. from a reputable financial institution:
| Grading Company | Action | New Grade | Date |
|---|---|---|---|
| UBS | Maintain | Buy | 2025-11-03 |
| UBS | Maintain | Buy | 2025-10-15 |
| UBS | Maintain | Buy | 2025-08-04 |
| UBS | Maintain | Buy | 2025-07-23 |
| UBS | Maintain | Buy | 2025-06-03 |
| UBS | Maintain | Buy | 2025-04-25 |
| UBS | Maintain | Buy | 2025-02-24 |
| UBS | Maintain | Buy | 2025-01-24 |
| UBS | Maintain | Buy | 2024-11-04 |
| UBS | Maintain | Buy | 2024-02-28 |
UBS consistently maintains a Buy rating on Berkshire Hathaway over nearly two years, reflecting confidence in its fundamentals. However, the consensus among analysts leans more cautiously toward Hold, indicating some divergence in market sentiment.
Consumer Opinions
Berkshire Hathaway consistently earns respect from its customers, yet some concerns persist about its vast portfolio management.
| Positive Reviews | Negative Reviews |
|---|---|
| Strong reputation for long-term value | Perceived lack of direct consumer engagement |
| Diverse business interests provide stability | Complexity of conglomerate structure confuses some investors |
| Reliable dividend history | Slow to adapt to new technology trends |
Overall, consumers praise Berkshire Hathaway’s stability and value-driven approach. However, some note its complexity and slower innovation pace as drawbacks, reflecting challenges typical for large conglomerates in evolving markets.
Risk Analysis
Below is a table summarizing key risks facing Berkshire Hathaway Inc., including their likelihood and potential impact:
| Category | Description | Probability | Impact |
|---|---|---|---|
| Market Risk | Exposure to economic cycles affecting insurance and utilities | Medium | High |
| Operational Risk | Integration complexity across diverse subsidiaries | Medium | Medium |
| Financial Risk | ROIC below WACC signals capital returns below cost of capital | Medium | High |
| Liquidity Risk | Extremely high current ratio may indicate inefficient asset use | Low | Medium |
| Valuation Risk | Neutral P/E and P/B suggest limited upside at current price | Medium | Medium |
| Dividend Policy | No dividend yield may deter income-focused investors | High | Low |
Berkshire Hathaway’s largest risks stem from its low ROIC (4.17%) relative to WACC (6.4%), signaling capital allocation challenges. Its diversified model mitigates market risk but adds operational complexity. The zero dividend yield is notable but reflects Buffett’s preference for reinvestment. Overall, financial prudence remains crucial given these mixed signals.
Should You Buy Berkshire Hathaway Inc.?
Berkshire Hathaway appears to be a moderately profitable company with a deteriorating competitive moat, suggesting value destruction through declining ROIC versus WACC. Despite a manageable leverage profile and solid liquidity, its overall B+ rating reflects a cautious but stable financial position.
Strength & Efficiency Pillars
Berkshire Hathaway Inc. delivers solid operational efficiency, reflected in a net margin of 18.03% and a strong EBIT margin of 16.03%. Its interest expense remains low at 1.36%, supporting profitability. However, the return on invested capital (4.17%) trails the weighted average cost of capital (6.4%), indicating the company is currently shedding value. While ROE is modest at 9.33%, the Altman Z-Score of 3.08 places Berkshire in the safe zone, underscoring financial stability despite some value erosion.
Weaknesses and Drawbacks
The company faces several challenges. Its price-to-earnings ratio of 16.19 and price-to-book ratio of 1.51 reflect neutral valuation but are not compelling bargains. The high current ratio of 6.75 is flagged unfavorable, possibly signaling inefficient asset utilization. Asset turnover is low at 0.3, suggesting suboptimal revenue generation from assets. Negative growth trends in net margin (-28.89%) and EPS (-21.7%) over the overall period raise concerns about declining profitability momentum. Dividend yield remains at 0%, which may deter income-focused investors.
Our Final Verdict about Berkshire Hathaway Inc.
Berkshire Hathaway exhibits a fundamentally stable profile with a safe solvency position (Altman Z-Score 3.08). Despite a bullish longer-term price trend (+19.07%), recent price weakness (-2.9%) and decelerating momentum suggest caution. The company might appear attractive for long-term exposure given its operational margins and financial safety, but recent profitability declines and valuation neutrality imply a wait-and-see approach for a better entry point.
Disclaimer: This content is for informational purposes only and does not constitute financial, investment, or other professional advice. Investing in financial markets involves a significant risk of loss, and past performance is not indicative of future results.
Additional Resources
- Berkshire Hathaway reports drop in quarterly profit on insurance operations weakness – Yahoo Finance (Feb 28, 2026)
- Berkshire Hathaway Is A Hedge For AI Bubbles (NYSE:BRK.A) – Seeking Alpha (Mar 02, 2026)
- Why Berkshire Hathaway’s Earnings Weren’t as Bad as They Looked – Barron’s (Mar 02, 2026)
- Warren Buffett Is ‘A Very Hard Act to Follow,’ Says Berkshire’s New CEO. He Wants to Make Berkshire ‘Even Stronger.’ – Investopedia (Feb 28, 2026)
- 2 Reasons to Buy Berkshire Hathaway Stock Like There’s No Tomorrow – Yahoo Finance (Mar 02, 2026)
For more information about Berkshire Hathaway Inc., please visit the official website: berkshirehathaway.com