Home > Analyses > Technology > Bentley Systems, Incorporated
Bentley Systems revolutionizes how cities and infrastructure come to life, powering design and engineering worldwide. Its software suite commands the infrastructure engineering sector, enabling seamless integration from roads and railways to complex geotechnical projects. Celebrated for innovation and precision, Bentley’s solutions underpin critical projects that shape daily life and economic growth. But as the market evolves, I ask: does Bentley’s current valuation fully reflect its growth trajectory and operational strength?

Table of contents
Business Model & Company Overview
Bentley Systems, Incorporated, founded in 1984 and headquartered in Exton, Pennsylvania, stands as a dominant player in infrastructure engineering software. Its ecosystem integrates open modeling, simulation, and project delivery applications, catering to civil, structural, geotechnical, and geospatial professionals worldwide. This cohesive suite shapes how infrastructure projects are designed, built, and maintained, reflecting a core mission to enhance global infrastructure resilience.
Bentley generates revenue by blending software licenses with recurring service agreements across the Americas, Europe, and Asia-Pacific. Its offerings span from MicroStation design tools to AssetWise asset performance systems, balancing upfront software sales with ongoing subscription income. This diversified model underpins a strong economic moat, driven by deep industry integration and long-term client relationships that fortify its market position.
Financial Performance & Fundamental Metrics
I analyze Bentley Systems, Incorporated’s income statement, key financial ratios, and dividend payout policy to assess its financial health and shareholder returns.
Income Statement
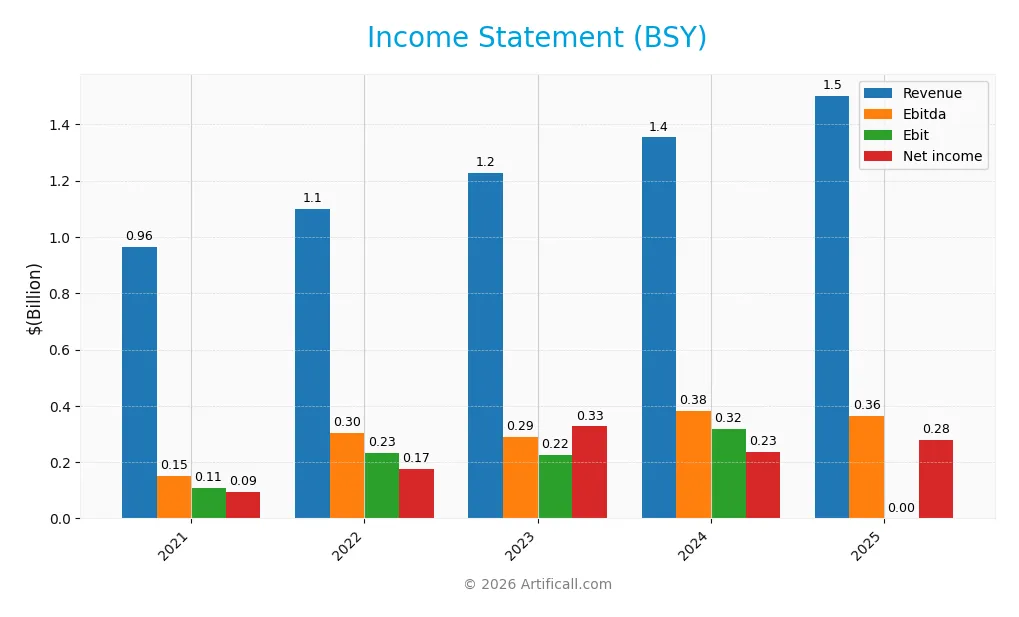
This table summarizes Bentley Systems, Incorporated’s key income statement figures for the fiscal years 2021 through 2025, reported in USD.
| 2021 | 2022 | 2023 | 2024 | 2025 | |
|---|---|---|---|---|---|
| Revenue | 965M | 1.10B | 1.23B | 1.35B | 1.50B |
| Cost of Revenue | 217M | 237M | 318M | 258M | 278M |
| Operating Expenses | 654M | 653M | 680M | 793M | 814M |
| Gross Profit | 749M | 862M | 910M | 1.10B | 1.22B |
| EBITDA | 152M | 305M | 288M | 382M | 363M |
| EBIT | 107M | 233M | 225M | 318M | N/A |
| Interest Expense | 12M | 35M | 41M | 25M | 12M |
| Net Income | 93M | 175M | 327M | 242M | 278M |
| EPS | 0.30 | 0.57 | 1.07 | 0.75 | 0.88 |
| Filing Date | 2022-03-01 | 2023-02-28 | 2024-02-27 | 2025-02-26 | 2026-02-26 |
Income Statement Evolution
Bentley Systems’ revenue rose steadily from 965M in 2021 to 1.5B in 2025, a 56% growth over five years. Net income increased nearly threefold, driven by expanding net margins that improved from around 9.7% to 18.5%. Gross margins remained consistently high near 81.5%, while operating income reversed sharply in the last year, causing EBIT margin to drop to zero.
Is the Income Statement Favorable?
In 2025, fundamentals appear generally favorable with 11% revenue growth and an 18.5% net margin. Operating expenses grew in line with revenue, supporting margin stability. However, the EBIT margin collapsed to zero, reflecting either non-recurring charges or accounting changes, signaling caution. Interest expense remains well-controlled at under 1% of revenue, supporting net income growth and EPS gains.
Financial Ratios
The following table presents key financial ratios for Bentley Systems, Incorporated from 2021 to 2025, highlighting profitability, valuation, liquidity, leverage, efficiency, and dividend metrics:
| Ratios | 2021 | 2022 | 2023 | 2024 | 2025 |
|---|---|---|---|---|---|
| Net Margin | 9.7% | 15.9% | 26.6% | 17.4% | 18.5% |
| ROE | 22.8% | 30.5% | 37.0% | 22.6% | 23.4% |
| ROIC | 4.5% | 7.3% | 8.9% | 9.3% | 13.9% |
| P/E | 159 | 65.4 | 49.9 | 62.6 | 43.2 |
| P/B | 36.1 | 20.0 | 18.5 | 14.1 | 10.1 |
| Current Ratio | 1.04 | 0.66 | 0.55 | 0.54 | 0.56 |
| Quick Ratio | 1.04 | 0.66 | 0.55 | 0.54 | 0.56 |
| D/E | 3.64 | 3.18 | 1.78 | 1.37 | 1.08 |
| Debt-to-Assets | 56.0% | 57.6% | 47.3% | 42.0% | 36.1% |
| Interest Coverage | 8.21 | 5.95 | 5.58 | 12.2 | -29.2 |
| Asset Turnover | 0.36 | 0.35 | 0.37 | 0.40 | 0.42 |
| Fixed Asset Turnover | 11.7 | 15.2 | 15.6 | 20.5 | 22.4 |
| Dividend Yield | 0.23% | 0.30% | 0.36% | 0.49% | 0.71% |
Evolution of Financial Ratios
Bentley Systems’ Return on Equity (ROE) steadily improved from 22.8% in 2021 to 23.4% in 2025, reflecting rising profitability. The Current Ratio declined sharply from 1.04 to 0.56, signaling weakening liquidity. Debt-to-Equity ratio decreased from 3.64 in 2021 to 1.08 in 2025, indicating lower leverage but still relatively high debt levels.
Are the Financial Ratios Fovorable?
Profitability ratios like net margin (18.5%) and ROE (23.4%) are favorable, showing efficient capital use. However, liquidity ratios, including current and quick ratios (~0.56), are unfavorable, raising short-term solvency concerns. Leverage remains elevated with a debt-to-equity of 1.08 and negative interest coverage. Market multiples such as P/E (43.2) and P/B (10.1) also appear overvalued, leading to an overall unfavorable financial ratio profile.
Shareholder Return Policy
Bentley Systems, Incorporated maintains a consistent dividend payout ratio near 30%, with dividends per share rising from $0.11 in 2022 to $0.27 in 2025. The annual dividend yield remains modest at around 0.7%, supported by free cash flow coverage and moderate share buyback activity.
This distribution policy appears balanced, avoiding excessive repurchases that could strain liquidity, despite a low current ratio of 0.56. The approach supports sustainable long-term shareholder value, reflecting prudent capital allocation amid moderate leverage and stable profitability.
Score analysis
The following radar chart displays Bentley Systems’ key financial scores across valuation, profitability, and leverage metrics:
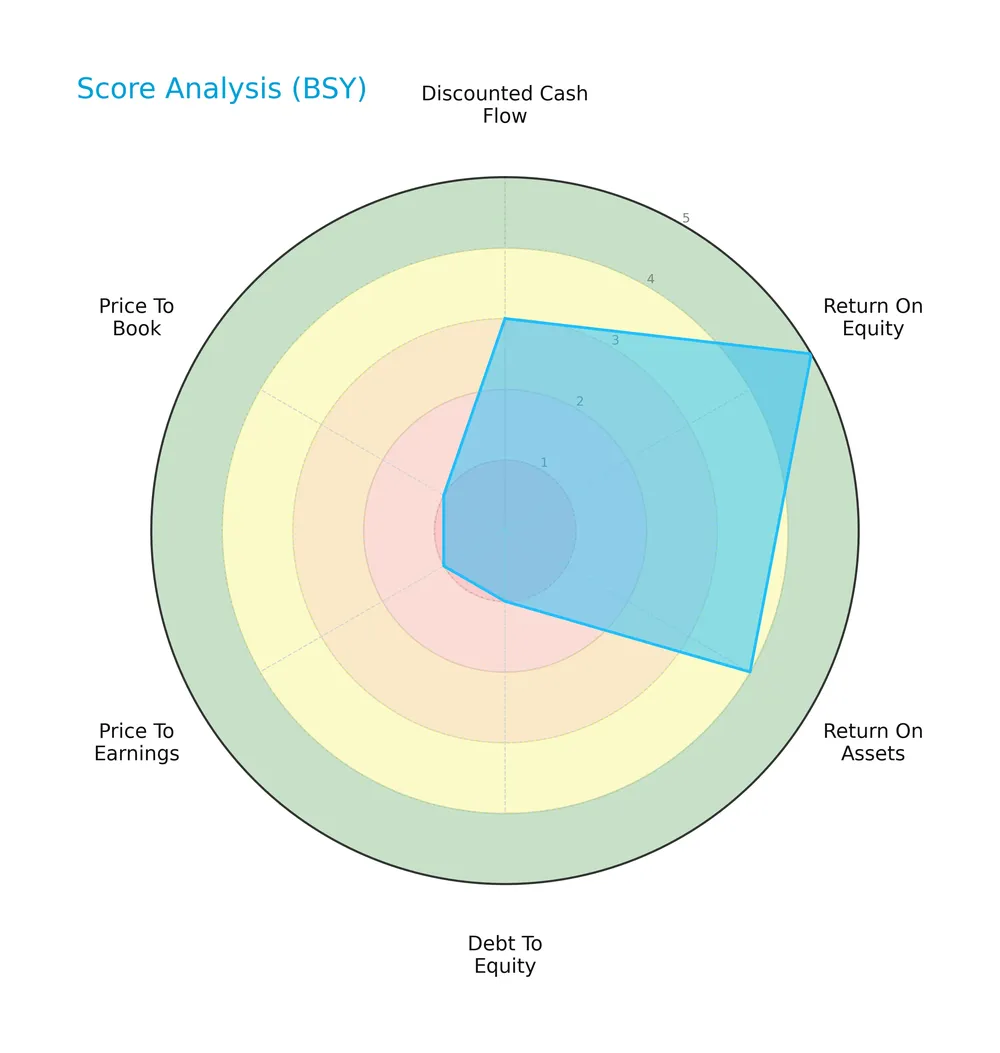
Bentley Systems scores well on return on equity (5) and return on assets (4), indicating strong profitability. However, debt-to-equity (1), price-to-earnings (1), and price-to-book (1) scores reveal significant valuation and leverage concerns.
Analysis of the company’s bankruptcy risk
Bentley Systems’ Altman Z-Score of 3.25 places it securely in the safe zone, signaling low bankruptcy risk under current financial conditions:

Is the company in good financial health?
The Piotroski Score diagram illustrates Bentley Systems’ exceptional financial strength and operational efficiency:

With a perfect Piotroski Score of 9, Bentley demonstrates very strong financial health, reflecting robust profitability, liquidity, and effective capital management.
Competitive Landscape & Sector Positioning
This analysis explores Bentley Systems’ strategic stance within the software application sector. It examines revenue streams, key products, and main competitors shaping its market presence. I will evaluate whether Bentley Systems holds a competitive advantage over its peers.
Strategic Positioning
Bentley Systems exhibits a diversified product portfolio spanning infrastructure engineering software, open modeling, project delivery, and asset performance systems. Its geographic exposure is broad, covering the Americas, EMEA, and Asia Pacific, with the largest revenue concentration in the United States, Canada, and Latin America.
Revenue by Segment
The pie chart displays Bentley Systems’ revenue breakdown by product segment for fiscal year 2025, highlighting the company’s diversified income sources.

In 2025, “Subscriptions And Licenses” dominate at $1.42B, led by “Enterprise License Subscriptions, E365 Subscriptions” with $614M and “Term License Subscriptions” at $486M. The strong growth in subscription-based models reflects Bentley’s strategic shift toward recurring revenue. Traditional “Perpetual Licenses” remain small at $46M, signaling a clear transition. Services and professional segments contribute modestly, indicating reliance on scalable software licensing.
Key Products & Brands
Bentley Systems offers a diverse portfolio of infrastructure engineering software and project delivery solutions:
| Product | Description |
|---|---|
| MicroStation and Open Modeling Apps | Includes MicroStation, OpenRoads, OpenRail, OpenPlant, OpenBuildings, OpenBridge, OpenSite, OpenFlows. |
| Structural and Geotechnical Software | STAAD, RAM, SACS, MOSES, AutoPIPE, SITEOPS, PLAXIS, GeoStudio, Leapfrog, and other subsurface modeling tools. |
| Project Delivery Systems | ProjectWise, ProjectWise Design Review Service, and SYNCHRO enable collaboration, work-sharing, and 4D modeling. |
| Asset and Network Performance Systems | AssetWise suite (ALIM, Asset Reliability, Enterprise Interoperability, 4D Analytics, Linear) and Seequent Central. |
| Industry Solutions | AssetWise Linear SUPERLOAD, ContextCapture, OpenCities, OpenUtilities, OpenTower, OpenWindPower, SPIDA, PlantSight, WaterSight. |
| Subscriptions and Licenses | Includes Enterprise License Subscriptions, E365 Subscriptions, Term License Subscriptions, SELECT Subscriptions, and Perpetual Licenses. |
Bentley’s broad software suite targets civil, structural, geotechnical, geoscience, architectural, and infrastructure project professionals worldwide. Subscriptions and licenses form the core revenue stream, reflecting the shift toward recurring software models.
Main Competitors
Bentley Systems, Incorporated competes with 33 companies in the sector; here are the top 10 leaders by market capitalization:
| Competitor | Market Cap. |
|---|---|
| Salesforce, Inc. | 242B |
| Shopify Inc. | 210B |
| AppLovin Corporation | 209B |
| Intuit Inc. | 175B |
| Uber Technologies, Inc. | 172B |
| ServiceNow, Inc. | 153B |
| Cadence Design Systems, Inc. | 84B |
| Snowflake Inc. | 73B |
| Autodesk, Inc. | 61B |
| Workday, Inc. | 55B |
Bentley Systems ranks 21st among 33 competitors, with a market cap just 4.46% that of the leader, Salesforce. The company sits below both the average market cap of the top 10 (143.6B) and the sector median (18.8B). It enjoys a 26.65% market cap cushion versus its next closest competitor above.
Comparisons with competitors
Check out how we compare the company to its competitors:
Does BSY have a competitive advantage?
Bentley Systems demonstrates a sustainable competitive advantage with a very favorable moat status. Its ROIC exceeds WACC by 5.3%, indicating efficient capital use and consistent value creation. I observe a strong growth in ROIC at 207% over 2021-2025, reinforcing its profitability momentum.
Looking ahead, Bentley’s diversification across infrastructure software and project delivery platforms supports expansion in global markets. The company’s broad portfolio, including open modeling and asset performance systems, positions it to capture emerging opportunities in infrastructure engineering worldwide.
SWOT Analysis
This SWOT analysis highlights Bentley Systems’ core strengths, weaknesses, opportunities, and threats to guide strategic decisions.
Strengths
- high gross margin (81.5%)
- strong net margin (18.5%)
- growing ROIC well above WACC (13.9% vs 8.6%)
Weaknesses
- low current and quick ratios (0.56)
- high debt-to-equity ratio (1.08)
- unfavorable P/E (43.2) and P/B (10.1) multiples
Opportunities
- expanding infrastructure software demand globally
- increasing revenue in Asia Pacific and EMEA
- rising digital transformation in civil engineering
Threats
- intense competition in software sector
- macroeconomic uncertainty impacting infrastructure spending
- currency and geopolitical risks in diverse markets
Bentley Systems demonstrates a robust competitive moat with strong profitability and growth. However, liquidity constraints and high valuation multiples warrant caution. Strategic focus on global expansion and innovation can mitigate risks from competitive and macro pressures.
Stock Price Action Analysis
The weekly stock chart for Bentley Systems, Incorporated (BSY) highlights price movements and volatility over the past 12 months:

Trend Analysis
Over the past year, BSY stock declined by 25.2%, marking a bearish trend. The price fell from a high of 58.59 to a low of 33.17, with volatility at 5.56%. The downtrend shows deceleration, indicating a slower rate of decline recently.
Volume Analysis
Trading volume has increased overall, with 878M shares traded in total. However, the last three months reveal seller dominance, as sellers accounted for 65.7% of volume. This suggests cautious investor sentiment and heightened selling pressure in recent weeks.
Target Prices
Analysts set a clear target consensus for Bentley Systems, Incorporated, reflecting moderate upside potential.
| Target Low | Target High | Consensus |
|---|---|---|
| 40 | 55 | 48 |
The target range of $40 to $55 signals cautious optimism. The consensus near $48 suggests steady growth expectations.

Don’t Let Luck Decide Your Entry Point
Optimize your entry points with our advanced ProRealTime indicators. You’ll get efficient buy signals with precise price targets for maximum performance. Start outperforming now!
Analyst & Consumer Opinions
This section examines Bentley Systems, Incorporated’s analyst ratings alongside consumer feedback to provide a balanced overview.
Stock Grades
Here are the most recent verified grades for Bentley Systems, Incorporated from leading financial firms:
| Grading Company | Action | New Grade | Date |
|---|---|---|---|
| Rosenblatt | Maintain | Buy | 2026-02-24 |
| UBS | Maintain | Neutral | 2026-02-23 |
| Oppenheimer | Maintain | Outperform | 2026-01-20 |
| Piper Sandler | Downgrade | Neutral | 2026-01-13 |
| Barclays | Maintain | Equal Weight | 2026-01-12 |
| RBC Capital | Maintain | Outperform | 2026-01-05 |
| JP Morgan | Maintain | Neutral | 2025-11-06 |
| Rosenblatt | Maintain | Buy | 2025-11-06 |
| Piper Sandler | Maintain | Overweight | 2025-11-06 |
| Baird | Maintain | Outperform | 2025-11-06 |
The consensus leans toward a Buy rating, reflecting moderate confidence in Bentley’s prospects. Notably, Piper Sandler shifted from Overweight to Neutral, indicating some recent caution.
Consumer Opinions
Bentley Systems, Incorporated (BSY) attracts a mix of admiration and critique from its user base, reflecting its complex market position.
| Positive Reviews | Negative Reviews |
|---|---|
| Intuitive software interface enhances productivity | High subscription costs limit accessibility |
| Strong customer support with quick response times | Steep learning curve for new users |
| Frequent updates with useful new features | Occasional software bugs disrupt workflows |
| Robust integration with CAD and BIM platforms | Limited customization options in certain modules |
Overall, consumers praise Bentley Systems for its powerful tools and responsive support. However, pricing and usability challenges persist, suggesting room for improvements in customer onboarding and product flexibility.
Risk Analysis
Below is a summary table highlighting the key risks facing Bentley Systems, Incorporated in 2026:
| Category | Description | Probability | Impact |
|---|---|---|---|
| Liquidity Risk | Current and quick ratios at 0.56 signal tight short-term liquidity. | High | Medium |
| Leverage Risk | Debt-to-equity ratio above 1.0 indicates aggressive borrowing. | Medium | High |
| Valuation Risk | Elevated P/E at 43.2 and P/B at 10.1 suggest overvaluation. | High | Medium |
| Profitability Risk | Strong ROE and ROIC offset by low asset turnover (0.42). | Medium | Medium |
| Interest Coverage | Near zero interest coverage raises concerns on debt servicing. | Medium | High |
Bentley’s most pressing risks stem from its weak liquidity and high leverage. Despite a safe Altman Z-score (3.25) and very strong Piotroski score (9), its low current ratio and negative interest coverage indicate financial strain under stress. Elevated valuation multiples increase downside risk in a market correction. Investors must weigh strong profitability against these financial vulnerabilities.
Should You Buy Bentley Systems, Incorporated?
Bentley Systems appears to be a very favorable investment with robust profitability and a durable competitive moat supported by growing ROIC well above WACC. Despite significant leverage reflected in a weak debt profile, its overall rating stands at B-, suggesting cautious optimism.
Strength & Efficiency Pillars
Bentley Systems, Incorporated exhibits robust operational efficiency with a net margin of 18.5% and a return on equity (ROE) of 23.36%. The company’s return on invested capital (ROIC) stands at 13.9%, comfortably above its weighted average cost of capital (WACC) of 8.64%, confirming it as a value creator. This growing ROIC trend, paired with a very strong Piotroski score of 9, signals a sustainable competitive advantage and increasing profitability over the 2021-2025 period.
Weaknesses and Drawbacks
Despite solid profitability, Bentley Systems faces significant valuation and liquidity challenges. Its price-to-earnings ratio of 43.23 and price-to-book ratio of 10.1 indicate a steep premium, raising concerns over overvaluation. The debt-to-equity ratio at 1.08 and a current ratio of 0.56 highlight financial leverage and weak short-term liquidity, which may constrain operational flexibility. Recent seller dominance at 65.7% (buyer dominance 34.3%) adds further short-term market pressure.
Our Final Verdict about Bentley Systems, Incorporated
Bentley Systems displays strong long-term fundamentals and a clear economic moat. However, despite its safe Altman Z-Score of 3.25, recent bearish trends and pronounced seller dominance suggest caution. The profile might appear attractive for long-term exposure but warrants a wait-and-see approach to mitigate near-term valuation and liquidity risks.
Disclaimer: This content is for informational purposes only and does not constitute financial, investment, or other professional advice. Investing in financial markets involves a significant risk of loss, and past performance is not indicative of future results.
Additional Resources
- Decoding Bentley Systems Inc (BSY): A Strategic SWOT Insight – GuruFocus (Feb 27, 2026)
- Why Is Bentley Systems (BSY) Stock Rocketing Higher Today – Finviz (Feb 26, 2026)
- Bentley Systems, Incorporated (BSY) Q4 Earnings Meet Estimates – Nasdaq (Feb 26, 2026)
- Compared to Estimates, Bentley Systems (BSY) Q4 Earnings: A Look at Key Metrics – Yahoo Finance (Feb 26, 2026)
- Bentley Systems Announces Fourth Quarter and Full Year 2025 Results and 2026 Financial Outlook – Business Wire (Feb 26, 2026)
For more information about Bentley Systems, Incorporated, please visit the official website: bentley.com