Home > Analyses > Healthcare > Becton, Dickinson and Company
Becton, Dickinson and Company (BDX) shapes the healthcare landscape by delivering critical medical instruments and innovative diagnostic solutions that touch millions of lives daily. As a global leader in medical supplies, laboratory equipment, and advanced drug delivery systems, BDX is renowned for its commitment to quality and cutting-edge technology. With a strong foothold across diverse healthcare segments, the question remains: do BDX’s robust fundamentals and market position still justify its current valuation and future growth prospects?

Table of contents
Business Model & Company Overview
Becton, Dickinson and Company, founded in 1897 and headquartered in Franklin Lakes, NJ, stands as a global leader in medical instruments and supplies. Its integrated ecosystem spans medical devices, laboratory equipment, and diagnostic products, serving healthcare institutions, researchers, and the public worldwide. This broad yet interconnected portfolio supports its mission to advance health outcomes through innovative solutions.
The company’s revenue engine balances sophisticated hardware—such as catheters and surgical products—with software-driven systems for medication management and laboratory automation. With a strategic footprint across the Americas, Europe, and Asia, it capitalizes on diverse markets. Becton Dickinson’s robust competitive advantage lies in its comprehensive product suite and global reach, positioning it to shape the future of healthcare delivery.
Financial Performance & Fundamental Metrics
This section provides a fundamental analysis of Becton, Dickinson and Company, focusing on its income statement, key financial ratios, and dividend payout policy.
Income Statement
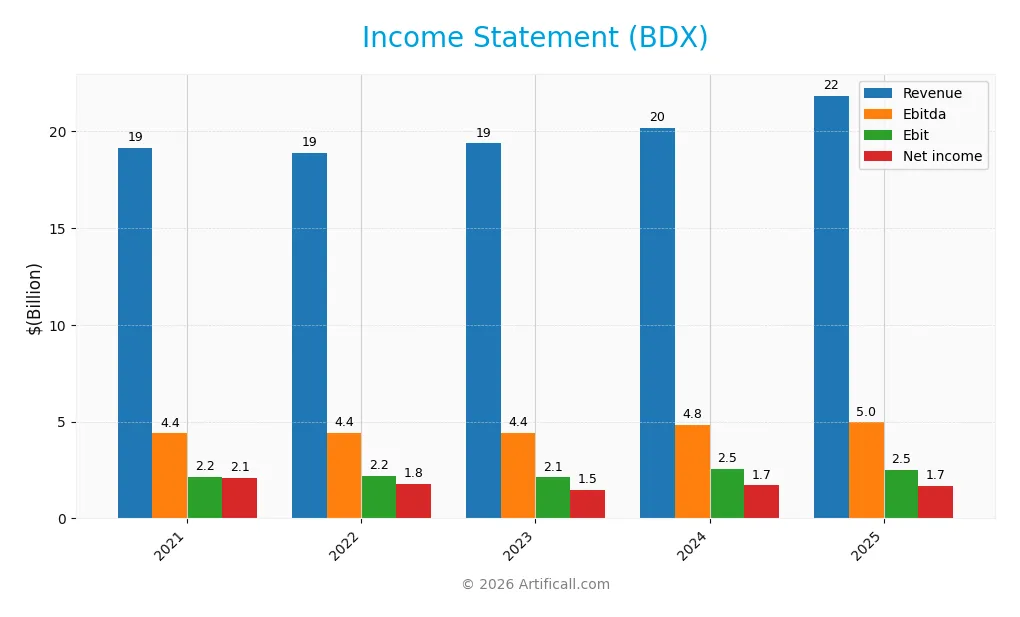
The table below summarizes Becton, Dickinson and Company’s key income statement figures for fiscal years 2021 through 2025, expressed in USD.
| 2021 | 2022 | 2023 | 2024 | 2025 | |
|---|---|---|---|---|---|
| Revenue | 19.1B | 18.9B | 19.4B | 20.2B | 21.8B |
| Cost of Revenue | 10.5B | 10.4B | 11.2B | 11.1B | 11.9B |
| Operating Expenses | 6.4B | 6.2B | 6.1B | 6.7B | 7.3B |
| Gross Profit | 8.6B | 8.5B | 8.2B | 9.1B | 9.9B |
| EBITDA | 4.4B | 4.4B | 4.4B | 4.8B | 5.0B |
| EBIT | 2.2B | 2.2B | 2.1B | 2.5B | 2.5B |
| Interest Expense | 469M | 398M | 452M | 528M | 613M |
| Net Income | 2.1B | 1.8B | 1.5B | 1.7B | 1.7B |
| EPS | 6.92 | 5.93 | 4.97 | 5.88 | 5.84 |
| Filing Date | 2021-11-24 | 2022-11-22 | 2023-11-21 | 2024-11-27 | 2025-09-18 |
Income Statement Evolution
Between 2021 and 2025, Becton, Dickinson and Company (BDX) experienced a favorable revenue growth of 14.16%, reaching $21.8B in 2025. However, net income declined by 19.79% over the same period, with net margins decreasing by 29.74%. Gross margin remained favorable at 45.44%, yet EBIT and net margin showed slight deterioration, reflecting mixed margin stability amid rising operating expenses.
Is the Income Statement Favorable?
In 2025, revenue grew 8.23% year-over-year to $21.8B, supported by an 8.76% increase in gross profit, indicating strong top-line performance. Yet, EBIT decreased by 1.5%, and net margin contracted by 9.07%, signaling margin pressure. Operating expenses grew in line with revenue, an unfavorable trend for profitability. Overall, BDX’s income statement fundamentals for 2025 appear neutral, balancing solid revenue gains against declining profitability metrics.
Financial Ratios
The following table presents key financial ratios for Becton, Dickinson and Company (BDX) over recent fiscal years to facilitate comparative analysis:
| Ratios | 2021 | 2022 | 2023 | 2024 | 2025 |
|---|---|---|---|---|---|
| Net Margin | 11% | 9% | 8% | 8% | 8% |
| ROE | 9% | 7% | 6% | 7% | 7% |
| ROIC | 4% | 4% | 4% | 4% | 5% |
| P/E | 33.1 | 35.7 | 49.9 | 41.0 | 32.0 |
| P/B | 2.93 | 2.51 | 2.87 | 2.70 | 2.11 |
| Current Ratio | 1.33 | 1.04 | 1.31 | 1.17 | 1.11 |
| Quick Ratio | 0.92 | 0.63 | 0.81 | 0.74 | 0.64 |
| D/E | 0.74 | 0.64 | 0.62 | 0.78 | 0.76 |
| Debt-to-Assets | 33% | 30% | 30% | 35% | 35% |
| Interest Coverage | 4.80 | 5.73 | 4.67 | 4.54 | 4.21 |
| Asset Turnover | 0.36 | 0.36 | 0.37 | 0.35 | 0.39 |
| Fixed Asset Turnover | 3.19 | 3.14 | 2.95 | 2.96 | 3.12 |
| Dividend Yield | 1.5% | 1.7% | 1.5% | 1.6% | 2.2% |
*Net Margin, ROE, and ROIC are expressed as percentages; D/E is debt-to-equity ratio; Debt-to-Assets is expressed as a percentage.*
Evolution of Financial Ratios
From 2021 to 2025, Becton, Dickinson and Company’s Return on Equity (ROE) showed a declining trend, falling from 8.84% to 6.61%, indicating reduced profitability. The Current Ratio gradually decreased from 1.33 to 1.11, suggesting a slight reduction in short-term liquidity. The Debt-to-Equity Ratio experienced minor fluctuations, holding near 0.75 in 2025, reflecting relative stability in leverage levels over the period.
Are the Financial Ratios Fovorable?
In 2025, profitability ratios such as net margin (7.68%) were neutral, while ROE (6.61%) and ROIC (4.73%) were unfavorable compared to expected benchmarks. Liquidity indicators showed a neutral current ratio (1.11) but an unfavorable quick ratio (0.64). Leverage ratios, including debt-to-equity (0.76) and debt-to-assets (34.67%), appeared neutral, with interest coverage at 4.07 also neutral. Efficiency was mixed, with asset turnover unfavorable at 0.39 but fixed asset turnover favorable at 3.12. Dividend yield was favorable at 2.23%. Overall, the global ratios evaluation suggested a slightly unfavorable financial condition.
Shareholder Return Policy
Becton, Dickinson and Company maintains a dividend payout ratio around 65-75%, with a 2025 dividend per share of 4.17 USD and a yield near 2.23%. The dividends are well covered by free cash flow, and the company also executes share buybacks, supporting capital returns.
This balanced approach, combining dividends and buybacks, appears sustainable given consistent profitability and cash flow coverage. The policy aligns with prudent risk management, aiming to support long-term shareholder value without overextending distributions or repurchases.
Score analysis
The following radar chart illustrates Becton, Dickinson and Company’s key financial scores, providing a comprehensive view of its valuation and performance metrics:
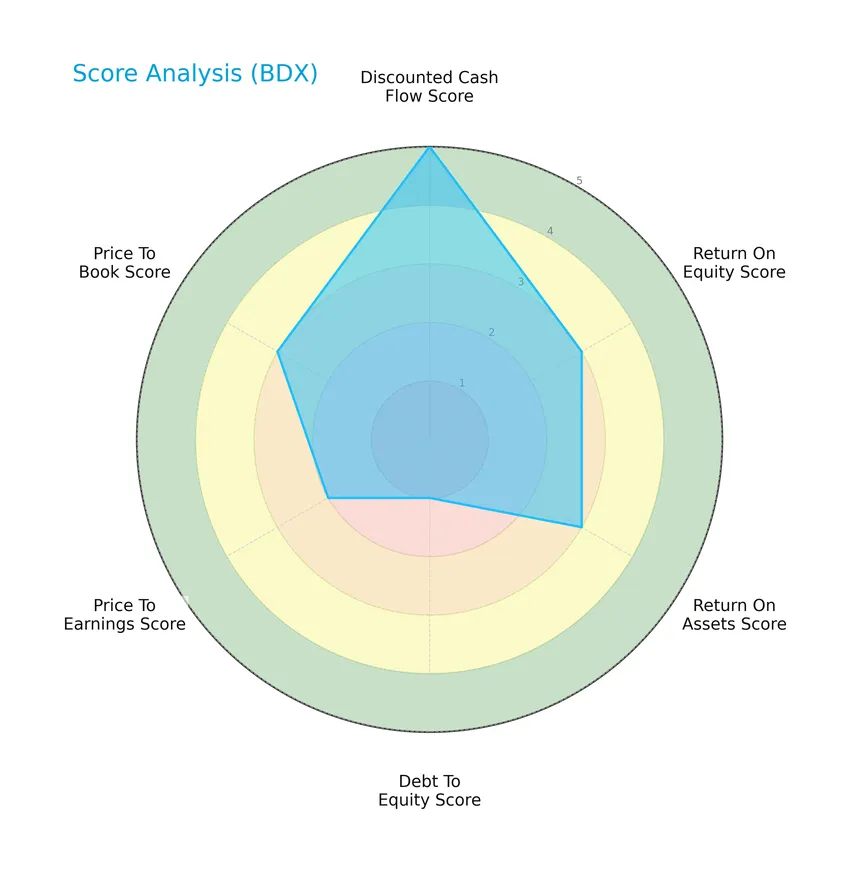
The company scores very favorably in discounted cash flow valuation with a 5, while return on equity and assets both hold moderate scores of 3. However, the debt-to-equity ratio is notably weak at 1, indicating higher leverage risk. Price-to-earnings and price-to-book ratios show moderate valuations at 2 and 3 respectively.
Analysis of the company’s bankruptcy risk
Becton, Dickinson and Company’s Altman Z-Score places it in the grey zone, suggesting a moderate risk of bankruptcy and financial distress:

Is the company in good financial health?
The Piotroski Score diagram below highlights the company’s financial strength based on nine fundamental criteria:

With a Piotroski Score of 8, Becton, Dickinson and Company demonstrates very strong financial health, indicating solid profitability, liquidity, and operational efficiency.
Competitive Landscape & Sector Positioning
This sector analysis will explore Becton, Dickinson and Company’s strategic positioning, revenue by segment, key products, main competitors, and competitive advantages. I will assess whether the company holds a competitive edge within the medical instruments and supplies industry.
Strategic Positioning
Becton, Dickinson and Company maintains a diversified product portfolio across three segments—Medical ($10.07B), Life Sciences ($5.19B), and Interventional ($4.98B) in FY 2024. Geographically, revenues are concentrated primarily in the United States ($11.66B), with significant exposure to Europe ($4.40B) and Asia ($2.91B).
Revenue by Segment
This pie chart illustrates Becton, Dickinson and Company’s revenue distribution by product segment for the fiscal year 2024, highlighting key business drivers and segment contributions.
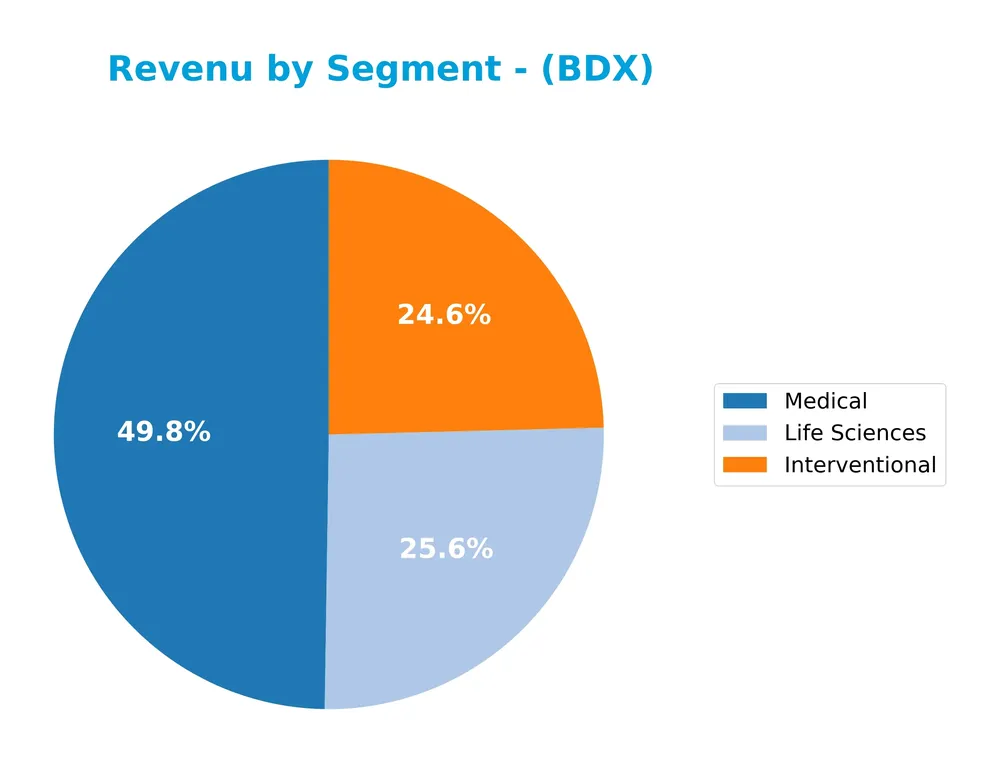
In 2024, the Medical segment remained the largest revenue contributor at 10.1B, followed closely by Life Sciences at 5.2B and Interventional at 5.0B. The Medical segment shows steady growth, indicating its critical role in the company’s portfolio. Life Sciences revenue held relatively stable, while Interventional experienced a notable increase, reflecting a positive shift. Overall, the revenue mix suggests a balanced business with moderate concentration risk in Medical.
Key Products & Brands
The following table outlines Becton, Dickinson and Company’s main products and brands across its business segments:
| Product | Description |
|---|---|
| BD Medical | Peripheral IV and advanced peripheral catheters, central lines, acute dialysis catheters, vascular care products, syringes, and drug delivery systems. |
| BD Life Sciences | Specimen and blood collection products, automated culturing and molecular testing systems, rapid diagnostic assays, and clinical diagnostic reagents. |
| BD Interventional | Hernia and soft tissue repair products, biosurgery, surgical instruments, peripheral intervention products, and urology and critical care devices. |
Becton, Dickinson and Company operates through three main segments: Medical, Life Sciences, and Interventional. These segments supply a wide range of medical devices, laboratory equipment, diagnostics, and surgical products globally.
Main Competitors
There are 8 competitors in total, with the table below listing the top 8 leaders by market capitalization:
| Competitor | Market Cap. |
|---|---|
| Intuitive Surgical, Inc. | 201B |
| Becton, Dickinson and Company | 56B |
| ResMed Inc. | 36B |
| West Pharmaceutical Services, Inc. | 20B |
| Hologic, Inc. | 16.6B |
| The Cooper Companies, Inc. | 16.1B |
| Baxter International Inc. | 10B |
| AptarGroup, Inc. | 8.1B |
Becton, Dickinson and Company ranks 2nd among its competitors, with a market cap approximately 29% of the top player, Intuitive Surgical, Inc. The company stands above both the average market cap of the top 10 competitors (45.4B) and the sector median (18.3B). It has a significant gap of +248.57% to its closest competitor above, highlighting a strong but distinctly smaller scale relative to the leader.
Comparisons with competitors
Check out how we compare the company to its competitors:
Does BDX have a competitive advantage?
Becton, Dickinson and Company (BDX) currently does not present a strong competitive advantage, as its return on invested capital (ROIC) is only slightly above its weighted average cost of capital (WACC), indicating limited value creation. However, the company shows a growing ROIC trend, which suggests improving profitability despite recent challenges in net margin and earnings per share growth.
Looking ahead, BDX’s broad portfolio across medical supplies, diagnostics, and surgical products positions it to capitalize on evolving healthcare needs and expanding markets globally. Continued innovation in drug delivery systems and laboratory automation offers potential opportunities to enhance its market presence and financial performance.
SWOT Analysis
This SWOT analysis highlights the primary internal and external factors influencing Becton, Dickinson and Company’s (BDX) current market position and strategic outlook.
Strengths
- strong global brand in medical instruments
- diversified product portfolio across medical, life sciences, and interventional segments
- stable dividend yield of 2.23%
Weaknesses
- declining net margin and EPS growth over recent years
- moderate financial leverage with unfavorable debt-to-equity score
- lower ROE and ROIC compared to industry benchmarks
Opportunities
- expanding healthcare demand in emerging markets like Asia
- innovation in drug delivery and diagnostics technology
- potential to improve operational efficiency and margin expansion
Threats
- intense competition in healthcare technology
- regulatory and reimbursement challenges
- currency fluctuations impacting international revenue
Overall, BDX shows solid strengths with a broad product line and global reach but faces margin pressures and profitability challenges. Strategic focus should be on innovation and operational improvements while managing financial leverage and external risks prudently.
Stock Price Action Analysis
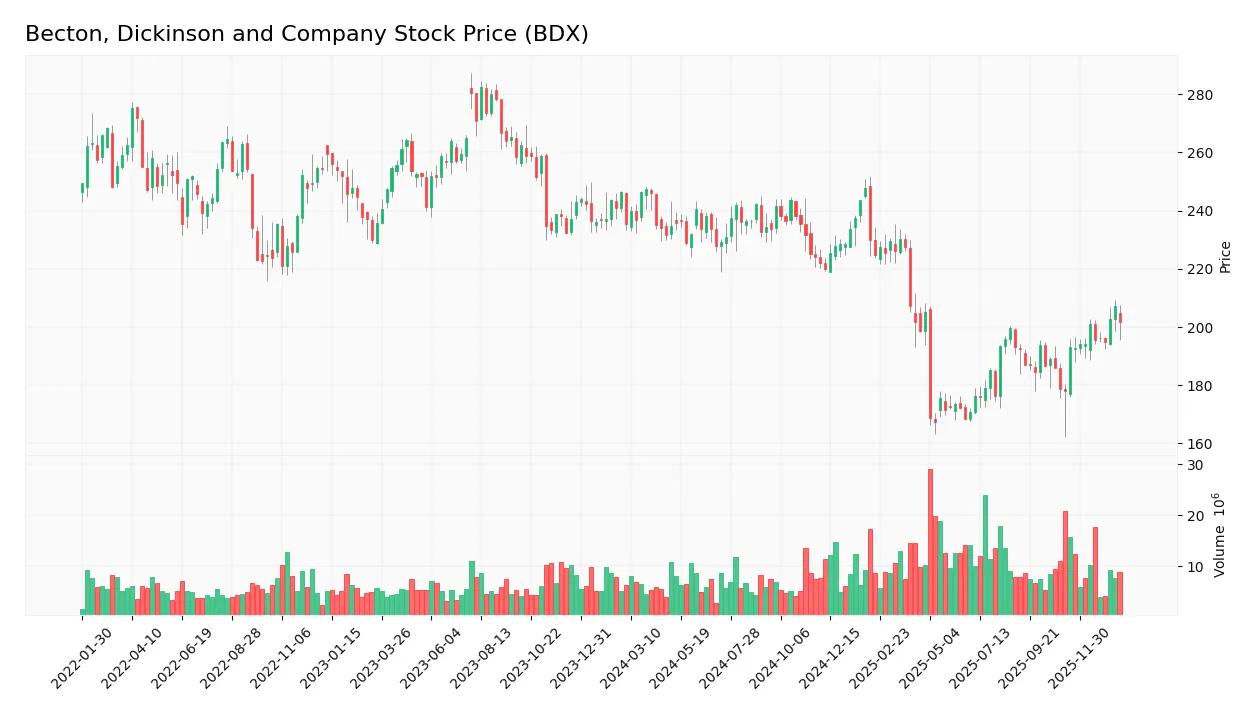
The weekly stock price chart for Becton, Dickinson and Company (BDX) over the last 12 months illustrates significant movements and volatility:
Trend Analysis
Over the past 12 months, BDX’s stock price declined by 14.25%, indicating a bearish trend with accelerating downward momentum. Price volatility is high, with a standard deviation of 24.7. The stock’s highest and lowest prices were 247.6 and 167.22 respectively, reflecting notable fluctuations.
Volume Analysis
Trading volumes over the past three months show an increasing trend with total volume surpassing 1B shares. Seller volume slightly exceeds buyer volume, with buyer dominance at 42.41%, suggesting a slightly seller-driven market and cautious investor sentiment.
Target Prices
The consensus target prices for Becton, Dickinson and Company (BDX) indicate a stable outlook from analysts.
| Target High | Target Low | Consensus |
|---|---|---|
| 215 | 210 | 211.67 |
Analysts expect the stock price to remain in a narrow range around $210-$215, reflecting moderate confidence in its near-term performance.

Don’t Let Luck Decide Your Entry Point
Optimize your entry points with our advanced ProRealTime indicators. You’ll get efficient buy signals with precise price targets for maximum performance. Start outperforming now!
Analyst & Consumer Opinions
This section examines the latest analyst ratings and consumer feedback related to Becton, Dickinson and Company (BDX).
Stock Grades
The following table presents the most recent analyst grades for Becton, Dickinson and Company, reflecting current market sentiment and recommendations:
| Grading Company | Action | New Grade | Date |
|---|---|---|---|
| Stifel | Maintain | Buy | 2026-01-07 |
| B of A Securities | Maintain | Neutral | 2026-01-05 |
| RBC Capital | Maintain | Sector Perform | 2025-12-17 |
| Morgan Stanley | Maintain | Overweight | 2025-12-02 |
| Piper Sandler | Maintain | Neutral | 2025-11-07 |
| RBC Capital | Maintain | Sector Perform | 2025-11-07 |
| RBC Capital | Maintain | Sector Perform | 2025-10-16 |
| Morgan Stanley | Maintain | Overweight | 2025-08-11 |
| Wells Fargo | Maintain | Equal Weight | 2025-08-08 |
| Piper Sandler | Maintain | Neutral | 2025-08-08 |
The overall trend in grades for Becton, Dickinson and Company is stable, with most analysts maintaining their previous ratings. The consensus leans toward a Hold position, reflecting balanced views on the stock’s near-term prospects.
Consumer Opinions
Consumer sentiment around Becton, Dickinson and Company (BDX) reflects a mix of appreciation for product quality and concerns about customer service.
| Positive Reviews | Negative Reviews |
|---|---|
| Reliable and innovative medical devices. | Occasional delays in customer support. |
| High-quality products enhance patient care. | Pricing can be high for smaller clinics. |
| Strong commitment to safety and compliance. | Some users report complexity in device setup. |
Overall, consumers praise BDX for its dependable and advanced medical solutions, though some highlight issues with support responsiveness and product usability. This suggests solid product strength paired with areas for customer experience improvement.
Risk Analysis
The following table summarizes key risks associated with Becton, Dickinson and Company, highlighting their probability and potential impact:
| Category | Description | Probability | Impact |
|---|---|---|---|
| Financial Performance | Moderate net margin (7.68%) and low ROE (6.61%) indicate pressure on profitability and returns. | Medium | Medium |
| Leverage & Liquidity | Debt to equity is moderate (0.76) but debt coverage and quick ratio (0.64) are somewhat weak. | Medium | Medium |
| Market Valuation | Elevated P/E ratio (~32) suggests overvaluation risk amid market volatility. | Medium | Medium |
| Bankruptcy Risk | Altman Z-Score in grey zone (2.17) signals moderate risk of financial distress. | Medium | High |
| Operational Efficiency | Low asset turnover (0.39) reflects challenges in asset utilization and operational efficiency. | Medium | Medium |
| Industry & Regulatory | Healthcare sector regulatory changes can impact product approvals and market access. | Medium | High |
The most notable risks are the moderate bankruptcy risk indicated by the Altman Z-Score and regulatory uncertainties in the healthcare sector. Despite a strong Piotroski Score (8), signaling solid financial health, investors should monitor profitability pressures and valuation carefully in 2026.
Should You Buy Becton, Dickinson and Company?
Becton, Dickinson and Company appears to be a profile of improving profitability with a slightly favorable competitive moat, suggesting growing operational efficiency. Despite a substantial leverage profile, the overall rating of B reflects a very favorable long-term value creation potential.
Strength & Efficiency Pillars
Becton, Dickinson and Company (BDX) presents a mixed but cautiously positive financial profile. The company maintains a solid gross margin of 45.44% and an EBIT margin of 11.42%, reflecting operational efficiency. Its net margin remains stable at 7.68%. Despite a moderate return on equity (ROE) of 6.61% and return on invested capital (ROIC) of 4.73%, both fall slightly below ideal thresholds. The Altman Z-Score of 2.17 places BDX in the grey zone, indicating moderate financial stability, while a strong Piotroski Score of 8 underscores robust financial health. Notably, the ROIC (4.73%) is marginally below the WACC (4.7%), suggesting the company is roughly breaking even on value creation.
Weaknesses and Drawbacks
Several risk factors merit close attention. The price-to-earnings ratio (31.97) signals a high valuation that may not be fully justified by earnings growth, potentially exposing investors to premium risk. Leverage metrics are concerning: the quick ratio stands at an unfavorable 0.64, hinting at liquidity constraints despite a neutral debt-to-equity ratio of 0.76. Market pressure is evident with a bearish overall stock trend and recent seller dominance at 57.59%, which could suppress near-term price appreciation. Additionally, declining net income and EPS growth rates over the last year and long-term periods raise caution on profitability sustainability.
Our Verdict about Becton, Dickinson and Company
BDX exhibits a fundamentally moderate to slightly unfavorable profile due to valuation premiums and mixed profitability signals. Given the bearish overall technical trend combined with recent seller dominance, despite some signs of operational resilience, the stock may appear better suited for investors willing to adopt a wait-and-see stance. The company’s financial strength suggests it could withstand pressure, but market conditions imply that timing entry points carefully might be prudent.
Disclaimer: This content is for informational purposes only and does not constitute financial, investment, or other professional advice. Investing in financial markets involves a significant risk of loss, and past performance is not indicative of future results.
Additional Resources
- Strs Ohio Increases Position in Becton, Dickinson and Company $BDX – MarketBeat (Jan 23, 2026)
- BD and Ypsomed Expand Partnership to Address Rapidly Growing Biologics Market – BD Newsroom (Jan 21, 2026)
- BD Helps Scientists Advance Immunology and Cancer Research with AI-Powered Insights and Automation – PR Newswire (Jan 23, 2026)
- Analysts’ Top Healthcare Picks: Becton Dickinson (BDX), Regeneron (REGN) – The Globe and Mail (Jan 23, 2026)
- Becton Dickinson FDA Win Adds Breast Biopsy Growth And Valuation Interest – simplywall.st (Jan 21, 2026)
For more information about Becton, Dickinson and Company, please visit the official website: bd.com