Home > Analyses > Healthcare > Baxter International Inc.
Baxter International revolutionizes patient care with advanced medical devices and therapies that touch millions daily. Its leadership spans dialysis solutions, intravenous therapies, and critical care products, all hallmarks of its innovation and quality. The company’s integrated care technologies redefine hospital and home healthcare. As Baxter navigates evolving healthcare demands and pricing pressures, I question whether its fundamentals still justify its current valuation and future growth prospects.

Table of contents
Business Model & Company Overview
Baxter International Inc., founded in 1931 and headquartered in Deerfield, Illinois, stands as a leader in the medical instruments and supplies sector. Its expansive healthcare portfolio integrates dialysis therapies, intravenous solutions, critical care products, and surgical devices, forming a comprehensive ecosystem that supports patient care across multiple settings. The company’s 38K employees drive innovation in connected care and advanced diagnostics, reinforcing its dominant industry position.
Baxter’s revenue engine balances robust sales of durable medical equipment with recurring consumables and infusion therapies. It operates globally, with significant market penetration in the Americas, Europe, and Asia, leveraging direct sales and distribution networks across 100 countries. The company’s economic moat lies in its integrated product suite and strategic partnerships, securing long-term value and influence in critical care advancements.
Financial Performance & Fundamental Metrics
I analyze Baxter International Inc.’s income statement, key financial ratios, and dividend payout policy to assess its core financial health and shareholder value.
Income Statement
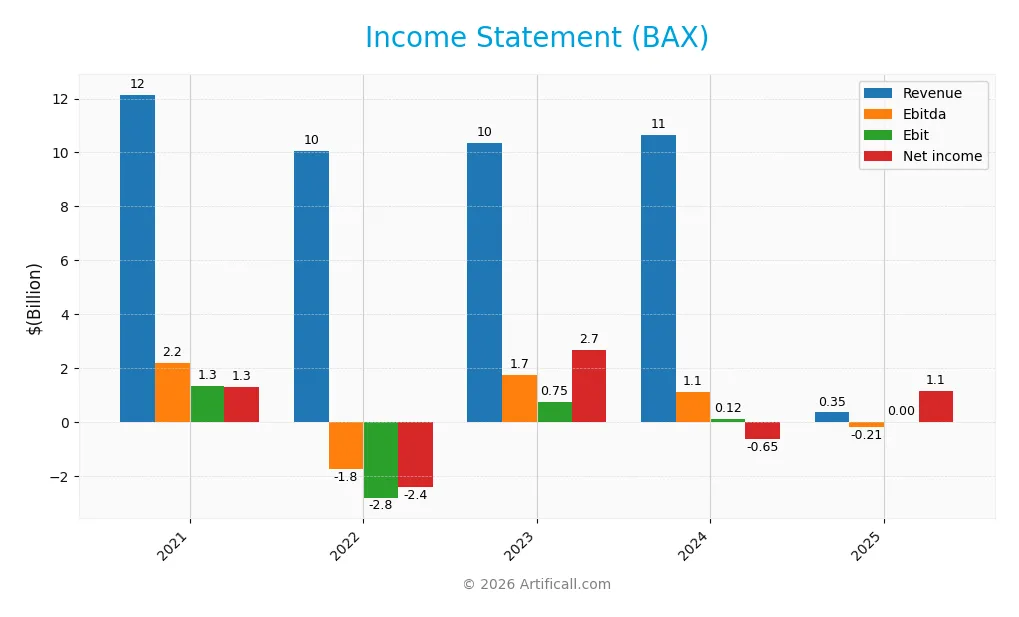
The table below summarizes Baxter International Inc.’s key income statement figures for fiscal years 2021 through 2025, reflecting significant volatility in profitability and earnings per share.
| 2021 | 2022 | 2023 | 2024 | 2025 | |
|---|---|---|---|---|---|
| Revenue | 12.15B | 10.06B | 10.36B | 10.64B | 352M |
| Cost of Revenue | 7.43B | 6.51B | 6.21B | 6.65B | 7.87B |
| Operating Expenses | 3.37B | 6.39B | 3.44B | 3.97B | 132M |
| Gross Profit | 4.72B | 3.55B | 4.15B | 3.98B | 3.38B |
| EBITDA | 2.19B | -1.76B | 1.73B | 1.12B | -206M |
| EBIT | 1.32B | -2.84B | 750M | 119M | 0 |
| Interest Expense | 207M | 413M | 508M | 408M | 238M |
| Net Income | 1.28B | -2.43B | 2.66B | -649M | 1.14B |
| EPS | 2.56 | -4.83 | 5.25 | -1.27 | -1.87 |
| Filing Date | 2022-02-23 | 2023-02-09 | 2024-02-08 | 2025-02-21 | 2026-02-12 |
Income Statement Evolution
From 2021 to 2025, Baxter International’s revenue plunged sharply, dropping 97.1%. Gross profit also declined, falling 15.2% in the last year alone. Margins showed mixed signals: gross margin remained favorable at 960%, while EBIT margin collapsed to zero. Net margin, however, improved significantly, reflecting a 3,253% growth over the period despite overall revenue weakness.
Is the Income Statement Favorable?
The 2025 income statement reveals a complex picture. Revenue collapsed 96.7% year-over-year, with gross profit down 15.2%. Operating income turned slightly negative, and interest expenses absorbed a high 67.6% of income. Despite these pressures, net income returned positive, driving a strong net margin of 323%. The fundamentals remain largely unfavorable, with only net margin showing strength amid substantial operational challenges.
Financial Ratios
The following table presents key financial ratios for Baxter International Inc. over the last five fiscal years, providing a snapshot of profitability, liquidity, leverage, and valuation metrics:
| Ratios | 2021 | 2022 | 2023 | 2024 | 2025 |
|---|---|---|---|---|---|
| Net Margin (%) | 10.57 | -24.19 | 25.64 | -6.10 | 3.23 |
| ROE (%) | 14.15 | -41.71 | 31.61 | -9.32 | 18.53 |
| ROIC (%) | 4.18 | -10.88 | 2.16 | 0.06 | -0.04 |
| P/E | 33.56 | -10.56 | 7.37 | -22.91 | 8.63 |
| P/B | 4.75 | 4.40 | 2.33 | 2.14 | 1.60 |
| Current Ratio | 2.09 | 1.69 | 1.48 | 1.36 | 2.31 |
| Quick Ratio | 1.52 | 1.12 | 1.18 | 1.05 | 1.56 |
| D/E | 2.02 | 2.95 | 1.68 | 1.93 | 1.58 |
| Debt-to-Assets | 0.55 | 0.61 | 0.50 | 0.52 | 0.48 |
| Interest Coverage | 6.52 | -6.89 | 1.39 | 0.03 | -0.03 |
| Asset Turnover | 0.36 | 0.36 | 0.37 | 0.41 | 0.02 |
| Fixed Asset Turnover | 2.09 | 1.92 | 3.23 | 3.35 | 0.11 |
| Dividend Yield (%) | 1.23 | 2.23 | 3.00 | 3.97 | 3.55 |
Evolution of Financial Ratios
Baxter International’s Return on Equity (ROE) showed volatility, peaking at 31.6% in 2023, then dropping to 18.5% in 2025. The current ratio improved from 1.36 in 2024 to 2.31 in 2025, signaling stronger liquidity. Debt-to-equity ratio decreased from 1.93 in 2024 to 1.58 in 2025, indicating modest deleveraging. Profitability showed recovery but remained uneven.
Are the Financial Ratios Favorable?
In 2025, profitability is favorable with an 18.5% ROE and a strong 3.55% dividend yield. Liquidity ratios are robust, with a current ratio of 2.31 and quick ratio of 1.56. Leverage is unfavorable, indicated by a 1.58 debt-to-equity ratio and zero interest coverage. Asset turnover remains weak at 0.02, while price-to-book at 1.6 is neutral. Overall, ratios skew slightly favorable amid operational challenges.
Shareholder Return Policy
Baxter International Inc. consistently pays dividends, with a payout ratio of 31% in 2025 and a dividend yield near 3.5%. The dividend per share shows a steady trend around $0.68, supported by moderate coverage from free cash flow despite recent negative free cash flow per share.
The company also engages in share buybacks, balancing shareholder returns with reinvestment needs. Given the payout ratio and dividend stability, the policy appears designed to support sustainable long-term value creation, though free cash flow constraints warrant monitoring.
Score analysis
The following radar chart illustrates Baxter International Inc.’s key financial metric scores, highlighting strengths and weaknesses:
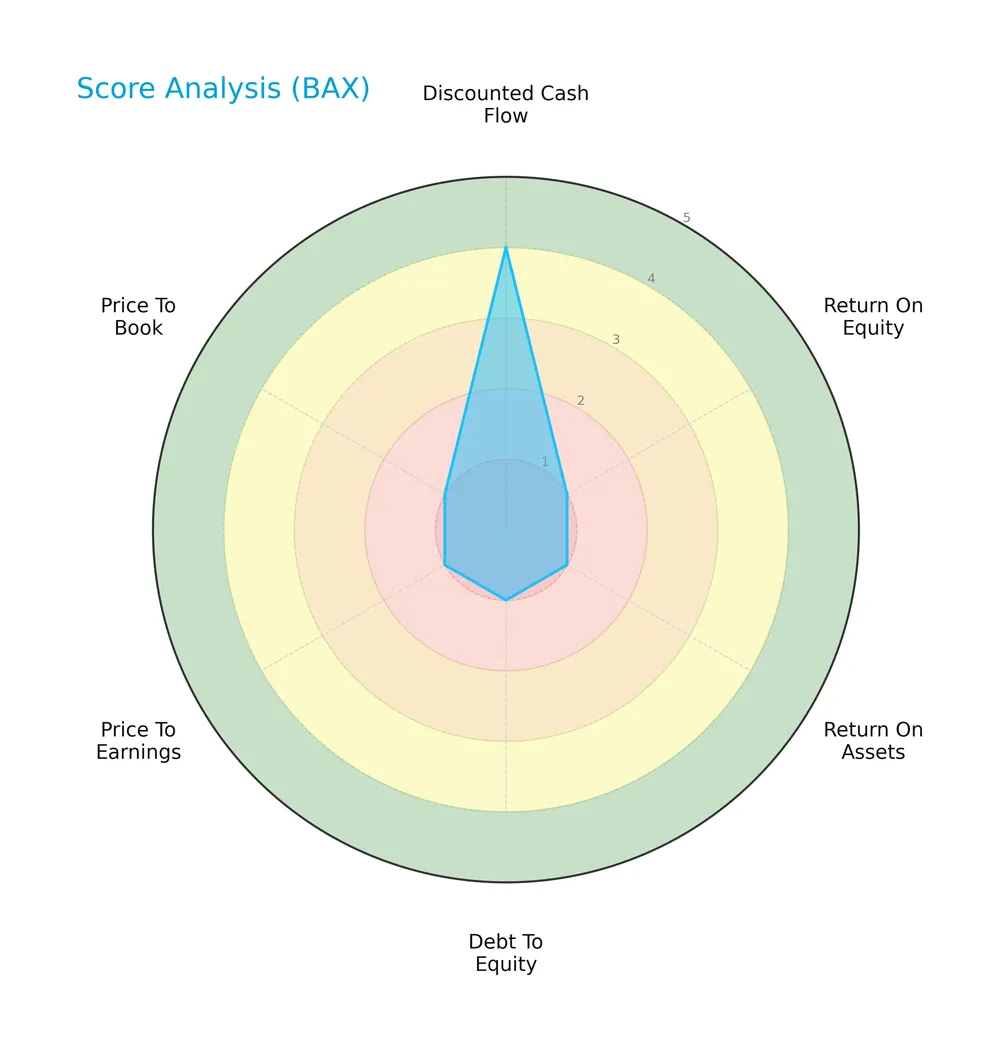
The discounted cash flow score registers as favorable at 4. However, returns on equity and assets, debt-to-equity, price-to-earnings, and price-to-book scores all sit at 1, reflecting very unfavorable conditions. This signals significant performance and valuation challenges.
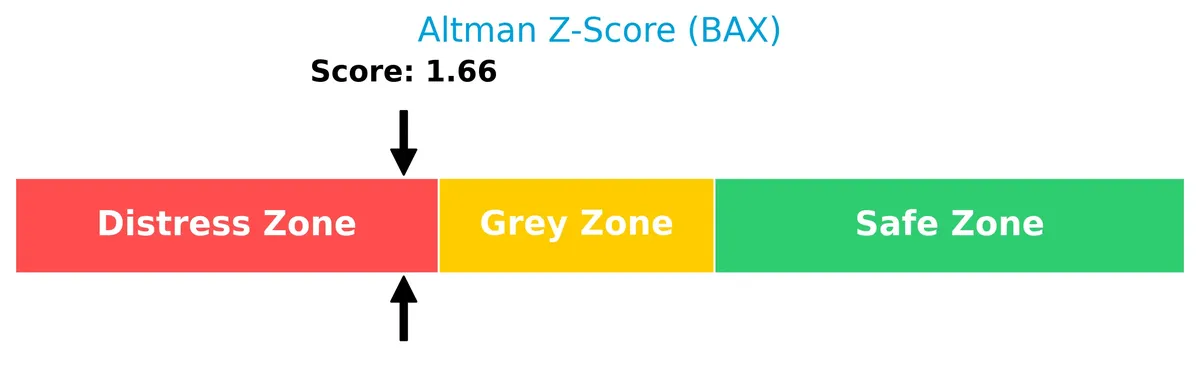
Analysis of the company’s bankruptcy risk
Baxter International’s Altman Z-Score of 1.66 places it in the distress zone, indicating a high probability of financial distress and potential bankruptcy risk:
Is the company in good financial health?
The Piotroski diagram below presents Baxter International’s financial health score based on nine fundamental criteria:
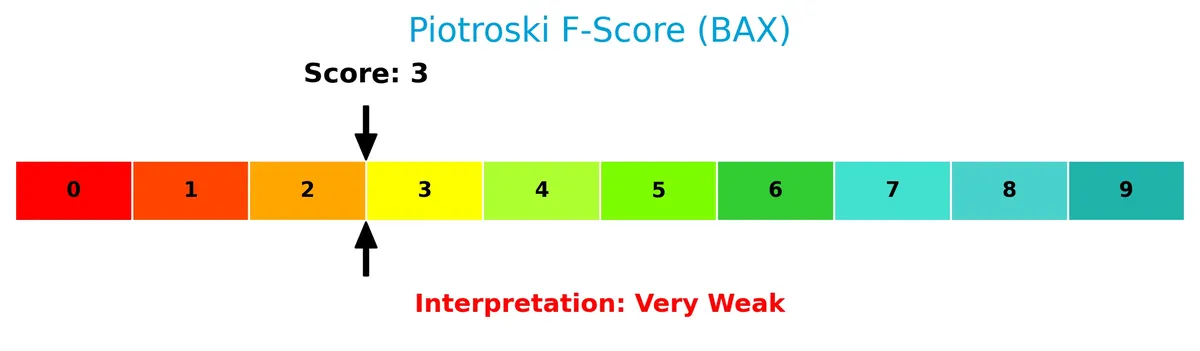
With a Piotroski score of 3, the company falls into the very weak category. This suggests poor financial strength and limited quality in profitability, leverage, liquidity, and operational efficiency.
Competitive Landscape & Sector Positioning
This sector analysis explores Baxter International Inc.’s strategic positioning, revenue breakdown, and key products. I will assess whether Baxter holds a competitive advantage over its main rivals.
Strategic Positioning
Baxter International operates a diversified product portfolio spanning dialysis, intravenous therapies, pharmaceuticals, and surgical solutions. Its geographic exposure covers approximately 100 countries, with significant revenue from the US (5.85B in 2024) and Western Europe, Canada, Japan, Australia, and New Zealand (3.44B).
Revenue by Segment
The pie chart illustrates Baxter International Inc.’s revenue distribution by segment for fiscal year 2024, highlighting how each business area contributes to overall sales.
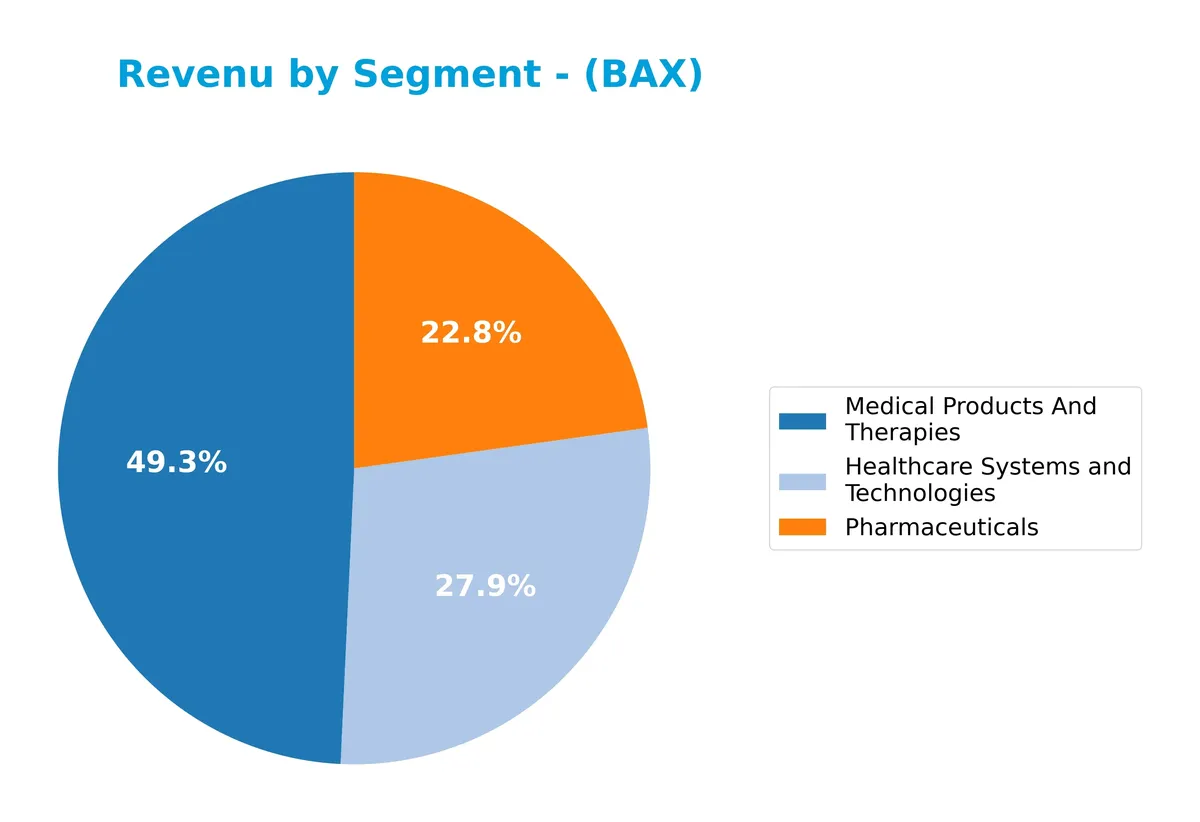
In 2024, Medical Products And Therapies leads with $5.2B, driving growth and underscoring its core role. Healthcare Systems and Technologies follows at $3B, showing slight contraction from 2023. Pharmaceuticals steadily contribute $2.4B, reflecting stable demand. The shift from Kidney Care in 2023 to the current segment mix points to strategic realignment and concentration risk in fewer, larger segments.
Key Products & Brands
The following table summarizes Baxter International’s primary products and brands by description:
| Product | Description |
|---|---|
| Healthcare Systems and Technologies | Integrated patient monitoring, diagnostic devices, surgical video technologies, and ICU organ support therapies. |
| Medical Products and Therapies | Dialysis therapies, infusion pumps, drug reconstitution devices, critical care, and oncology drug platforms. |
| Pharmaceuticals | Contracted generic injectable premix, oncology molecules, and related pharmaceutical services. |
| Kidney Care / Renal | Peritoneal and hemodialysis products and continuous renal replacement therapies for kidney care. |
| Acute Therapies | Critical care products targeting acute patient conditions in hospital settings. |
| Advanced Surgery | Biological products and medical devices used for hemostasis, tissue sealing, and surgical procedures. |
| Clinical Nutrition | Parenteral nutrition therapies and related nutritional products. |
| Medication Delivery | Infusion pumps, administration sets, and delivery devices for intravenous therapies. |
| Patient Support Systems | Devices and solutions supporting patient care and monitoring. |
| Surgical Solutions | Surgical tables, lights, pendants, and precision positioning accessories used in operating rooms. |
Baxter International maintains a diversified healthcare portfolio spanning critical care, renal therapies, pharmaceuticals, and surgical technologies. Its products serve hospitals, outpatient centers, and home care under physician supervision, reflecting a broad and integrated approach to patient care.
Main Competitors
There are 8 competitors in total, with the table listing the top 8 leaders by market capitalization:
| Competitor | Market Cap. |
|---|---|
| Intuitive Surgical, Inc. | 201B |
| Becton, Dickinson and Company | 56B |
| ResMed Inc. | 36B |
| West Pharmaceutical Services, Inc. | 20B |
| Hologic, Inc. | 16.6B |
| The Cooper Companies, Inc. | 16.1B |
| Baxter International Inc. | 10B |
| AptarGroup, Inc. | 8.1B |
Baxter International Inc. ranks 7th among its 8 competitors. It holds only 4.79% of the market cap of the sector leader, Intuitive Surgical. Baxter trades below both the average market cap of the top 10 competitors (45.4B) and the sector median (18.3B). Its market cap is 67.9% smaller than its closest rival above, The Cooper Companies.
Comparisons with competitors
Check out how we compare the company to its competitors:
Does BAX have a competitive advantage?
Baxter International Inc. currently shows no competitive advantage, as its ROIC lags behind WACC and profitability declines. The company is shedding value, reflecting decreasing operational efficiency and capital returns.
Looking ahead, Baxter’s diverse healthcare portfolio and collaboration on acute care drugs offer growth potential. Expansion into new therapies and connected care solutions could create future opportunities in global medical markets.
SWOT Analysis
This SWOT analysis highlights Baxter International’s key strategic factors influencing its market position and future outlook.
Strengths
- Diversified healthcare product portfolio
- Strong presence in US and global markets
- Stable dividend yield of 3.55%
Weaknesses
- Declining revenue and profitability trends
- Negative ROIC indicating value destruction
- High debt-to-equity ratio of 1.58
Opportunities
- Expansion in emerging markets
- Growth in connected care and digital health
- Potential new product developments with pharma partners
Threats
- Intense competition in medical instruments
- Regulatory risks in healthcare sector
- Economic downturn impacting healthcare spending
Baxter faces critical challenges with declining profitability and value destruction. Strategic focus must prioritize innovation and market expansion while managing financial risks prudently.
Stock Price Action Analysis
The following weekly stock chart illustrates Baxter International Inc.’s price movements over the past 12 months:
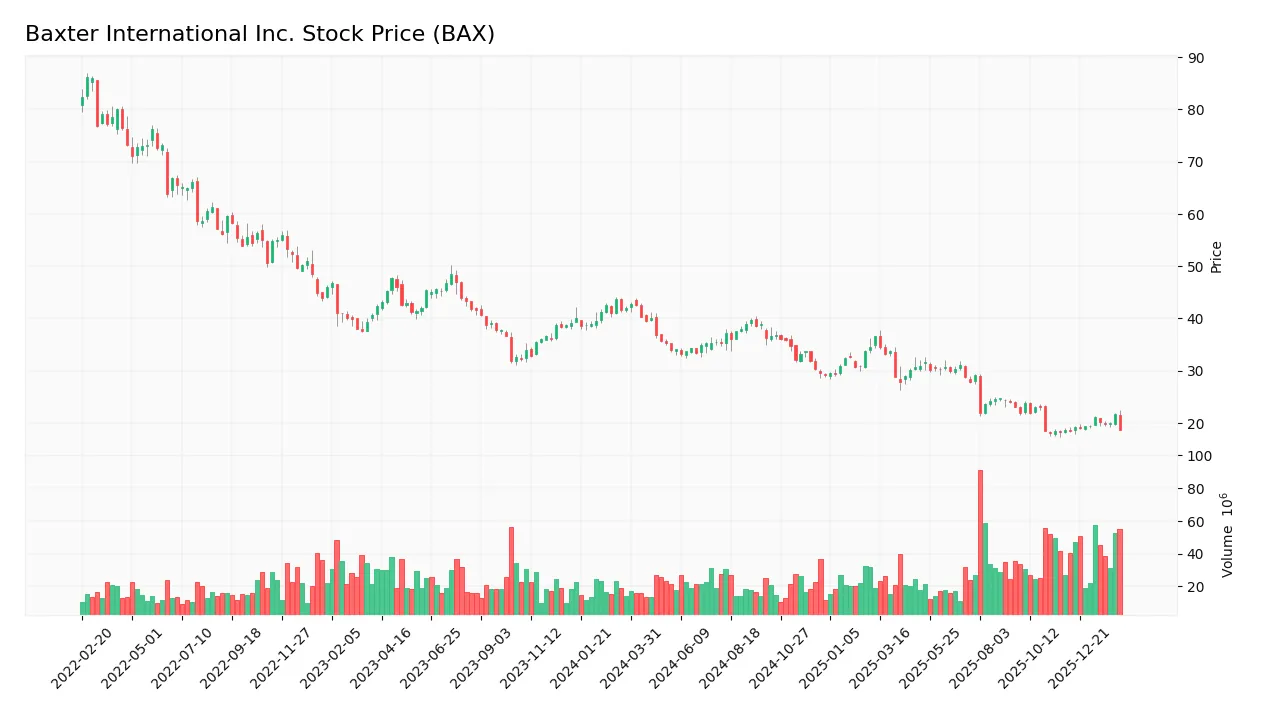
Trend Analysis
Over the past year, BAX’s stock price declined sharply by 55.39%, confirming a bearish trend. The decline accelerated, with volatility elevated at a 6.68% standard deviation. Prices peaked at 42.74 and bottomed at 18.0, signaling significant downside pressure. Recent months show a near-neutral trend with a slight upward slope of 0.15%.
Volume Analysis
Trading volume has increased recently, totaling 3.03B shares over 12 months. Buyer volume slightly exceeds seller volume at 50.84%, indicating balanced activity. In the last three months, buyer dominance rose to 52.71%, but buying behavior remains neutral, suggesting cautious investor engagement despite rising volume.
Target Prices
Analysts set a clear target consensus for Baxter International Inc., reflecting moderate upside potential.
| Target Low | Target High | Consensus |
|---|---|---|
| 15 | 30 | 21.67 |
The target range spans from 15 to 30, with a consensus of 21.67, indicating cautious optimism among analysts.

Don’t Let Luck Decide Your Entry Point
Optimize your entry points with our advanced ProRealTime indicators. You’ll get efficient buy signals with precise price targets for maximum performance. Start outperforming now!
Analyst & Consumer Opinions
This section reviews analyst ratings and consumer feedback on Baxter International Inc. to assess market sentiment.
Stock Grades
Here are the latest verified stock grades from respected financial institutions for Baxter International Inc.:
| Grading Company | Action | New Grade | Date |
|---|---|---|---|
| Barclays | Maintain | Overweight | 2026-01-09 |
| Morgan Stanley | Maintain | Underweight | 2025-12-02 |
| Argus Research | Downgrade | Hold | 2025-10-31 |
| UBS | Maintain | Neutral | 2025-10-31 |
| Goldman Sachs | Maintain | Neutral | 2025-10-31 |
| Citigroup | Maintain | Neutral | 2025-10-31 |
| Evercore ISI Group | Maintain | Outperform | 2025-10-07 |
| UBS | Maintain | Neutral | 2025-08-04 |
| Barclays | Maintain | Overweight | 2025-08-04 |
| Stifel | Downgrade | Hold | 2025-08-04 |
The overall grading trend shows a cautious stance with a tilt toward neutrality and hold ratings. Notable downgrades from buy to hold by Argus Research and Stifel suggest tempered enthusiasm among some analysts.
Consumer Opinions
Investor enthusiasm often reflects the broader consumer sentiment, and Baxter International Inc. garners a mix of praise and critique from its user base.
| Positive Reviews | Negative Reviews |
|---|---|
| Reliable product quality with consistent performance. | Customer service response times can be slow. |
| Innovative medical solutions addressing critical needs. | Pricing is sometimes higher than competitors. |
| Strong brand reputation in healthcare markets. | Occasional supply chain delays reported. |
Overall, consumers appreciate Baxter’s product reliability and innovation. However, recurring concerns include customer service responsiveness and pricing pressures, which could impact brand loyalty if unaddressed.
Risk Analysis
Below is a table summarizing key risks facing Baxter International Inc., including their likelihood and potential impact:
| Category | Description | Probability | Impact |
|---|---|---|---|
| Financial Stability | Altman Z-Score at 1.66 signals high bankruptcy risk; distress zone warning. | High | Severe |
| Profitability | Negative ROIC (-0.04%) despite favorable net margin; inefficient capital use. | Medium | Moderate |
| Leverage | Debt-to-equity ratio at 1.58 and zero interest coverage raise solvency concerns. | High | Severe |
| Market Volatility | Stock price dropped nearly 16% recently; beta at 0.585 indicates moderate risk. | Medium | Moderate |
| Operational Efficiency | Very low asset turnover (0.02) limits revenue generation from assets. | Medium | Moderate |
| Valuation | Low P/E of 8.63 is favorable, but poor price-to-book and other valuation scores. | Low | Low |
The most critical risks are Baxter’s financial distress indicators and heavy leverage combined with zero interest coverage. These factors suggest potential liquidity challenges despite solid profitability metrics. Recent sharp share price decline underlines market concerns. Prudence demands close monitoring of balance sheet health.
Should You Buy Baxter International Inc.?
Analytically, Baxter International Inc. appears to be shedding value with declining profitability and a very unfavorable moat. Despite a manageable liquidity profile, significant leverage and weak returns suggest operational challenges. The overall rating of C- reflects a distressed financial health profile.
Strength & Efficiency Pillars
Baxter International Inc. shows a solid net margin of 322.73% and a respectable return on equity at 18.53%, indicating operational profitability. The company maintains favorable liquidity with a current ratio of 2.31 and a quick ratio of 1.56, supporting short-term obligations. However, its return on invested capital (ROIC) stands at -0.04%, below the weighted average cost of capital (WACC) at 4.58%, signaling value destruction rather than creation. Operational margins remain a bright spot despite broader challenges.
Weaknesses and Drawbacks
Baxter International is in financial distress, with an Altman Z-Score of 1.66, below the safe threshold and signaling a high bankruptcy risk. The firm’s debt-to-equity ratio at 1.58 is unfavorable, increasing financial leverage risk. Interest coverage is zero, indicating difficulty servicing debt costs. Market sentiment is bearish, with a 55.39% price decline and accelerating negative momentum. Weak profitability metrics and a Piotroski score of 3 further underscore vulnerability.
Our Final Verdict about Baxter International Inc.
Despite strong net margins and liquidity, Baxter International’s solvency risk makes it a highly speculative investment. The distress-level Z-score overshadows operational strengths, suggesting caution. This profile may appear too risky for conservative capital, with financial stability concerns taking precedence over short-term profitability and technical signals.
Disclaimer: This content is for informational purposes only and does not constitute financial, investment, or other professional advice. Investing in financial markets involves a significant risk of loss, and past performance is not indicative of future results.
Additional Resources
- Baxter International: Debt, Margin Pressure, Dreadful FY26 Guidance (Downgrade) (NYSE:BAX) – Seeking Alpha (Feb 12, 2026)
- Baxter International Inc (BAX) Q4 2025 Earnings Call Highlights: Strong Sales Growth Amidst Margin Pressures – GuruFocus (Feb 12, 2026)
- Baxter International (BAX) Q4 Earnings Lag Estimates – Yahoo Finance (Feb 12, 2026)
- Baxter: Q4 Earnings Snapshot – kens5.com (Feb 12, 2026)
- BAXTER INTERNATIONAL ($BAX) Releases Q4 2025 Earnings – Quiver Quantitative (Feb 12, 2026)
For more information about Baxter International Inc., please visit the official website: baxter.com