Home > Analyses > Financial Services > Bank of America Corporation
Bank of America shapes how millions manage money daily, blending tradition with cutting-edge technology. It commands a leading position in diversified banking, offering everything from consumer loans to global wealth management. Known for innovation and a vast footprint with thousands of branches and digital users, it influences financial markets worldwide. As the banking landscape evolves, I question whether Bank of America’s fundamentals still justify its premium valuation and growth expectations.

Table of contents
Business Model & Company Overview
Bank of America Corporation, founded in 1784 and headquartered in Charlotte, NC, commands a dominant position in diversified banking. Its ecosystem spans consumer banking, wealth management, global banking, and markets, serving 67M clients through 4,200 retail centers and cutting-edge digital platforms. This integrated approach fuels seamless financial solutions across individual and institutional needs.
The company’s revenue engine balances traditional lending, investment management, and market-making services. It generates value from interest income, fees, and advisory services across the Americas, Europe, and Asia. Bank of America’s broad footprint and diversified offerings form a formidable economic moat, anchoring its leadership and shaping the financial services industry’s future.
Financial Performance & Fundamental Metrics
I will analyze Bank of America Corporation’s income statement, key financial ratios, and dividend payout policy to reveal its core financial health and operational efficiency.
Income Statement
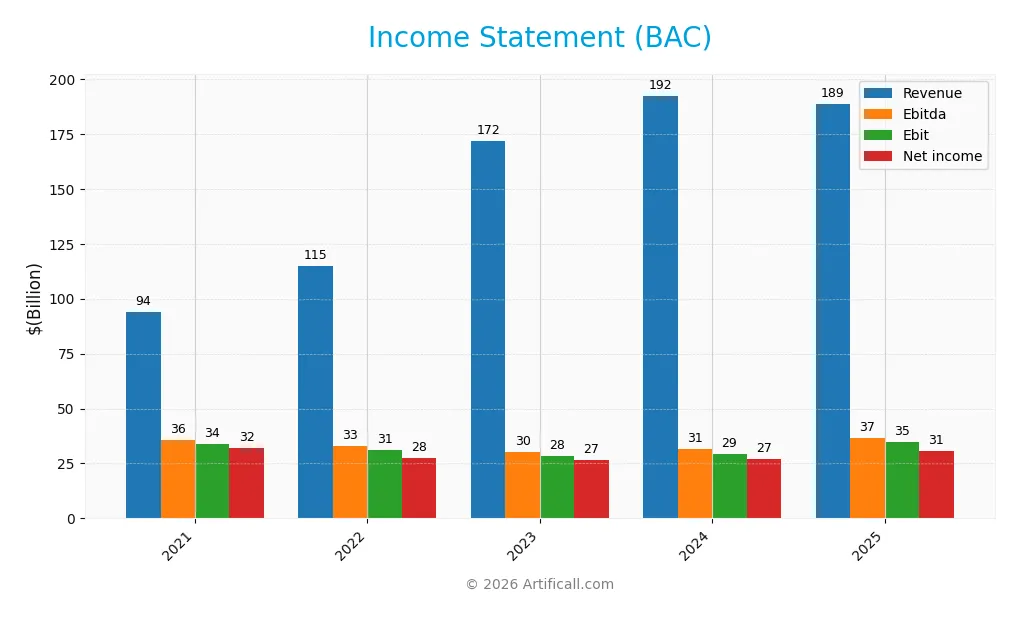
The table below presents Bank of America Corporation’s key income statement figures for fiscal years 2021 through 2025, highlighting revenue, expenses, profitability, and earnings per share trends.
| 2021 | 2022 | 2023 | 2024 | 2025 | |
|---|---|---|---|---|---|
| Revenue | 93.9B | 115.1B | 171.9B | 192.4B | 188.8B |
| Cost of Revenue | 144M | 22.6B | 77.7B | 96.4B | 84.1B |
| Operating Expenses | 59.7B | 61.4B | 65.8B | 66.8B | 69.7B |
| Gross Profit | 93.7B | 92.4B | 94.2B | 96.1B | 104.6B |
| EBITDA | 35.9B | 32.9B | 30.4B | 31.4B | 36.6B |
| EBIT | 34.0B | 31.0B | 28.3B | 29.3B | 34.9B |
| Interest Expense | 4.7B | 20.1B | 73.3B | 90.5B | 78.5B |
| Net Income | 31.9B | 27.5B | 26.5B | 27.1B | 30.6B |
| EPS | 3.60 | 3.21 | 3.10 | 3.25 | 3.88 |
| Filing Date | 2022-02-22 | 2023-02-22 | 2024-02-20 | 2025-02-25 | 2026-02-25 |
Income Statement Evolution
Bank of America’s revenue grew over 100% from 2021 to 2025 but declined 1.9% in the latest year. Gross profit improved by 8.9% year-over-year, reflecting better cost control despite the revenue dip. EBIT rose 19.2%, and net margin increased 15.1%, signaling margin expansion despite a mixed revenue trend.
Is the Income Statement Favorable?
In 2025, BAC posted $189B revenue and $29.2B net income, with a 16.2% net margin deemed favorable. EBIT margin stood at 18.5%, supporting strong operating efficiency. However, interest expenses consumed 41.6% of interest income, a notable drawback. Overall, the statement shows solid profitability but caution is warranted due to rising interest costs.
Financial Ratios
The table below summarizes key financial ratios for Bank of America Corporation from 2021 to 2025, providing insight into profitability, liquidity, leverage, and valuation metrics:
| Ratios | 2021 | 2022 | 2023 | 2024 | 2025 |
|---|---|---|---|---|---|
| Net Margin | 34.07% | 23.93% | 15.42% | 14.10% | 16.23% |
| ROE | 11.84% | 10.08% | 9.09% | 9.18% | 10.10% |
| ROIC | 3.97% | 3.36% | 2.28% | 2.25% | 3.41% |
| P/E | 11.82 | 9.76 | 10.20 | 12.54 | 13.23 |
| P/B | 1.40 | 0.98 | 0.93 | 1.15 | 1.34 |
| Current Ratio | 0.29 | 0.22 | 0.30 | 0.30 | 0.42 |
| Quick Ratio | 0.29 | 0.22 | 0.30 | 0.30 | 0.42 |
| D/E | 1.84 | 1.82 | 2.12 | 2.23 | 1.21 |
| Debt-to-Assets | 15.66% | 16.34% | 19.44% | 20.19% | 10.73% |
| Interest Coverage | 7.17 | 1.54 | 0.39 | 0.32 | 0.44 |
| Asset Turnover | 0.03 | 0.04 | 0.05 | 0.06 | 0.06 |
| Fixed Asset Turnover | 8.66 | 9.99 | 14.50 | 15.81 | 15.08 |
| Dividend Yield | 2.13% | 3.19% | 3.36% | 2.79% | 2.36% |
Evolution of Financial Ratios
From 2021 to 2025, Bank of America’s Return on Equity (ROE) declined from 11.84% to 10.10%, showing slight weakening in profitability. The Current Ratio improved marginally from 0.29 to 0.42, remaining below 1, indicating persistent liquidity constraints. Debt-to-Equity Ratio fluctuated, peaking near 2.23 in 2024 before settling at 1.21 in 2025, reflecting some deleveraging efforts.
Are the Financial Ratios Favorable?
In 2025, profitability ratios such as net margin (16.23%) and PE ratio (13.23) are favorable, signaling efficient earnings and reasonable valuation. However, ROE is neutral at 10.1%, while ROIC (3.41%) lags behind a high WACC (14.45%), marking an unfavorable capital return. Liquidity ratios remain weak with current and quick ratios at 0.42. Leverage is elevated with a 1.21 debt-to-equity ratio and low interest coverage (0.44), suggesting risk. Overall, the ratio profile is slightly unfavorable.
Shareholder Return Policy
Bank of America maintains a dividend payout ratio near 31%, with dividends per share rising steadily to $1.30 in 2025 and a yield of 2.36%. The company supports distributions through free cash flow coverage and also engages in share buybacks to return capital.
This balanced approach aligns with sustainable long-term value creation by combining stable dividends and buybacks, while free cash flow coverage reduces risk of over-distribution. The policy reflects prudent capital allocation amid moderate leverage and consistent profitability.
Score analysis
Here is a radar chart illustrating Bank of America Corporation’s key financial scores across major valuation and performance metrics:
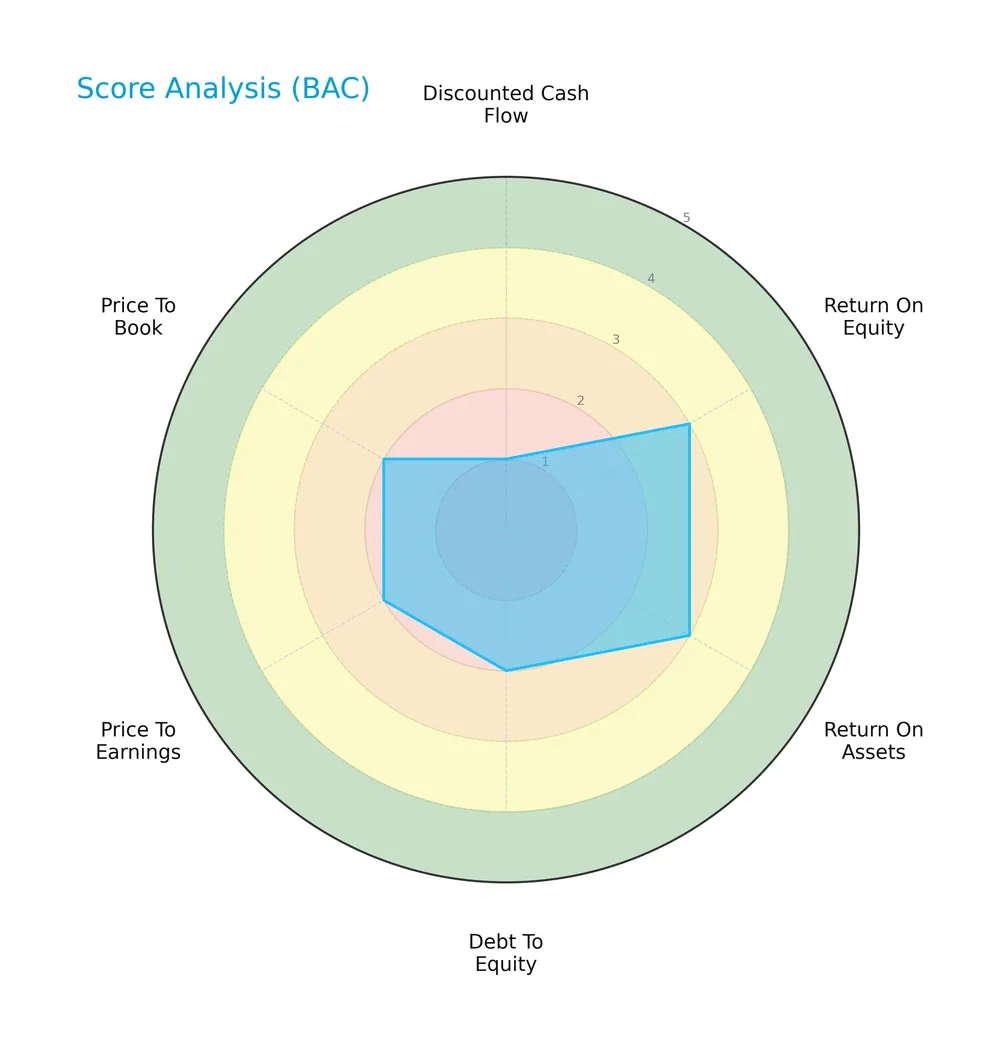
The company shows moderate scores in return on equity (3) and return on assets (3). However, discounted cash flow (1), debt to equity (2), price to earnings (2), and price to book (2) scores remain unfavorable, reflecting valuation and leverage concerns.
Analysis of the company’s bankruptcy risk
Bank of America’s Altman Z-Score places it in the distress zone, signaling a high risk of financial distress and potential bankruptcy:

Is the company in good financial health?
The Piotroski Score diagram below summarizes the company’s financial health based on profitability, leverage, and efficiency factors:

With a Piotroski Score of 6, the company demonstrates average financial health, indicating moderate strength but room for improvement in financial robustness.
Competitive Landscape & Sector Positioning
This section examines Bank of America Corporation’s strategic positioning, revenue segments, key products, and main competitors within financial services. I will assess whether the company holds a competitive advantage over its peers.
Strategic Positioning
Bank of America maintains a diversified product portfolio spanning consumer banking, wealth management, global markets, and investment banking. Geographically, it concentrates heavily in the United States, generating over $88B in 2024, with moderate exposure to Asia, EMEA, and Latin America.
Revenue by Segment
This pie chart illustrates Bank of America’s revenue distribution across major business segments for the fiscal year ending December 31, 2024.
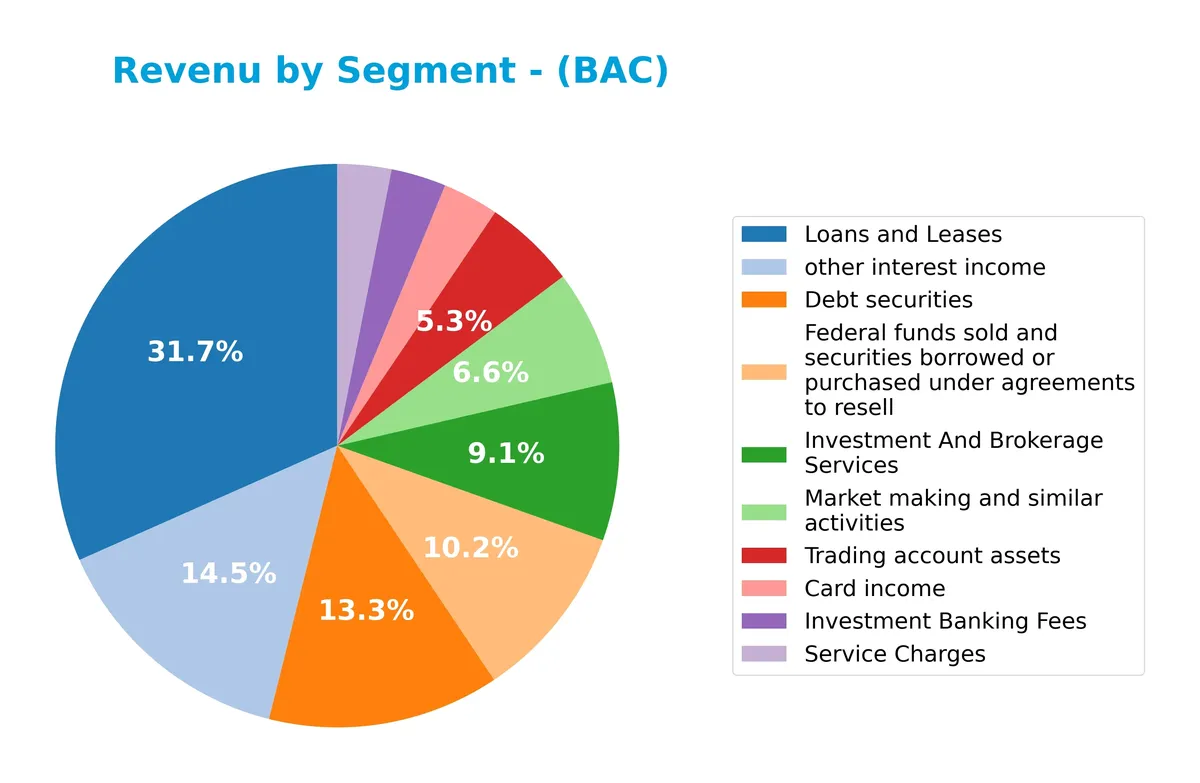
In 2024, loans and leases dominate with $62B, reflecting the core banking strength. Other interest income surged to $28.3B, signaling rising yields or loan growth. Debt securities and federal funds sold also contribute substantially at $26B and $19.9B, respectively. Investment and brokerage services grew to $17.8B, supporting diversified revenue. Market making and card income remain steady, but negative other income warrants caution. The bank’s revenue shows a strong concentration in lending and interest-related activities, consistent with sector norms.
Key Products & Brands
The table below outlines Bank of America’s main products and services by segment and revenue contribution:
| Product | Description |
|---|---|
| Loans and Leases | Includes consumer, automotive, recreational vehicle, and commercial loans generating $62B in 2024. |
| Market Making and Similar Activities | Revenue from trading activities and market-making totaling $13B in 2024. |
| Debt Securities | Income from debt securities investments, contributing $26B in 2024. |
| Federal Funds Sold and Securities Borrowed | Short-term funding and securities resale agreements, $20B revenue in 2024. |
| Trading Account Assets | Revenues from trading assets and securities, $10.4B in 2024. |
| Other Interest Income | Interest earned outside core lending, reported $28B in 2024. |
| Card Income | Income from credit and debit card services, $6.3B in 2024. |
| Service Charges | Fees from account maintenance and other services, $6.1B in 2024. |
| Investment and Brokerage Services | Includes wealth management, brokerage, and investment products, delivering $17.8B in 2024. |
| Investment Banking Fees | Fees from underwriting, advisory, and capital markets activities, $6.2B in 2024. |
Bank of America’s product mix spans traditional banking, capital markets, wealth management, and card services. This diversified revenue base reflects its broad market reach and comprehensive financial offerings.
Main Competitors
There are 4 competitors in total, with the table below listing the top 4 leaders by market capitalization:
| Competitor | Market Cap. |
|---|---|
| JPMorgan Chase & Co. | 886B |
| Bank of America Corporation | 409B |
| Wells Fargo & Company | 310B |
| Citigroup Inc. | 221B |
Bank of America Corporation ranks 2nd among its competitors. Its market cap is 42.6% of the sector leader, JPMorgan Chase & Co. The company is below the average market cap of the top 10 peers but above the sector median. It holds a significant 134.7% market cap gap over Wells Fargo, the next closest rival.
Comparisons with competitors
Check out how we compare the company to its competitors:
Does BAC have a competitive advantage?
Bank of America does not currently present a competitive advantage. Its return on invested capital (ROIC) is significantly below its cost of capital (WACC), indicating value destruction and declining profitability over 2021-2025.
Looking ahead, BAC has opportunities to expand its global footprint, particularly in Asia and EMEA, where revenue growth has been steady. The company’s broad product range across consumer, wealth management, and global banking segments may support future market penetration.
SWOT Analysis
This analysis identifies Bank of America Corporation’s key strategic factors to guide investment decisions.
Strengths
- strong market position
- diverse revenue streams
- solid dividend yield
Weaknesses
- declining ROIC below WACC
- unfavorable liquidity ratios
- high interest expense ratio
Opportunities
- expanding digital banking platform
- growth in global wealth management
- increasing cross-border business
Threats
- intense regulatory environment
- rising interest rates impact
- competitive pressure from fintechs
Bank of America’s strengths in market reach and income stability contrast with weakening profitability metrics. Strategic focus should target operational efficiency and innovation to mitigate financial risks.
Stock Price Action Analysis
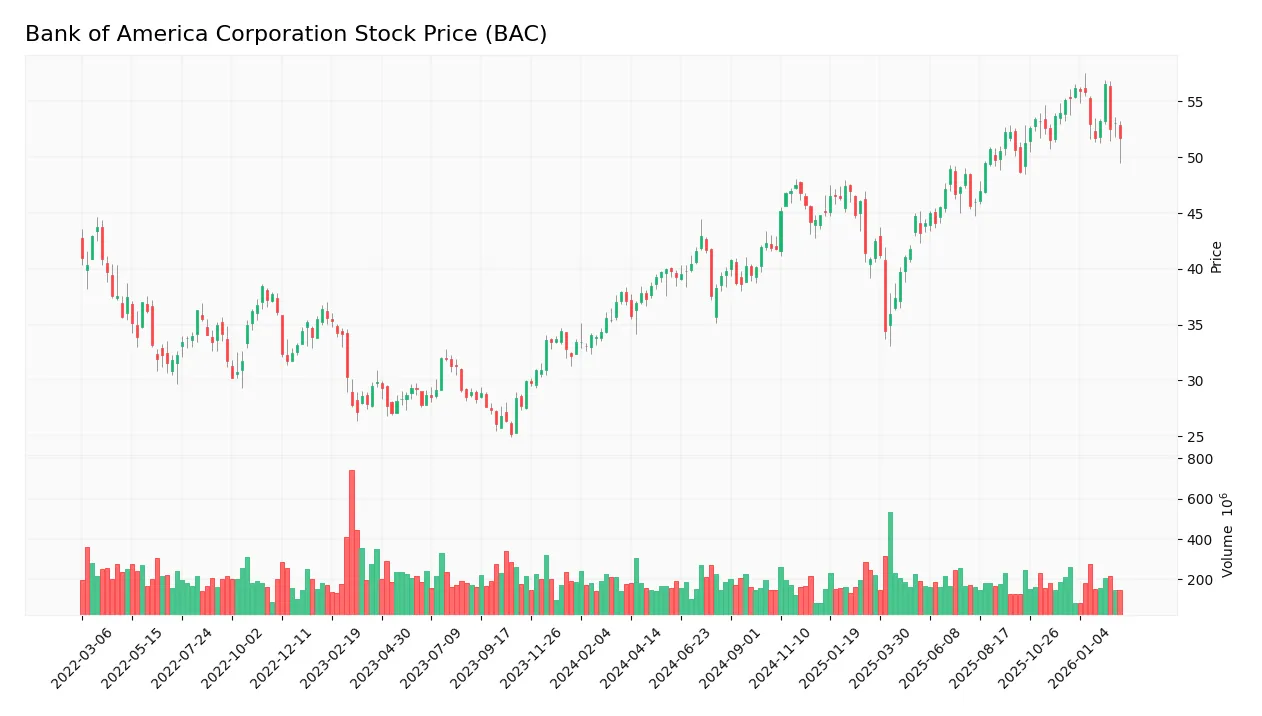
The weekly chart below illustrates Bank of America Corporation’s stock price movements over the past 12 months:
Trend Analysis
Over the past 12 months, BAC’s stock price increased by 39.29%, indicating a bullish trend. The trend shows deceleration despite a significant rise. Price volatility remains elevated with a 5.67 standard deviation. The highest price reached 56.53, and the lowest was 34.39, marking a wide trading range.
Volume Analysis
Trading volumes total 22.4B shares, with buyers controlling 59.92%, suggesting a buyer-driven market. However, volume trends are decreasing, indicating waning market participation. In the recent three months, buyer dominance is neutral at 50.48%, reflecting balanced trading activity and cautious investor sentiment.
Target Prices
Analysts set a clear target consensus for Bank of America Corporation.
| Target Low | Target High | Consensus |
|---|---|---|
| 50 | 71 | 60.33 |
The target prices indicate moderate upside potential, with a consensus around $60.33, reflecting cautious optimism in the financial sector.

Don’t Let Luck Decide Your Entry Point
Optimize your entry points with our advanced ProRealTime indicators. You’ll get efficient buy signals with precise price targets for maximum performance. Start outperforming now!
Analyst & Consumer Opinions
This section examines Bank of America Corporation’s analyst ratings and consumer feedback to gauge market sentiment and customer satisfaction.
Stock Grades
Here are the latest verified stock grades for Bank of America Corporation from leading financial institutions:
| Grading Company | Action | New Grade | Date |
|---|---|---|---|
| Morgan Stanley | Maintain | Overweight | 2026-01-15 |
| Truist Securities | Maintain | Buy | 2026-01-15 |
| Piper Sandler | Maintain | Neutral | 2026-01-15 |
| Evercore ISI Group | Maintain | Outperform | 2026-01-15 |
| TD Cowen | Maintain | Buy | 2026-01-15 |
| Keefe, Bruyette & Woods | Maintain | Outperform | 2026-01-15 |
| Wolfe Research | Downgrade | Peer Perform | 2026-01-07 |
| TD Cowen | Maintain | Buy | 2026-01-07 |
| Goldman Sachs | Maintain | Buy | 2026-01-06 |
| Truist Securities | Maintain | Buy | 2026-01-06 |
Most analysts maintain a positive outlook, predominantly issuing Buy or Outperform ratings. Wolfe Research’s recent downgrade stands out as a cautious signal amid broad optimism.
Consumer Opinions
Bank of America garners a mixed yet insightful range of consumer sentiments, reflecting its vast footprint in retail banking.
| Positive Reviews | Negative Reviews |
|---|---|
| Efficient online banking with user-friendly apps | Customer service can be slow and unresponsive |
| Wide ATM network with convenient access | High fees on certain accounts and services |
| Competitive mortgage and loan rates | Occasional technical glitches during peak hours |
| Strong security measures protecting accounts | Limited personalized financial advice |
Consumers often praise Bank of America’s digital convenience and accessibility. However, many express frustration with customer service delays and fees, underscoring areas for operational improvement.
Risk Analysis
Below is a summary table of key risks facing Bank of America Corporation as of 2026:
| Category | Description | Probability | Impact |
|---|---|---|---|
| Liquidity Risk | Current and quick ratios at 0.42 indicate weak short-term liquidity buffers. | High | High |
| Leverage Risk | Debt-to-equity ratio at 1.21 signals elevated financial leverage. | Medium | Medium |
| Profitability | ROIC (3.41%) below WACC (14.45%) shows value destruction on invested capital. | High | High |
| Credit Risk | Exposure to loan defaults could rise amid economic uncertainty. | Medium | High |
| Market Volatility | Beta of 1.27 suggests above-average sensitivity to market swings. | High | Medium |
| Bankruptcy Risk | Altman Z-Score in distress zone (-0.26) warns of financial instability. | Medium-High | Very High |
| Dividend Safety | Dividend yield at 2.36% is favorable but interest coverage at 0.44 is weak. | Medium | Medium |
The most pressing risks are liquidity constraints and capital inefficiency. The bank’s ROIC falling short of its WACC signals a critical capital allocation issue, eroding shareholder value. Additionally, the disturbing Altman Z-Score places the company in the distress zone, raising bankruptcy concerns uncommon for a top-tier bank. Weak interest coverage further exacerbates financial strain, underscoring the need for cautious risk management.
Should You Buy Bank of America Corporation?
Bank of America appears to have a challenging leverage profile and a deteriorating competitive moat, with declining ROIC suggesting value destruction. Despite moderate profitability metrics, the overall rating stands at C+, reflecting considerable financial risks and operational inefficiencies.
Strength & Efficiency Pillars
Bank of America Corporation posts a solid net margin of 16.23% and maintains a moderate return on equity at 10.1%. Its gross margin stands favorably at 55.42%, underscoring operational efficiency. However, the return on invested capital (3.41%) trails its weighted average cost of capital (14.45%), signaling value destruction rather than creation. Despite decent operational margins, the company’s returns fall short of what is required to generate sustainable shareholder value.
Weaknesses and Drawbacks
The company is in financial distress, with an Altman Z-Score of -0.26, indicating a high bankruptcy risk. This solvency concern overshadows other metrics. Additionally, its debt-to-equity ratio of 1.21 is unfavorable, reflecting high leverage. Liquidity is weak, with a current ratio of 0.42, signaling difficulty covering short-term obligations. Interest coverage is critically low at 0.44, raising red flags about the ability to service debt. Although P/E (13.23) and P/B (1.34) ratios appear reasonable, the overall financial strain presents significant risks.
Our Final Verdict about Bank of America Corporation
Despite stable operational margins, the company’s position in the distress zone (Z-Score: -0.26) makes the profile highly speculative. The solvency risk outweighs profitability and market trends. Investors seeking conservative capital preservation may find this stock too risky. The financial health concerns suggest caution until a clear turnaround in balance sheet strength emerges.
Disclaimer: This content is for informational purposes only and does not constitute financial, investment, or other professional advice. Investing in financial markets involves a significant risk of loss, and past performance is not indicative of future results.
Additional Resources
- Waratah Capital Advisors Ltd. Takes Position in Bank of America Corporation $BAC – MarketBeat (Feb 25, 2026)
- Bank of America N Or Q Preferred Shares: Q Is The Better Choice (Rating Upgrade) – Seeking Alpha (Feb 24, 2026)
- Bank of America (BAC) Strengthens Private Credit Platform with $25B Deployment – Yahoo Finance (Feb 23, 2026)
- New BofA Rewards™ Program to Reach Millions More Clients with Expanded Benefits – Bank of America (Feb 18, 2026)
- BANK OF AMERICA CORP /DE/ SEC 10-K Report – TradingView (Feb 25, 2026)
For more information about Bank of America Corporation, please visit the official website: bankofamerica.com