Home > Analyses > Consumer Cyclical > Ball Corporation
Ball Corporation transforms everyday experiences by shaping how beverages reach consumers worldwide. It dominates the aluminum packaging sector, serving top brands with sustainable, high-quality containers. Beyond packaging, its aerospace segment pioneers cutting-edge technology for defense and space exploration. Known for innovation and operational excellence, Ball stands at a crossroads in 2026. I ask: do its solid fundamentals and growth prospects still justify its current market valuation?
Table of contents
Business Model & Company Overview
Ball Corporation, founded in 1880 and headquartered in Westminster, Colorado, commands a leading position in the packaging and aerospace sectors. It offers a cohesive ecosystem of aluminum packaging solutions for beverages, personal care, and household products, complemented by advanced aerospace technologies. The company’s diversified portfolio spans from consumer-facing containers to sophisticated satellite and defense hardware.
Ball’s revenue engine balances durable aluminum beverage containers with high-tech aerospace services and products, serving markets across the Americas, Europe, and Asia. Its recurring aerospace contracts and broad geographical footprint create a powerful competitive advantage. I see Ball’s deep integration of hardware, software, and services as a robust economic moat shaping the future of packaging and aerospace industries alike.
Financial Performance & Fundamental Metrics
I will analyze Ball Corporation’s income statement, key financial ratios, and dividend payout policy to assess its underlying financial health and shareholder value.
Income Statement
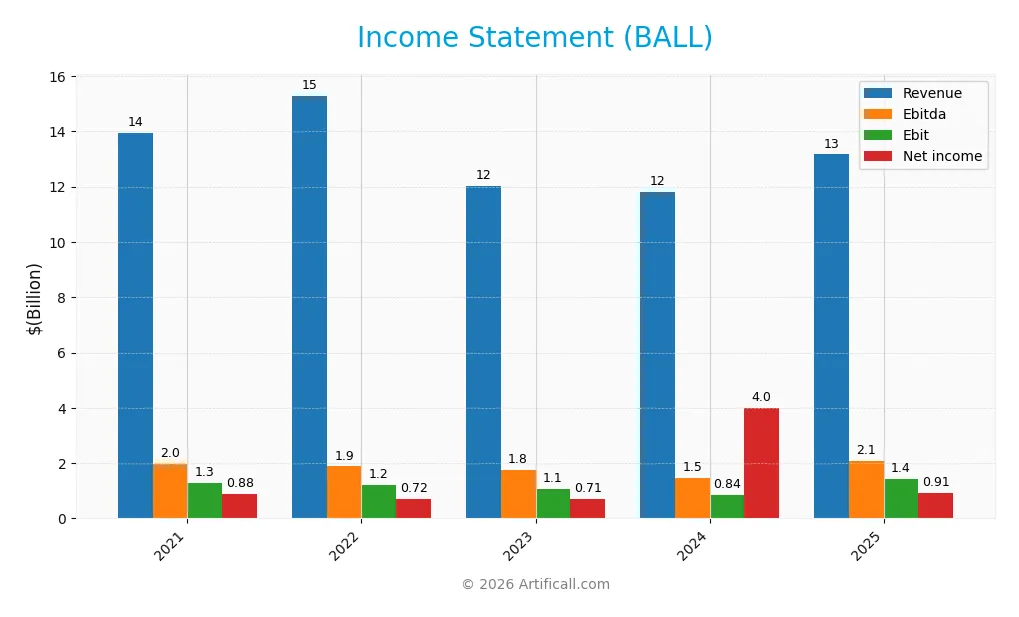
The table below summarizes Ball Corporation’s key income statement figures for fiscal years 2021 through 2025, reflecting revenue, expenses, profits, and earnings per share.
| 2021 | 2022 | 2023 | 2024 | 2025 | |
|---|---|---|---|---|---|
| Revenue | 13.9B | 15.3B | 12.0B | 11.8B | 13.2B |
| Cost of Revenue | 11.9B | 13.5B | 10.3B | 10.0B | 11.2B |
| Operating Expenses | 800M | 742M | 540M | 847M | 566M |
| Gross Profit | 2.0B | 1.8B | 1.7B | 1.8B | 2.0B |
| EBITDA | 2.0B | 1.9B | 1.8B | 1.5B | 2.1B |
| EBIT | 1.3B | 1.2B | 1.1B | 839M | 1.4B |
| Interest Expense | 270M | 313M | 460M | 293M | 314M |
| Net Income | 878M | 719M | 707M | 4.0B | 912M |
| EPS | 2.69 | 2.27 | 2.25 | 13.12 | 3.33 |
| Filing Date | 2022-02-16 | 2023-02-21 | 2024-02-20 | 2025-02-20 | 2026-02-19 |
Income Statement Evolution
Ball Corporation’s revenue declined modestly by 5.5% from 2021 to 2025, with a rebound of 11.6% in the last year. Gross profit growth was positive in the most recent year, supporting a stable gross margin near 15%. EBIT expanded significantly by 72% last year, enhancing operating margins. Net income showed a mild overall increase with a mixed recent-year margin contraction.
Is the Income Statement Favorable?
The 2025 income statement shows strengths in EBIT margin at 11%, net margin near 7%, and controlled interest expenses at 2.4% of revenue. Revenue and gross profit growth last year are favorable, but net margin and EPS fell sharply, reflecting volatile bottom-line performance. Overall, 64% of income metrics rate favorable, indicating generally solid fundamentals amid some margin pressure.
Financial Ratios
The table below presents key financial ratios for Ball Corporation over the last five fiscal years, providing a snapshot of profitability, liquidity, leverage, and market valuation:
| Ratios | 2021 | 2022 | 2023 | 2024 | 2025 |
|---|---|---|---|---|---|
| Net Margin | 6.3% | 4.7% | 5.9% | 34.0% | 6.9% |
| ROE | 24.2% | 20.8% | 18.8% | 68.4% | 16.8% |
| ROIC | 7.5% | 5.8% | 6.4% | 5.7% | 7.8% |
| P/E | 35.7x | 22.5x | 25.6x | 4.2x | 15.9x |
| P/B | 8.7x | 4.7x | 4.8x | 2.9x | 2.7x |
| Current Ratio | 0.88 | 0.78 | 0.79 | 1.00 | 1.11 |
| Quick Ratio | 0.58 | 0.47 | 0.54 | 0.69 | 0.75 |
| D/E | 2.25 | 2.72 | 2.27 | 1.03 | 1.29 |
| Debt-to-Assets | 41.4% | 47.2% | 44.4% | 34.1% | 35.9% |
| Interest Coverage | 4.6x | 3.2x | 2.6x | 3.4x | 4.4x |
| Asset Turnover | 0.71 | 0.77 | 0.62 | 0.67 | 0.67 |
| Fixed Asset Turnover | 2.01 | 2.04 | 1.70 | 1.81 | 1.98 |
| Dividend Yield | 0.73% | 1.57% | 1.39% | 1.45% | 1.51% |
Evolution of Financial Ratios
From 2021 to 2025, Ball Corporation’s Return on Equity (ROE) showed volatility but improved notably by 2025 to 16.82%. The Current Ratio rose steadily from below 1.0 to 1.11, indicating better short-term liquidity. Debt-to-Equity fluctuated, peaking near 2.7 before easing to 1.29 in 2025, signaling reduced leverage. Profitability margins remained mostly stable with some fluctuations.
Are the Financial Ratios Fovorable?
In 2025, profitability is neutral with a net margin of 6.93% and ROE favorable at 16.82%, surpassing WACC at 7.63%. Liquidity shows mixed signals: the Current Ratio is neutral at 1.11, but the Quick Ratio is unfavorable at 0.75. Leverage remains a concern with an unfavorable Debt-to-Equity of 1.29. Efficiency and market valuation ratios mostly appear neutral, supporting an overall neutral assessment.
Shareholder Return Policy
Ball Corporation maintains a consistent dividend payout ratio near 24%, with a stable dividend per share around $0.80, yielding roughly 1.5% annually. The company also supports shareholder returns through share buybacks, covered adequately by free cash flow.
This balanced approach aligns dividend payments and buybacks with operational cash generation, suggesting prudent capital allocation. Such discipline supports sustainable long-term value creation while mitigating risks from excessive distributions or leverage.
Score analysis
The radar chart below summarizes Ball Corporation’s key financial scores across valuation, profitability, and leverage metrics:
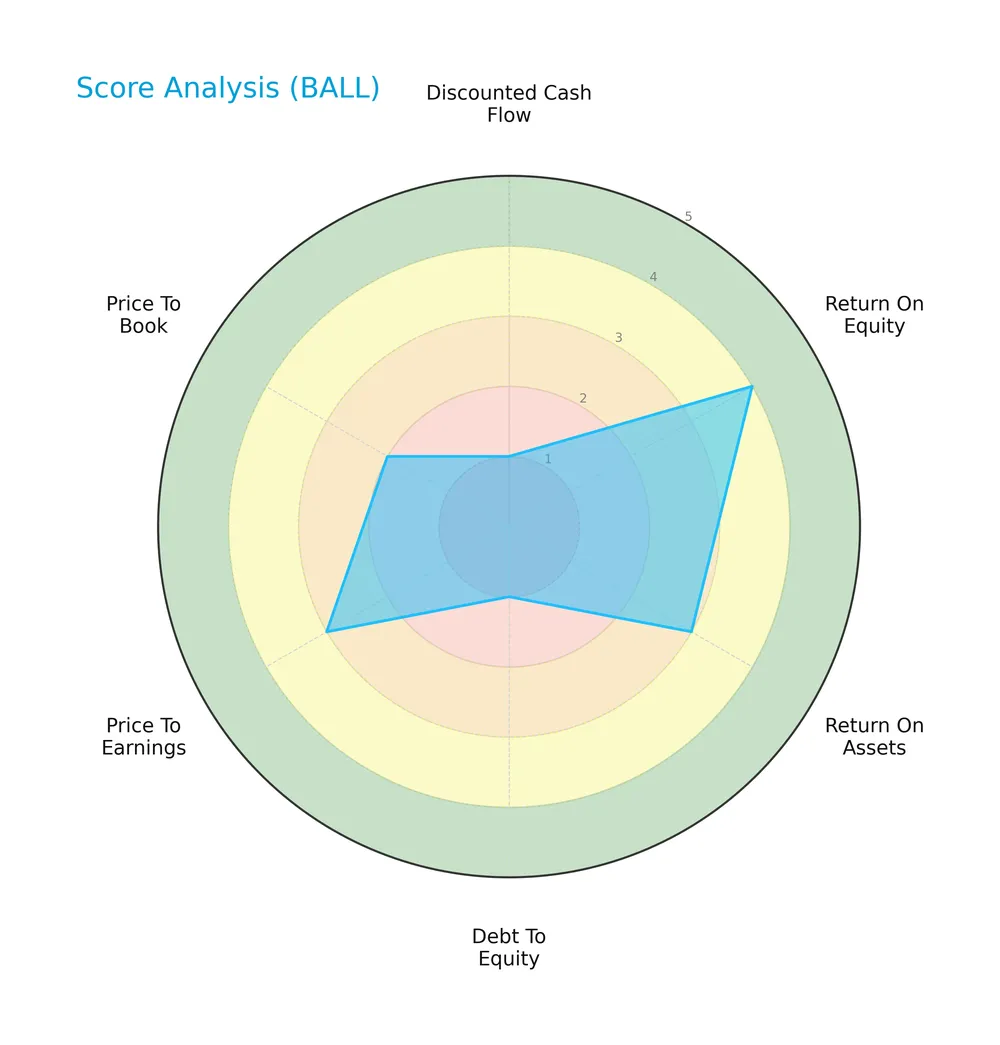
Ball Corporation’s return on equity scores favorably at 4, reflecting solid shareholder returns. Return on assets and price-to-earnings score moderately at 3. However, discounted cash flow and debt-to-equity scores lag significantly at 1, indicating valuation and leverage concerns. Price-to-book stands at 2, also unfavorable.
Analysis of the company’s bankruptcy risk
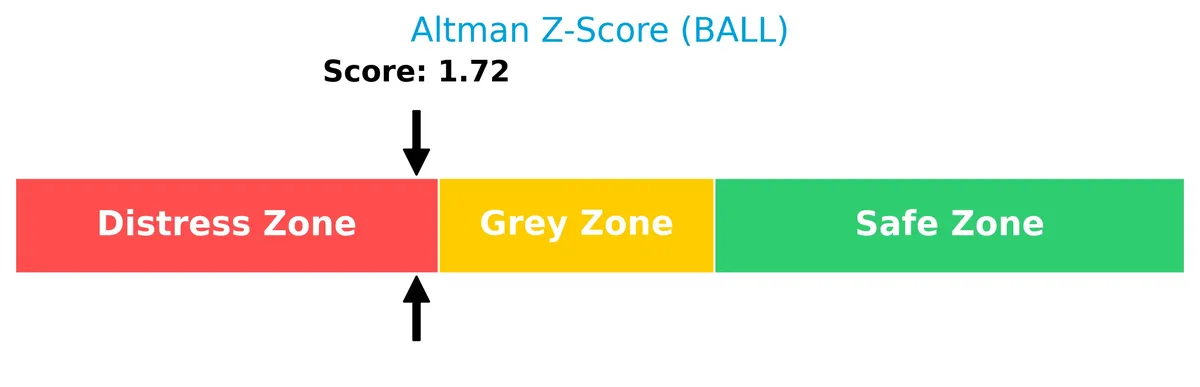
Ball Corporation’s Altman Z-Score places it in the distress zone, signaling elevated bankruptcy risk and financial vulnerability:
Is the company in good financial health?
The Piotroski Score diagram highlights Ball Corporation’s financial strength based on profitability, leverage, and liquidity criteria:
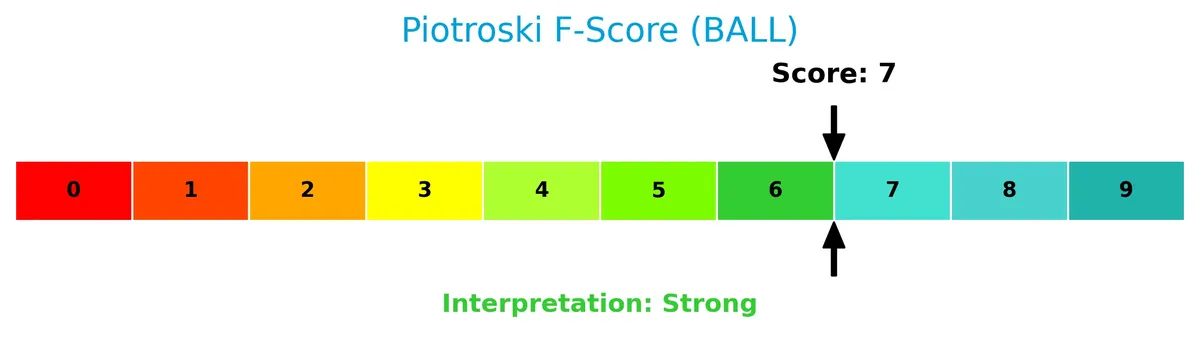
With a strong Piotroski Score of 7, the company demonstrates robust financial health, suggesting competent management and solid fundamentals despite some risk factors.
Competitive Landscape & Sector Positioning
This analysis examines Ball Corporation’s strategic positioning, revenue breakdown, and key products within its sector. I will assess whether Ball holds a competitive advantage over its main competitors.
Strategic Positioning
Ball Corporation maintains a diversified product portfolio focused on aluminum beverage and household packaging across Americas, Europe, and Asia. It also holds a specialized aerospace segment. Geographically, revenue spreads primarily across the US (6.16B in 2025), Brazil (1.49B), and other regions (5.5B), reflecting broad international exposure.
Revenue by Segment
The pie chart displays Ball Corporation’s revenue distribution across key packaging segments for fiscal year 2025. It highlights the contribution of each division to the company’s total sales in that period.
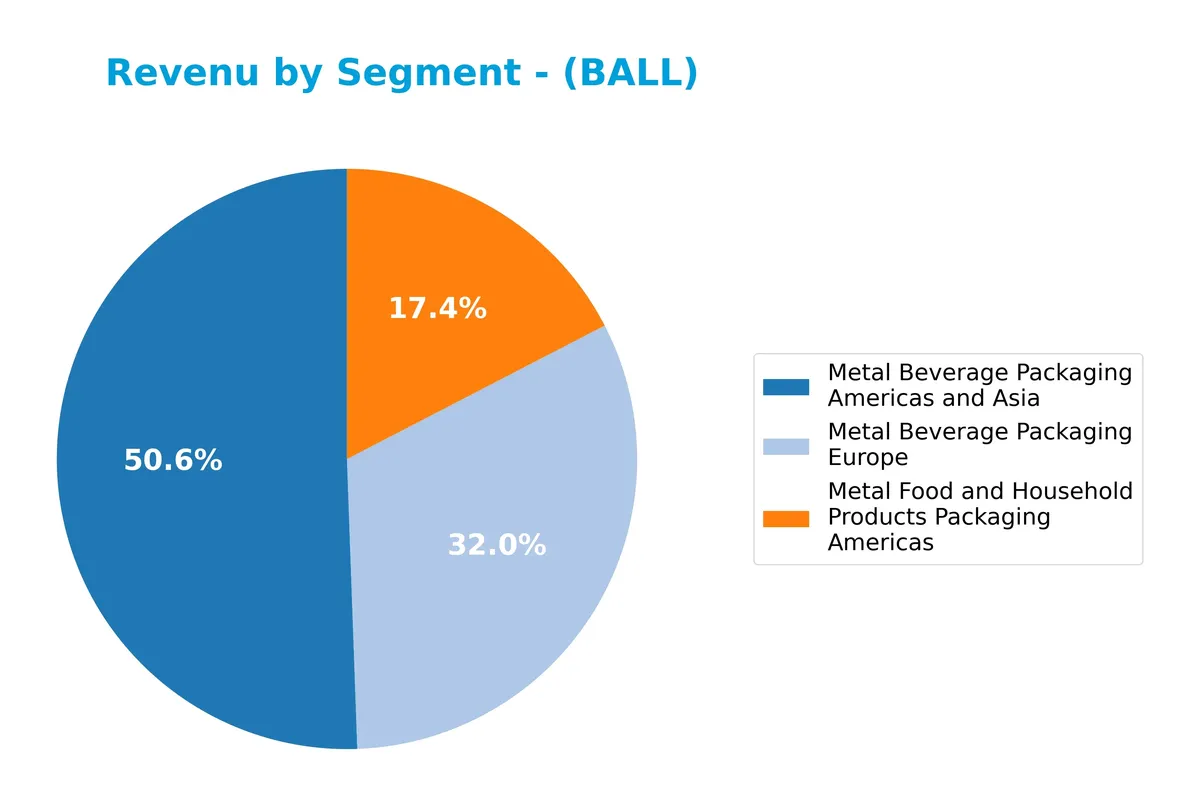
In 2025, Metal Beverage Packaging Americas and Asia leads with $6.3B, showing steady growth since 2021. Europe follows at $4B, recovering from a slight dip in 2023. Metal Food and Household Packaging Americas remains smaller at $2.2B but consistently expands. The data suggests a stable, diversified revenue base with no excessive concentration risk, as all segments contribute meaningfully to overall growth.
Key Products & Brands
Ball Corporation generates revenue primarily from a range of aluminum packaging products and aerospace technologies as detailed below:
| Product | Description |
|---|---|
| Metal Beverage Packaging Americas and Asia | Aluminum beverage containers for carbonated soft drinks, beer, energy drinks, and other beverages across the Americas and Asia. |
| Metal Beverage Packaging Europe | Aluminum beverage packaging products serving the European market. |
| Metal Food and Household Products Packaging Americas | Extruded aluminum aerosol containers, recloseable aluminum bottles, aluminum cups, and slugs for food and household products in the Americas. |
| Aerospace | Development and manufacture of spacecraft, sensors, radio frequency systems, satellites, and related aerospace technologies for civil, commercial, and national security markets. |
Ball Corporation’s product portfolio balances traditional aluminum packaging with specialized aerospace technology, reflecting a diversified industrial footprint across global markets.
Main Competitors
The sector includes 5 competitors, with the table below showing the top 5 leaders by market capitalization:
| Competitor | Market Cap. |
|---|---|
| International Paper Company | 21.3B |
| Smurfit Westrock Plc | 20.7B |
| Amcor plc | 19.4B |
| Packaging Corporation of America | 19.0B |
| Ball Corporation | 14.3B |
Ball Corporation ranks 5th among its peers. Its market cap equals 83.9% of the sector leader, International Paper Company. The company sits below both the average top-10 market cap of 18.9B and the sector median of 19.4B. It maintains a 6.54% market cap gap to the next competitor above.
Comparisons with competitors
Check out how we compare the company to its competitors:
Does BALL have a competitive advantage?
Ball Corporation currently does not demonstrate a strong competitive advantage, as its ROIC remains below the WACC, indicating value shedding. However, the company shows a slightly favorable moat with a growing ROIC trend, reflecting improving profitability over 2021-2025.
Looking ahead, Ball’s diverse aluminum packaging operations and aerospace segment position it to capitalize on expanding markets and new product innovations. Continued growth in revenue from the U.S. and international markets suggests opportunities to strengthen its competitive standing.
SWOT Analysis
This SWOT analysis distills Ball Corporation’s strategic position by highlighting internal capabilities and external market conditions.
Strengths
- strong EBIT margin at 10.96%
- diversified global footprint
- growing ROIC trend
Weaknesses
- weak quick ratio at 0.75
- high debt-to-equity ratio of 1.29
- recent net margin and EPS decline
Opportunities
- expanding beverage packaging demand
- aerospace segment innovation
- potential for margin improvement
Threats
- raw material cost volatility
- intense packaging industry competition
- financial distress risk indicated by Altman Z-score
Ball Corporation shows operational strength and improving profitability but carries liquidity and leverage risks. Its strategy should focus on strengthening the balance sheet while leveraging growth in aerospace and sustainable packaging.
Stock Price Action Analysis
The following weekly chart illustrates Ball Corporation’s stock price movement over the last 100 weeks, highlighting key price fluctuations and trend patterns:
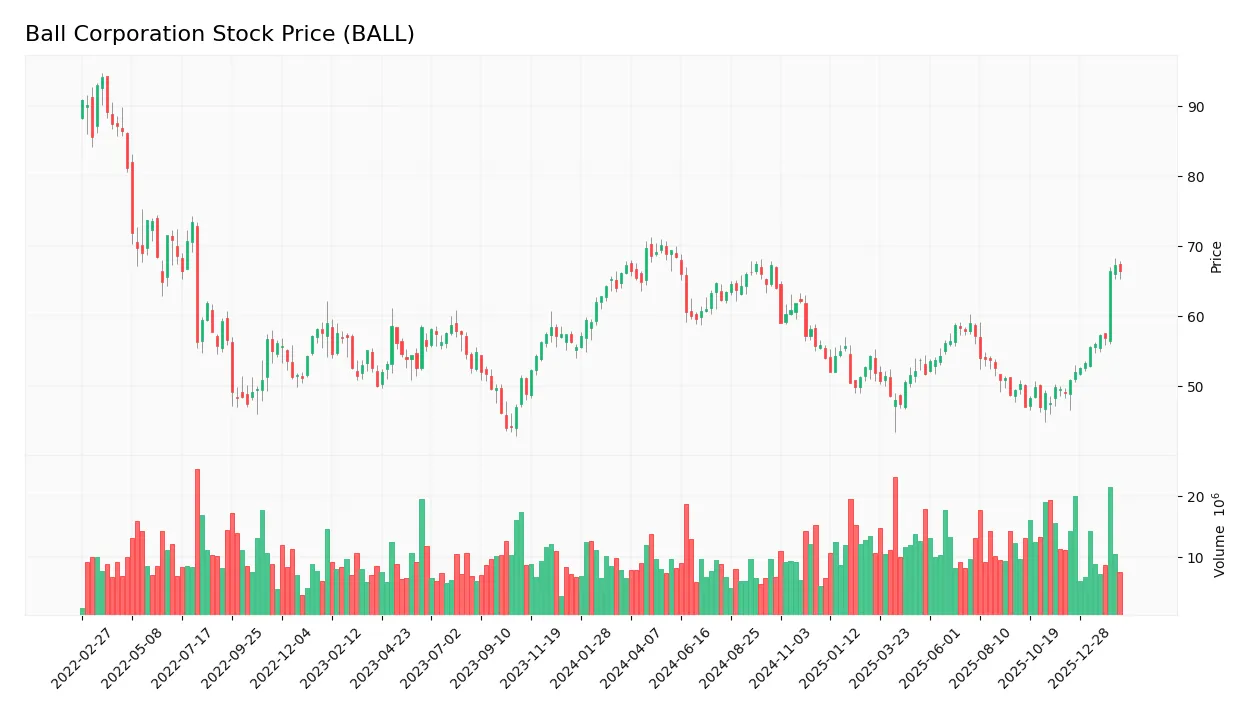
Trend Analysis
Over the past 12 months, Ball Corporation’s stock declined by 1.23%, indicating a bearish trend. The price showed acceleration despite this drop, with volatility measured by a 6.71 standard deviation. The highest price hit 70.11, the lowest fell to 47.0, reflecting notable price swings during this period.
Volume Analysis
Trading volume has increased recently, with buyers accounting for 55.57% of total activity over the full period. In the last three months, buyer dominance surged to 79.96%, signaling strong buyer control. This suggests heightened market participation and positive investor sentiment driving demand.
Target Prices
Analysts present a moderately bullish target consensus for Ball Corporation.
| Target Low | Target High | Consensus |
|---|---|---|
| 66 | 75 | 69.86 |
The target range reflects confidence in Ball’s growth potential, with the consensus near 70 indicating steady upside.

Don’t Let Luck Decide Your Entry Point
Optimize your entry points with our advanced ProRealTime indicators. You’ll get efficient buy signals with precise price targets for maximum performance. Start outperforming now!
Analyst & Consumer Opinions
This section examines Ball Corporation’s recent analyst ratings alongside consumer feedback to gauge market sentiment and brand perception.
Stock Grades
Here is the latest summary of Ball Corporation’s stock grades from leading financial institutions:
| Grading Company | Action | New Grade | Date |
|---|---|---|---|
| Citigroup | Maintain | Buy | 2026-02-05 |
| Mizuho | Maintain | Outperform | 2026-02-04 |
| JP Morgan | Maintain | Neutral | 2026-02-04 |
| Truist Securities | Maintain | Buy | 2026-02-04 |
| Jefferies | Maintain | Buy | 2026-02-04 |
| Wells Fargo | Maintain | Overweight | 2026-02-04 |
| UBS | Maintain | Neutral | 2026-01-12 |
| Citigroup | Upgrade | Buy | 2026-01-06 |
| Truist Securities | Maintain | Buy | 2026-01-06 |
| Wells Fargo | Upgrade | Overweight | 2026-01-06 |
The consensus shows a strong bias toward buying, with 15 buy ratings and no sells. Most firms maintain positive outlooks, reflecting confidence in Ball Corporation’s prospects amid stable market conditions.
Consumer Opinions
Ball Corporation evokes a mix of respect and frustration among consumers, reflecting its complex market position.
| Positive Reviews | Negative Reviews |
|---|---|
| Durable packaging solutions that enhance product safety. | Customer service response times can be slow. |
| Strong commitment to sustainability and eco-friendly materials. | Pricing occasionally higher than competitors. |
| Reliable supply chain performance, ensuring timely deliveries. | Limited product variety in certain regions. |
Overall, consumers praise Ball’s sustainability efforts and product reliability. However, slow customer service and regional product limitations temper enthusiasm. These mixed signals suggest room for operational improvements despite a strong brand foundation.
Risk Analysis
Below is a summary table outlining Ball Corporation’s key risk categories, their likelihood, and potential impact:
| Category | Description | Probability | Impact |
|---|---|---|---|
| Financial Health | Altman Z-Score of 1.72 signals increased bankruptcy risk. | High | High |
| Liquidity | Quick ratio at 0.75 is below 1, indicating potential cash issues. | Medium | Medium |
| Leverage | Debt-to-equity ratio of 1.29 raises concerns on financial risk. | Medium | High |
| Market Volatility | Beta of 1.14 suggests above-market sensitivity to economic swings. | Medium | Medium |
| Operational | Exposure to commodity costs and global supply chain volatility. | Medium | Medium |
Ball’s most pressing risk is financial distress, highlighted by its Altman Z-score in the distress zone. The firm’s weak quick ratio and high leverage compound this risk. Market volatility and operational headwinds add pressure but remain secondary concerns.
Should You Buy Ball Corporation?
Ball Corporation appears to be improving profitability with a slightly favorable moat, reflecting growing operational efficiency despite shedding value relative to WACC. Its leverage profile remains substantial, posing risks. The overall B- rating suggests a cautiously favorable but complex investment profile.
Strength & Efficiency Pillars
Ball Corporation shows solid operational efficiency with an EBIT margin of 10.96% and a net margin of 6.93%. Its return on equity stands at a favorable 16.82%, reflecting competent capital management. The company’s ROIC of 7.83% slightly exceeds its WACC of 7.63%, indicating it remains a modest value creator. Despite the modest margin profile, Ball’s improving profitability trends suggest operational resilience in a competitive packaging sector.
Weaknesses and Drawbacks
Ball Corporation is currently in financial distress, as evidenced by an Altman Z-Score of 1.72, signaling heightened bankruptcy risk. This solvency concern overshadows other financial metrics. Additionally, the company’s debt-to-equity ratio of 1.29 is unfavorable, indicating significant leverage that could strain liquidity. The quick ratio at 0.75 suggests potential short-term liquidity challenges. Valuation metrics remain neutral to unfavorable, with a P/E of 15.93 and P/B of 2.68, implying limited margin for valuation upside.
Our Final Verdict about Ball Corporation
Despite operational strengths and improving margins, Ball Corporation’s low Altman Z-Score places it in the distress zone, making its financial health highly speculative. This solvency risk suggests the stock may be too risky for conservative capital, regardless of recent positive buyer dominance and improving earnings trends. Investors might consider a cautious stance until solvency improves materially.
Disclaimer: This content is for informational purposes only and does not constitute financial, investment, or other professional advice. Investing in financial markets involves a significant risk of loss, and past performance is not indicative of future results.
Additional Resources
- Vanguard Group Inc. Sells 684,949 Shares of Ball Corporation $BALL – MarketBeat (Feb 21, 2026)
- Ball Corporation to Present at Bank of America’s 2026 Global Agriculture and Materials Conference – Yahoo Finance (Feb 17, 2026)
- Ball Corporation Share Its Employee-First Strategy – ball.com (Sep 02, 2025)
- BALL Corp SEC 10-K Report – TradingView (Feb 19, 2026)
- Ball Corporation to Present at Bank of America’s 2026 Global Agr – GuruFocus (Feb 17, 2026)
For more information about Ball Corporation, please visit the official website: ball.com