Home > Analyses > Communication Services > Baidu, Inc.
Baidu powers how millions in China discover information and engage with digital content daily. As a pioneer in internet search and AI-driven services, it commands a dominant position in the Communication Services sector. Its Baidu Core and iQIYI platforms blend cutting-edge technology with rich entertainment, setting high industry standards. Yet, in a rapidly evolving market, I question if Baidu’s fundamentals continue to justify its premium valuation and growth ambitions.

Table of contents
Business Model & Company Overview
Baidu, Inc., founded in 2000 and headquartered in Beijing, dominates China’s internet content and information sector. Its core business blends online marketing with AI-driven cloud services, powering an ecosystem that spans search, video platforms, and digital content. With 35,900 employees, Baidu integrates user-generated and professional content, creating a seamless digital experience across its Baidu Core and iQIYI segments.
The company’s revenue engine balances advertising on its search and feed platforms with subscription and content sales on iQIYI. Baidu’s strategic footprint spans the Chinese market, leveraging AI innovation to expand cloud services. This dual approach fosters a strong competitive advantage by combining scalable recurring revenue with high-margin tech products. Baidu’s economic moat lies in its AI capabilities and entrenched market presence, shaping the future of digital engagement in China.
Financial Performance & Fundamental Metrics
I analyze Baidu, Inc.’s income statement, key financial ratios, and dividend payout policy to assess its core profitability and capital allocation efficiency.
Income Statement
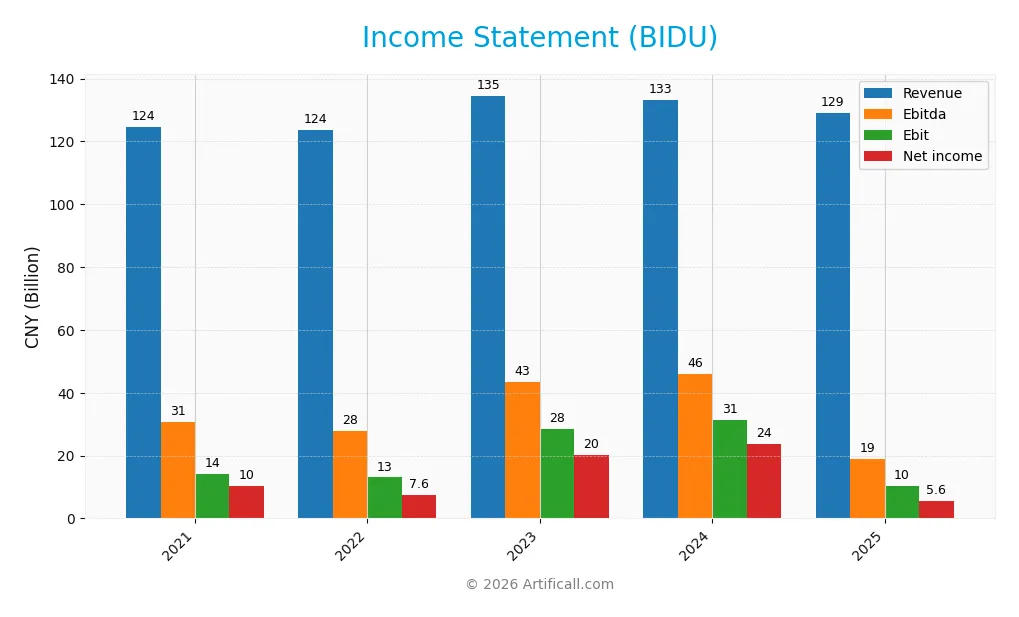
The table below summarizes Baidu, Inc.’s key income statement figures for fiscal years 2021 through 2025, reported in CNY.
| 2021 | 2022 | 2023 | 2024 | 2025 | |
|---|---|---|---|---|---|
| Revenue | 124.5B | 123.7B | 134.6B | 133.1B | 129.1B |
| Cost of Revenue | 64.3B | 63.9B | 65.0B | 66.1B | 72.4B |
| Operating Expenses | 49.7B | 43.8B | 47.7B | 45.8B | 62.5B |
| Gross Profit | 60.2B | 59.7B | 69.6B | 67.0B | 56.6B |
| EBITDA | 30.6B | 27.8B | 43.4B | 46.1B | 18.9B |
| EBIT | 14.2B | 13.0B | 28.4B | 31.4B | 10.4B |
| Interest Expense | 3.4B | 2.9B | 3.2B | 2.8B | 2.7B |
| Net Income | 10.2B | 7.6B | 20.3B | 23.8B | 5.6B |
| EPS | 28.64 | 20.00 | 55.84 | 66.48 | 13.28 |
| Filing Date | 2022-03-28 | 2023-03-22 | 2024-03-15 | 2025-03-28 | 2026-03-17 |
Income Statement Evolution
Baidu’s revenue showed a slight decline of 3% from 2024 to 2025, reversing modest growth over the 2021-2025 period. Gross profit contracted by over 15% last year, reflecting margin pressure. EBIT and net income fell sharply, with EBIT margin steady near 8%, but net margin declined, signaling deteriorating profitability.
Is the Income Statement Favorable?
The 2025 income statement reveals weak fundamentals. Despite a gross margin of 44%, net margin slipped to 4.3%, and EBIT margin remained neutral. Operating expenses rose relative to revenue, driving a 67% EBIT drop. Interest expense is low at 2.1%, but overall profitability and earnings per share plunged, confirming an unfavorable trend.
Financial Ratios
The table below summarizes Baidu, Inc.’s key financial ratios from 2021 to 2025, providing a clear view of profitability, valuation, liquidity, leverage, and efficiency metrics:
| Ratios | 2021 | 2022 | 2023 | 2024 | 2025 |
|---|---|---|---|---|---|
| Net Margin | 8.2% | 6.1% | 15.1% | 17.8% | 4.3% |
| ROE | 4.8% | 3.4% | 8.3% | 9.0% | 2.1% |
| ROIC | 2.3% | 3.5% | 5.3% | 4.9% | -1.2% |
| P/E | 31.9 | 36.3 | 14.6 | 9.0 | 77.7 |
| P/B | 1.54 | 1.23 | 1.22 | 0.81 | 1.63 |
| Current Ratio | 2.86 | 2.67 | 3.01 | 2.09 | 1.76 |
| Quick Ratio | 2.84 | 2.66 | 2.99 | 2.01 | 1.76 |
| D/E | 0.43 | 0.41 | 0.35 | 0.30 | 0.36 |
| Debt-to-Assets | 24.1% | 23.4% | 20.8% | 18.5% | 21.6% |
| Interest Coverage | 3.1 | 5.5 | 6.7 | 7.5 | -2.2 |
| Asset Turnover | 0.33 | 0.32 | 0.33 | 0.31 | 0.29 |
| Fixed Asset Turnover | 3.55 | 3.60 | 3.47 | 3.25 | 3.70 |
| Dividend Yield | 0% | 0% | 0% | 0% | 0% |
Evolution of Financial Ratios
From 2021 to 2025, Baidu’s Return on Equity (ROE) declined sharply from 4.8% to 2.1%, indicating weakening profitability. The Current Ratio fell steadily but remains above 1.7, suggesting adequate liquidity. Debt-to-Equity Ratio improved from 0.43 to 0.36, reflecting reduced financial leverage and a more conservative capital structure.
Are the Financial Ratios Favorable?
In 2025, Baidu shows mixed financial health. Profitability ratios like net margin (4.3%) and ROIC (-1.2%) are unfavorable, highlighting operational challenges. Liquidity is solid with current and quick ratios at 1.76. Leverage ratios, including debt-to-equity at 0.36 and debt-to-assets at 21.6%, are favorable. Market valuation is stretched, with a high PE of 77.7 and a neutral PB at 1.63. Overall, the ratios suggest a neutral stance.
Shareholder Return Policy
Baidu, Inc. does not pay dividends, reflecting a reinvestment strategy amid fluctuating profitability and negative free cash flow in recent years. The company maintains share buybacks, signaling an alternative method to return capital to shareholders without immediate cash payouts.
This approach aligns with Baidu’s prioritization of growth and capital allocation toward R&D and acquisitions. While it supports long-term value creation, investors should monitor Baidu’s improving profitability and cash flow stability to assess sustainability.
Score analysis
The radar chart below presents Baidu, Inc.’s key valuation and financial performance scores:
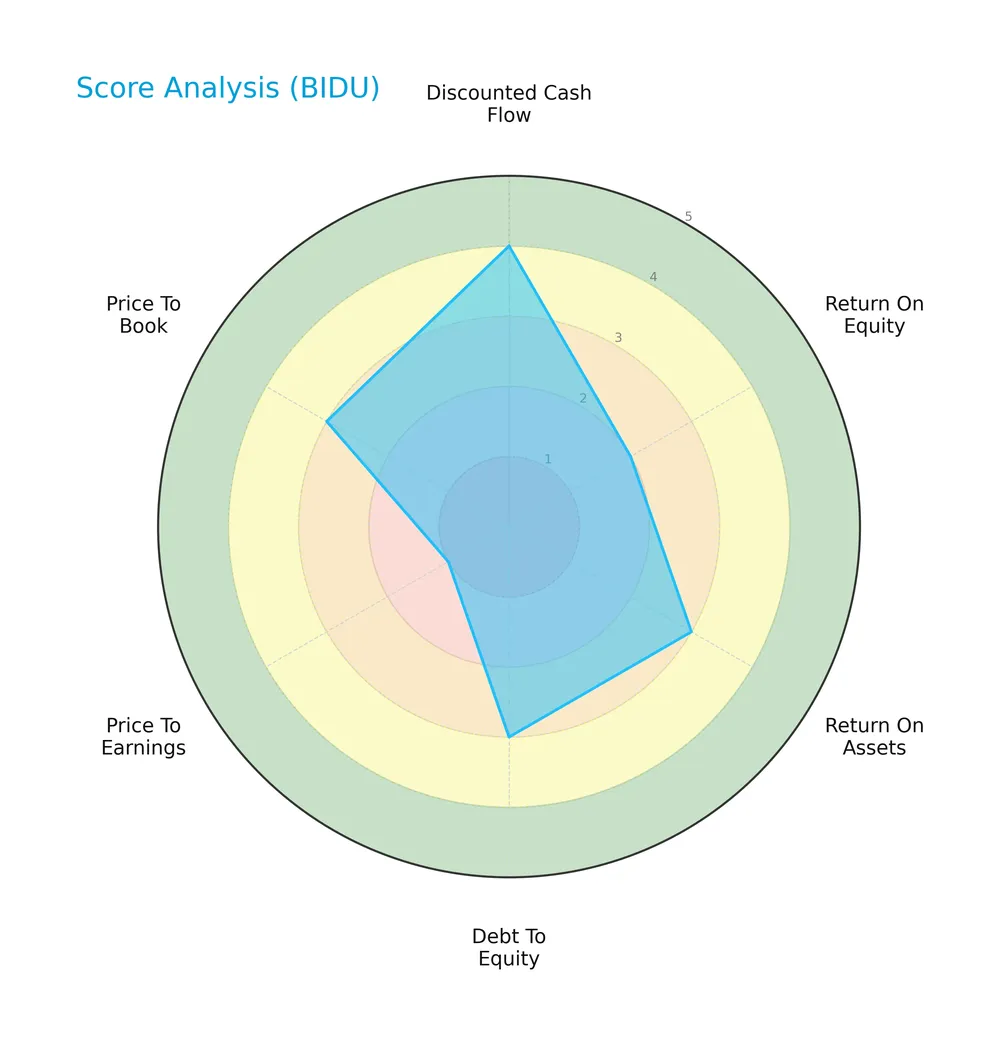
Baidu scores favorably on discounted cash flow (4) but poorly on price-to-earnings (1). Return on equity is unfavorable (2), while return on assets, debt-to-equity, and price-to-book scores are moderate (3 each). Overall, the metrics indicate mixed financial signals.
Analysis of the company’s bankruptcy risk
Baidu’s Altman Z-Score places it in the distress zone, signaling a high risk of financial distress and potential bankruptcy:

Is the company in good financial health?
The Piotroski Score diagram highlights Baidu’s very weak financial health status:

With a Piotroski Score of 2, Baidu shows limited financial strength, indicating weak profitability, leverage, and operational efficiency compared to stronger peers.
Competitive Landscape & Sector Positioning
This analysis explores Baidu, Inc.’s sector role, focusing on strategic positioning, revenue segments, and main competitors. I will assess whether Baidu holds a competitive advantage over its peers.
Strategic Positioning
Baidu focuses primarily on online marketing and cloud services within China, with limited international revenue. Its portfolio centers on two segments: Baidu Core’s search, AI, and video platforms, and iQIYI’s entertainment content, reflecting a concentrated geographic and product strategy.
Revenue by Segment
This pie chart illustrates Baidu, Inc.’s revenue breakdown by segment for fiscal year 2025, highlighting the company’s main income sources in Chinese Yuan (CNY).
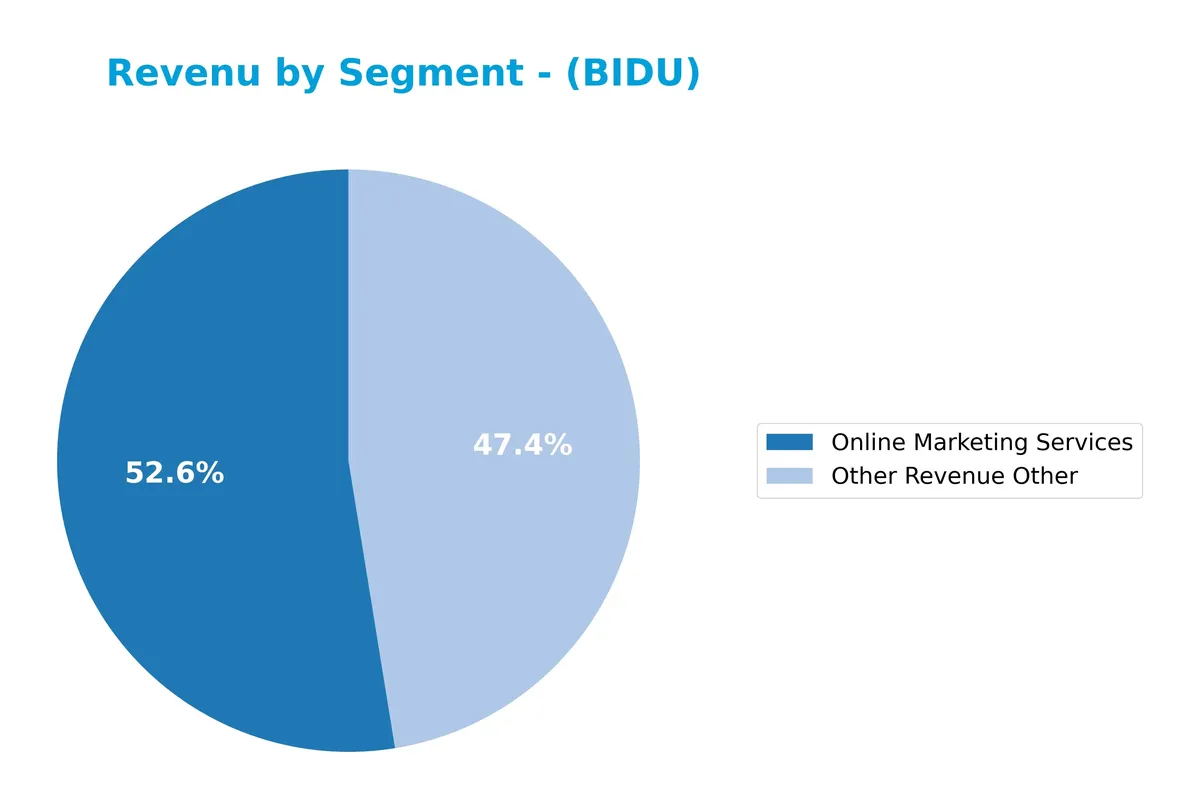
In 2025, Baidu’s Online Marketing Services generated 67.8B CNY, remaining the dominant revenue driver despite a decline from prior years. The Other Revenue category contributed 61.2B CNY, showing significant growth and narrowing the gap with marketing. This shift suggests Baidu is diversifying income streams, reducing concentration risk. However, the slowdown in Online Marketing Services signals caution amid changing market dynamics.
Key Products & Brands
Baidu’s key products and brands span online marketing, cloud services, AI, and entertainment platforms:
| Product | Description |
|---|---|
| Online Marketing Services | Search-based, feed-based, and other online marketing services targeting businesses in China. |
| Cloud Services | Cloud computing solutions supporting enterprise customers and AI-driven applications. |
| AI Initiatives | Products and services developed from Baidu’s artificial intelligence technologies. |
| Haokan | A platform for user-generated and professionally produced short videos. |
| iQIYI | An online entertainment video platform featuring original, partner-generated, and professionally produced content. |
Baidu’s product portfolio centers on digital marketing and cloud infrastructure, augmented by AI innovation and content platforms like Haokan and iQIYI. This blend supports diversified revenue streams in China’s evolving internet ecosystem.
Main Competitors
There are 6 competitors in total, with the table below listing the top 6 leaders by market capitalization:
| Competitor | Market Cap. |
|---|---|
| Alphabet Inc. | 3.8T |
| Meta Platforms, Inc. | 1.6T |
| DoorDash, Inc. | 95B |
| Baidu, Inc. | 44B |
| Twilio Inc. | 22B |
| Snap Inc. | 14B |
Baidu ranks 4th among its 6 main competitors. Its market cap is just 0.97% of the top leader, Alphabet Inc. Baidu sits below both the average market cap of the top 10 competitors (936B) and the median sector market cap (70B). It holds a 157% market cap advantage over its closest competitor above, DoorDash.
Comparisons with competitors
Check out how we compare the company to its competitors:
Does Baidu have a competitive advantage?
Baidu currently lacks a competitive advantage, as its return on invested capital (ROIC) significantly underperforms its weighted average cost of capital (WACC). The firm is destroying value with declining profitability and a very unfavorable moat status.
Looking ahead, Baidu aims to expand through AI initiatives, cloud services, and content platforms like Haokan and iQIYI. These areas offer growth potential, though recent profitability trends remain a concern for sustained competitive strength.
SWOT Analysis
This analysis highlights Baidu’s core competitive position and strategic challenges.
Strengths
- strong brand in China
- diversified services in AI and cloud
- low beta indicating stability
Weaknesses
- declining revenue growth
- negative ROIC signaling value destruction
- weak profitability margins
Opportunities
- AI and cloud market expansion
- growth in short video platforms
- monetization of iQIYI content
Threats
- intense competition from domestic rivals
- regulatory risks in China
- slowing ad market impacting core revenue
Baidu’s solid brand and AI investments offer growth potential. However, persistent profitability and growth challenges demand cautious capital allocation. Strategic focus must balance innovation with margin recovery amid fierce competition and regulatory headwinds.
Stock Price Action Analysis
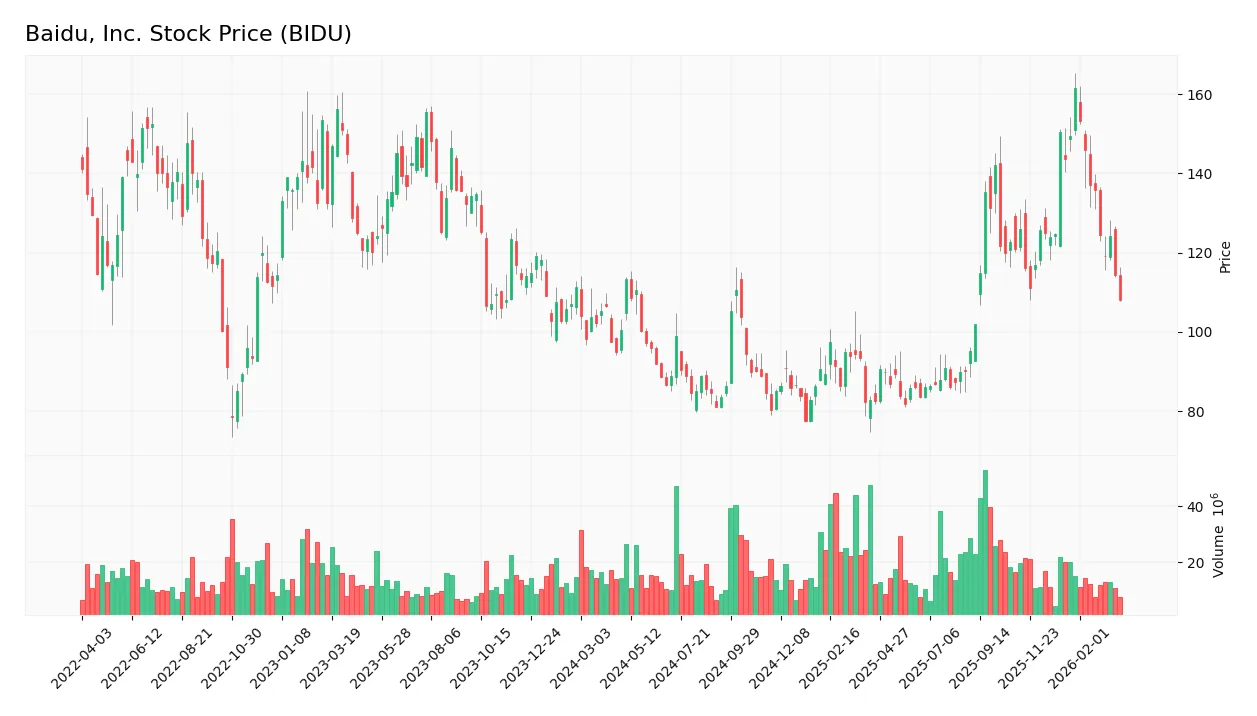
The weekly stock chart for Baidu, Inc. shows price movements over the past 12 months with key highs and lows highlighted:
Trend Analysis
Over the past 12 months, Baidu’s stock price declined by 4.66%, signaling a bearish trend. The trend shows deceleration despite a high volatility of 20.12%. The stock peaked at 161.44 and bottomed at 77.43, reflecting significant price swings but slowing downward momentum.
Volume Analysis
In the last three months, trading volumes show a seller-dominant pattern with buyer volume at 48.2M versus seller volume at 109.2M. Volume is increasing, suggesting heightened market participation but prevailing bearish sentiment among investors.
Target Prices
Analysts set a broad target price range reflecting mixed but generally optimistic expectations for Baidu, Inc.
| Target Low | Target High | Consensus |
|---|---|---|
| 110 | 215 | 156.91 |
The target prices imply upside potential above current levels, but the wide range signals uncertainty about growth and execution in a challenging tech landscape.

Don’t Let Luck Decide Your Entry Point
Optimize your entry points with our advanced ProRealTime indicators. You’ll get efficient buy signals with precise price targets for maximum performance. Start outperforming now!
Analyst & Consumer Opinions
This section examines Baidu, Inc.’s analyst ratings and consumer feedback to provide a balanced market perspective.
Stock Grades
Here are the latest verified analyst grades for Baidu, Inc., reflecting recent rating actions and consistency:
| Grading Company | Action | New Grade | Date |
|---|---|---|---|
| Barclays | Maintain | Equal Weight | 2026-03-06 |
| Susquehanna | Maintain | Neutral | 2026-03-05 |
| Barclays | Maintain | Equal Weight | 2026-01-26 |
| Freedom Capital Markets | Maintain | Buy | 2026-01-07 |
| Jefferies | Maintain | Buy | 2026-01-02 |
| JP Morgan | Upgrade | Overweight | 2025-11-24 |
| Morgan Stanley | Maintain | Equal Weight | 2025-11-19 |
| Benchmark | Maintain | Buy | 2025-11-19 |
| Barclays | Maintain | Equal Weight | 2025-11-19 |
| B of A Securities | Maintain | Buy | 2025-11-19 |
The overall trend shows stable sentiment with repeated “Buy” and “Equal Weight” ratings. Notably, JP Morgan upgraded to “Overweight,” signaling moderately increased conviction among top-tier analysts.
Consumer Opinions
Consumers show a mixed but generally optimistic sentiment toward Baidu, Inc., reflecting both appreciation for innovation and concerns over service consistency.
| Positive Reviews | Negative Reviews |
|---|---|
| “Impressed by Baidu’s AI search accuracy and speed.” | “Sometimes the interface feels cluttered and confusing.” |
| “Reliable map services with detailed local info.” | “Ads interrupt the user experience too frequently.” |
| “Strong voice recognition technology that works well.” | “Customer support response times need improvement.” |
Overall, users praise Baidu’s technological edge in AI and mapping. However, they frequently cite interface complexity and intrusive ads as notable drawbacks.
Risk Analysis
Below is a summary table outlining Baidu’s key risk factors with their likelihood and potential impact:
| Category | Description | Probability | Impact |
|---|---|---|---|
| Financial Stability | Altman Z-Score at 1.6 signals distress zone, indicating heightened bankruptcy risk. | High | High |
| Profitability | Negative ROIC (-1.2%) and low net margin (4.33%) reflect weak capital efficiency and returns. | High | Medium |
| Valuation | Elevated P/E of 77.7 suggests overvaluation relative to sector and market averages. | Medium | Medium |
| Operational Efficiency | Low asset turnover (0.29) points to underutilized assets, limiting growth potential. | Medium | Medium |
| Dividend Policy | Zero dividend yield may deter income-focused investors and signal cash flow constraints. | Medium | Low |
| Market Volatility | Low beta (0.39) implies limited price volatility, reducing market risk exposure. | Low | Low |
The most concerning risks are Baidu’s financial distress signals from the Altman Z-Score and its poor returns on invested capital. These factors suggest the company struggles to generate adequate profits from its assets, raising caution. Its sky-high valuation further amplifies downside risk. Investors must weigh these red flags against Baidu’s favorable liquidity and manageable debt levels.
Should You Buy Baidu, Inc.?
Baidu appears to be a company with declining profitability and a very unfavorable moat, indicating value destruction. While its leverage profile seems moderate, financial distress risks remain elevated. Overall, the rating suggests a cautious profile with a B classification.
Strength & Efficiency Pillars
Baidu, Inc. maintains solid operational margins, with a gross margin of 43.88% signaling strong core profitability. Interest expense remains low at 2.1%, reflecting manageable financing costs. The company’s current ratio of 1.76 demonstrates decent short-term liquidity. However, key profitability metrics reveal weakness: ROIC stands at -1.2%, well below the WACC of 5.21%, indicating Baidu is currently destroying shareholder value rather than creating it.
Weaknesses and Drawbacks
Baidu is in financial distress, with an Altman Z-Score of 1.60, signaling a high bankruptcy risk. The company’s valuation appears stretched, trading at a P/E of 77.69, which implies significant premium pricing despite deteriorating earnings. Recent trends are bearish, with a 24.68% price decline and pronounced seller dominance (buyers only 30.62% in recent activity), adding short-term market pressure. Additionally, the Piotroski score of 2 confirms very weak financial strength, raising serious concerns about the company’s fundamentals.
Our Final Verdict about Baidu, Inc.
Despite operational margins that show some resilience, Baidu’s solvency risk and value destruction make it a highly speculative profile. The Altman Z-Score within the distress zone outweighs any moderate liquidity or margin positives. Investors should approach cautiously, as Baidu might appear too risky for conservative capital and may require significant turnaround to regain stability.
Disclaimer: This content is for informational purposes only and does not constitute financial, investment, or other professional advice. Investing in financial markets involves a significant risk of loss, and past performance is not indicative of future results.
Additional Resources
- Why Baidu Inc. (BIDU) Dipped More Than Broader Market Today – Yahoo Finance (Mar 26, 2026)
- BIDU Stock Price, Quote & Chart | BAIDU INC – SPON ADR (NASDAQ:BIDU) – ChartMill (Mar 25, 2026)
- How to Buy Baidu Stock (BIDU) in 2026 – The Motley Fool (Mar 25, 2026)
- SG Americas Securities LLC Purchases 92,183 Shares of Baidu, Inc. $BIDU – MarketBeat (Mar 25, 2026)
- Baidu’s Deep Value And The Risks The Market Is Ignoring (NASDAQ:BIDU) – Seeking Alpha (Mar 23, 2026)
For more information about Baidu, Inc., please visit the official website: ir.baidu.com