Home > Analyses > Industrials > Axon Enterprise, Inc.
Axon Enterprise transforms public safety with cutting-edge technology that shapes law enforcement worldwide. Its flagship TASER devices and integrated body cameras set industry standards for innovation and reliability. The company’s cloud-based evidence management software further cements its leadership in digital policing solutions. As Axon expands its ecosystem and explores real-time crime analytics, I question whether its current valuation fully reflects the growth potential embedded in its evolving product portfolio.

Table of contents
Business Model & Company Overview
Axon Enterprise, Inc. was founded in 1993 and is headquartered in Scottsdale, Arizona. It dominates the aerospace and defense sector through a cohesive ecosystem of conducted energy devices and digital evidence management solutions. Its core products include TASER weapons, body cameras, and cloud-based software, all designed to enhance law enforcement effectiveness and accountability globally.
Axon’s revenue engine balances hardware sales with recurring software services, including digital evidence management and real-time crime center solutions. It operates across the Americas, Europe, and Asia, leveraging direct sales and distribution partnerships. The company’s competitive advantage lies in its integrated hardware-software platform, creating a strong economic moat that shapes law enforcement’s future technology landscape.
Financial Performance & Fundamental Metrics
I analyze Axon Enterprise, Inc.’s income statement, key financial ratios, and dividend payout policy to assess its profitability, efficiency, and shareholder returns.
Income Statement
The table below summarizes Axon Enterprise, Inc.’s annual income statement figures from 2021 to 2025 in USD, reflecting revenue, expenses, and profitability metrics.

| 2021 | 2022 | 2023 | 2024 | 2025 | |
|---|---|---|---|---|---|
| Revenue | 863M | 1.19B | 1.56B | 2.08B | 2.78B |
| Cost of Revenue | 332M | 461M | 605M | 841M | 1.12B |
| Operating Expenses | 698M | 635M | 796M | 1.18B | 1.72B |
| Gross Profit | 531M | 729M | 955M | 1.24B | 1.66B |
| EBITDA | -117M | 228M | 183M | 437M | -62M |
| EBIT | -141M | 197M | 164M | 389M | 0 |
| Interest Expense | 0 | 0 | 7M | 7M | -94M |
| Net Income | -60M | 147M | 176M | 377M | 125M |
| EPS | -0.91 | 2.07 | 2.37 | 4.98 | 1.6 |
| Filing Date | 2022-02-25 | 2023-02-28 | 2024-02-27 | 2025-02-28 | 2026-02-24 |
Income Statement Evolution
Axon’s revenue surged 222% from 2021 to 2025, with a strong 33% increase in the last year alone. Gross profit mirrored this growth, maintaining a favorable 59.7% margin. However, operating income collapsed to zero in 2025, causing EBIT to drop sharply. Net income growth remained positive overall but declined significantly in the most recent year, compressing net margins.
Is the Income Statement Favorable?
In 2025, Axon posted $2.78B revenue and $125M net income, yielding a modest 4.5% net margin. Despite solid gross margins, EBIT hit zero due to rising operating expenses matching revenue growth. Interest expense was favorable, yet the net margin and EPS contracted sharply year-over-year. The fundamentals show mixed signals: solid top-line growth contrasts with operating profitability pressures and margin erosion.
Financial Ratios
The table below presents key financial ratios for Axon Enterprise, Inc. over the last five fiscal years, illustrating profitability, liquidity, leverage, and valuation metrics:
| Ratios | 2021 | 2022 | 2023 | 2024 | 2025 |
|---|---|---|---|---|---|
| Net Margin | -7.0% | 12.4% | 11.3% | 18.1% | 4.5% |
| ROE | -5.7% | 11.6% | 10.9% | 16.2% | 3.8% |
| ROIC | -5.6% | 3.1% | 6.0% | 1.7% | -1.1% |
| P/E | -173.1 | 80.2 | 109.0 | 119.4 | 355.7 |
| P/B | 9.9 | 9.3 | 11.9 | 19.3 | 13.7 |
| Current Ratio | 2.7 | 3.0 | 3.1 | 1.4 | 2.5 |
| Quick Ratio | 2.4 | 2.7 | 2.8 | 1.2 | 2.3 |
| D/E | 0.02 | 0.56 | 0.44 | 0.60 | 0.59 |
| Debt-to-Assets | 1.2% | 24.9% | 20.8% | 31.3% | 27.3% |
| Interest Coverage | 0 | 0 | 22.8 | 8.2 | 0.7 |
| Asset Turnover | 0.51 | 0.42 | 0.46 | 0.47 | 0.40 |
| Fixed Asset Turnover | 6.2 | 7.0 | 6.6 | 8.4 | 8.4 |
| Dividend Yield | 0% | 0% | 0% | 0% | 0% |
Evolution of Financial Ratios
Return on Equity (ROE) declined sharply from 16.2% in 2024 to 3.8% in 2025, signaling weakening profitability. The Current Ratio improved from 1.37 in 2024 to 2.53 in 2025, indicating stronger liquidity. Debt-to-Equity Ratio remained fairly stable around 0.59, reflecting consistent leverage levels over the period.
Are the Financial Ratios Fovorable?
In 2025, liquidity ratios like the Current Ratio (2.53) and Quick Ratio (2.29) are favorable, showing solid short-term financial health. Profitability measures, including ROE (3.8%) and Net Margin (4.5%), are unfavorable and below typical sector benchmarks. Leverage ratios are neutral to favorable, but poor Asset Turnover (0.4) and Interest Coverage highlight operational and debt servicing challenges. Overall, the ratios lean toward unfavorable.
Shareholder Return Policy
Axon Enterprise, Inc. does not pay dividends, reflecting a reinvestment strategy consistent with its growth phase. The company does not engage in share buybacks either, focusing resources on operational and capital expenditures to support expansion.
This approach aligns with long-term shareholder value creation by prioritizing reinvestment over payouts. Given consistent positive net margins since 2023, Axon appears to balance growth with emerging profitability, supporting sustainable value potential.
Score analysis
The following radar chart displays Axon Enterprise, Inc.’s key financial scores for a comprehensive performance overview:

Axon’s scores reveal moderate returns on equity and assets at 3 each. However, discounted cash flow and debt-to-equity ratios show unfavorable marks at 2. Valuation metrics—price-to-earnings and price-to-book—are very unfavorable at 1, indicating valuation concerns.
Analysis of the company’s bankruptcy risk
Axon’s Altman Z-Score places it well within the safe zone, indicating a low risk of bankruptcy:

Is the company in good financial health?
The Piotroski Score chart offers insights into Axon’s financial strength based on nine criteria:
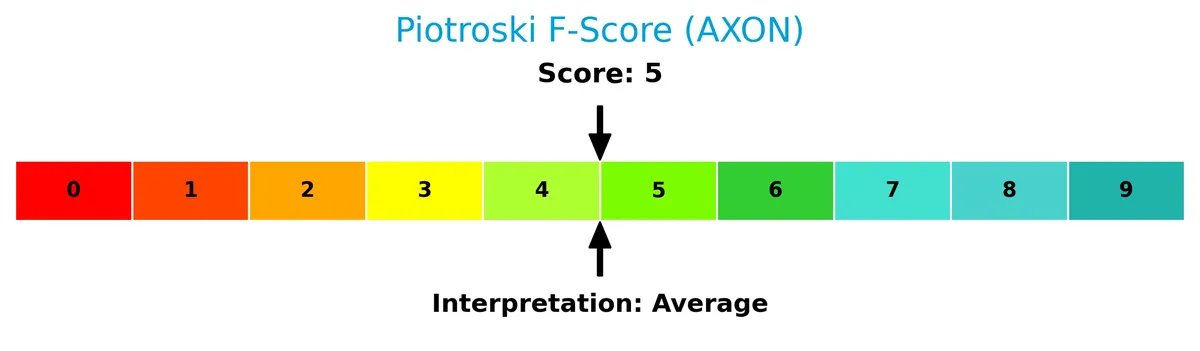
With a score of 5, Axon falls into an average financial health category, suggesting moderate financial stability but room for improvement in operational efficiency and profitability.
Competitive Landscape & Sector Positioning
This analysis explores Axon Enterprise, Inc.’s strategic position within the aerospace and defense sector. It examines revenue by segment, key products, main competitors, and competitive advantages. I will assess whether Axon holds a sustainable edge over its peers.
Strategic Positioning
Axon Enterprise concentrates on two core segments: TASER devices and Software and Sensors, with the latter growing to $951M in 2023. It maintains a strong U.S. presence, generating $1.78B in 2024, while expanding international sales to $307M, reflecting measured geographic diversification.
Revenue by Segment
This pie chart illustrates Axon Enterprise, Inc.’s revenue breakdown by segment for the fiscal year 2023, highlighting key product lines and their contributions.

Software and Sensors lead Axon’s revenue with $951M in 2023, reflecting robust growth from $426M in 2021. TASER revenue also grew steadily to $613M. The shift toward software indicates Axon’s strategic pivot to recurring, higher-margin offerings, reducing reliance on hardware sales. This trend signals accelerating revenue concentration in software and sensors, underscoring a transformative phase in Axon’s business model.
Key Products & Brands
Axon Enterprise, Inc. offers a range of hardware and software products for law enforcement and public safety applications:
| Product | Description |
|---|---|
| TASER Devices | Conducted energy devices including TASER 7, TASER X26P, TASER X2, and consumer models with cartridges. |
| Body Cameras | On-officer body cameras designed to capture video evidence in real time. |
| Axon Fleet | In-car video systems for law enforcement vehicles. |
| Axon Evidence | Cloud-based digital evidence management software for secure storage and analysis of video and data. |
| Axon Signal Enabled Devices | Devices integrated with Axon Signal technology for enhanced situational awareness. |
| Hardware Accessories | Docks, cartridges, batteries, and extended hardware warranties. |
Axon’s portfolio combines physical safety devices with sophisticated software, reflecting its shift from traditional weapons to integrated digital solutions. This dual-segment approach drives diversified revenue streams.
Main Competitors
There are 12 competitors in the Aerospace & Defense industry; this table lists the top 10 leaders by market capitalization:
| Competitor | Market Cap. |
|---|---|
| GE Aerospace | 338B |
| RTX Corporation | 251B |
| The Boeing Company | 171B |
| Lockheed Martin Corporation | 116B |
| General Dynamics Corporation | 93B |
| Northrop Grumman Corporation | 84B |
| TransDigm Group Incorporated | 77B |
| L3Harris Technologies, Inc. | 57B |
| Axon Enterprise, Inc. | 44B |
| BWX Technologies, Inc. | 17B |
Axon Enterprise ranks 9th among its 12 competitors. Its market cap represents just 10.3% of the leader, GE Aerospace. Axon falls below both the average market cap of the top 10 competitors (125B) and the sector median (80B). It maintains a notable 63% gap above its nearest competitor, BWX Technologies.
Comparisons with competitors
Check out how we compare the company to its competitors:
Does Axon have a competitive advantage?
Axon currently does not demonstrate a strong competitive advantage, as its ROIC lags behind its WACC, indicating value destruction despite improving profitability. Its aerospace and defense industry presence is supported by diversified product lines but lacks a clear economic moat.
Looking ahead, Axon’s expansion into cloud-based software and real-time crime center solutions presents growth opportunities. Strategic partnerships and innovation in digital evidence management could enhance its market position and operational efficiency.
SWOT Analysis
This analysis identifies Axon Enterprise’s key strengths, weaknesses, opportunities, and threats to inform strategic decisions.
Strengths
- strong revenue growth
- leading TASER brand
- robust current and quick ratios
Weaknesses
- negative ROIC vs. WACC
- low net and EBIT margins
- high valuation multiples (PE and PB)
Opportunities
- expanding software and sensor segment
- growing international sales
- strategic partnerships enhancing tech
Threats
- intense competition in defense tech
- regulatory scrutiny on use-of-force products
- market volatility affecting high-beta stock
Axon shows robust top-line growth and solid liquidity but struggles with profitability and value creation. The company must leverage tech innovation and global expansion while managing competitive and regulatory risks.
Stock Price Action Analysis
The weekly stock price chart of Axon Enterprise, Inc. highlights key movements and volatility patterns over the analyzed period:

Trend Analysis
Over the past 12 months, Axon’s stock price rose 42.79%, indicating a bullish trend with decelerating momentum. The price fluctuated between a low of 280.5 and a high of 842.5. Recent data from mid-December 2025 to early March 2026 shows a -21.58% decline, signaling a short-term bearish correction.
Volume Analysis
Trading volume over the last three months shows buyer dominance at 60.05%, with volume increasing. This buyer-driven activity suggests growing investor interest despite recent price declines, indicating cautious optimism and active market participation in Axon shares.
Target Prices
Analysts project a solid upside for Axon Enterprise, Inc., reflecting confidence in its growth trajectory.
| Target Low | Target High | Consensus |
|---|---|---|
| 713 | 860 | 767 |
The target range suggests a bullish outlook, with consensus indicating a potential 10-15% gain from current levels.

Don’t Let Luck Decide Your Entry Point
Optimize your entry points with our advanced ProRealTime indicators. You’ll get efficient buy signals with precise price targets for maximum performance. Start outperforming now!
Analyst & Consumer Opinions
This section examines Axon Enterprise, Inc.’s analyst ratings and consumer feedback to provide a balanced perspective.
Stock Grades
The latest verified analyst ratings for Axon Enterprise, Inc. reveal a consistent pattern of confidence among top firms:
| Grading Company | Action | New Grade | Date |
|---|---|---|---|
| Needham | Maintain | Buy | 2026-02-20 |
| Morgan Stanley | Maintain | Overweight | 2025-12-17 |
| Barclays | Maintain | Overweight | 2025-11-06 |
| Goldman Sachs | Maintain | Buy | 2025-11-05 |
| Piper Sandler | Maintain | Overweight | 2025-11-05 |
| UBS | Maintain | Neutral | 2025-11-05 |
| JMP Securities | Maintain | Market Outperform | 2025-09-29 |
| Needham | Maintain | Buy | 2025-09-24 |
| B of A Securities | Maintain | Buy | 2025-08-06 |
| Raymond James | Maintain | Outperform | 2025-08-05 |
Overall, the consensus leans strongly toward buying or outperforming Axon, with no downgrades or sell ratings recorded recently. Neutral stances remain in the minority, underscoring broad analyst confidence.
Consumer Opinions
Consumers express a mix of enthusiasm and caution toward Axon Enterprise, Inc., reflecting its innovative edge and occasional service challenges.
| Positive Reviews | Negative Reviews |
|---|---|
| “Axon’s technology significantly improves public safety.” | “Customer support response times can be slow.” |
| “Their products are reliable and easy to use.” | “Pricing feels steep for smaller agencies.” |
| “Innovative features keep us ahead in law enforcement.” | “Occasional software glitches disrupt operations.” |
Overall, consumers praise Axon for its cutting-edge technology and reliability. However, recurring concerns about customer service and cost highlight areas needing attention.
Risk Analysis
Below is a concise overview of key risks facing Axon Enterprise, Inc., categorized by type, likelihood, and potential impact:
| Category | Description | Probability | Impact |
|---|---|---|---|
| Financial | Negative ROIC (-1.11%) versus WACC (10.23%) signals value destruction risk. | High | High |
| Valuation | Extremely high P/E (356) and P/B (13.68) suggest overvaluation risk. | High | Medium |
| Profitability | Low net margin (4.48%) and ROE (3.84%) weaken earnings resilience. | Medium | Medium |
| Liquidity | Strong current (2.53) and quick (2.29) ratios improve short-term stability. | Low | Low |
| Debt & Solvency | Moderate debt-to-equity (0.59) and favorable debt-to-assets (27.28%) ratios. | Medium | Low |
| Operational | Low asset turnover (0.4) may limit growth efficiency. | Medium | Medium |
| Market Volatility | Beta of 1.48 indicates sensitivity to market swings. | High | Medium |
| Dividend Policy | No dividend yield, limiting income appeal for some investors. | Low | Low |
The most concerning risks are Axon’s negative ROIC against a high WACC and stretched valuation multiples. These highlight capital allocation inefficiencies and a potential correction. Despite this, the company maintains solid liquidity and a strong Altman Z-Score (6.59), signaling low bankruptcy risk. Investors must weigh growth prospects against significant valuation and profitability headwinds in 2026.
Should You Buy Axon Enterprise, Inc.?
Analytically, Axon appears to be improving profitability amid a slightly unfavorable moat marked by value destruction. Despite a manageable leverage profile and a safe-zone Altman Z-score, its overall rating of C+ suggests cautious consideration within a mixed financial health context.
Strength & Efficiency Pillars
Axon Enterprise, Inc. operates with a stable gross margin of 59.65%, reflecting strong operational efficiency. Despite an unfavorable net margin of 4.48% and a negative ROIC of -1.11% against a WACC of 10.23%, the company benefits from a solid current ratio of 2.53 and a quick ratio of 2.29, indicating liquidity strength. Its fixed asset turnover at 8.4 further signals effective use of long-term assets. The Altman Z-Score at 6.59 places Axon securely in the safe zone, underscoring financial stability.
Weaknesses and Drawbacks
Axon faces significant valuation concerns with an extremely high P/E ratio of 355.74 and a P/B ratio of 13.68, suggesting the stock trades at a premium that may not be justified by earnings. The company’s interest coverage is effectively zero, hinting at potential challenges servicing debt costs despite a moderate debt-to-equity ratio of 0.59. Low ROE at 3.84% and a declining net margin growth (-75.23% over one year) highlight profitability pressures. These factors raise caution amid a decelerating bullish trend.
Our Final Verdict about Axon Enterprise, Inc.
Axon’s long-term fundamentals show operational resilience and financial safety, supported by a robust Altman Z-Score and sound liquidity. However, the recent deceleration in stock price (-21.58%) and elevated valuation multiples suggest caution. Despite the overall bullish trend, the profile may appear overextended. Investors might consider a wait-and-see approach to identify a more attractive entry point amid current market pressures.
Disclaimer: This content is for informational purposes only and does not constitute financial, investment, or other professional advice. Investing in financial markets involves a significant risk of loss, and past performance is not indicative of future results.
Additional Resources
- Axon reports Q4 2025 revenue of $797 million, up 39% year over year – PR Newswire (Feb 24, 2026)
- Axon Stock Q4 Earnings: The Panic Ends (NASDAQ:AXON) – Seeking Alpha (Feb 25, 2026)
- Axon Enterprise, Inc. Reports Decline In Q4 Bottom Line – Nasdaq (Feb 24, 2026)
- Axon Enterprise Q4 Earnings Call Highlights – Yahoo Finance (Feb 25, 2026)
- Axon stock surges after revealing AI products and strong revenue growth – The Business Journals (Feb 25, 2026)
For more information about Axon Enterprise, Inc., please visit the official website: axon.com