Home > Analyses > Industrials > Avery Dennison Corporation
Avery Dennison transforms everyday products with pressure-sensitive materials that touch millions globally. Its leadership spans label and graphic solutions, retail branding, and industrial adhesives, powering sectors from pharmaceuticals to automotive. Renowned for innovation and quality, Avery Dennison constantly reshapes packaging and brand identity standards. As market dynamics evolve, I ask whether Avery Dennison’s robust fundamentals still justify its premium valuation and growth prospects in 2026.

Table of contents
Business Model & Company Overview
Avery Dennison Corporation, founded in 1935 and headquartered in Glendale, California, commands a leading position in the Business Equipment & Supplies industry. It delivers a cohesive ecosystem of pressure-sensitive materials and innovative brand solutions across multiple sectors. Its portfolio spans label and graphic materials, retail branding, and industrial healthcare products, all unified by a core mission to enhance product identification and brand visibility worldwide.
The company’s revenue engine balances hardware-like materials with high-value recurring services such as creative branding and RFID solutions. Avery Dennison leverages its strategic footprint across the Americas, Europe, and Asia to serve diverse markets from pharmaceuticals to automotive. Its competitive advantage lies in deep customer integration and a broad product suite, establishing a durable economic moat that shapes the future of global labeling and packaging industries.
Financial Performance & Fundamental Metrics
I analyze Avery Dennison Corporation’s income statement, key financial ratios, and dividend payout policy to assess its profitability, efficiency, and shareholder returns.
Income Statement
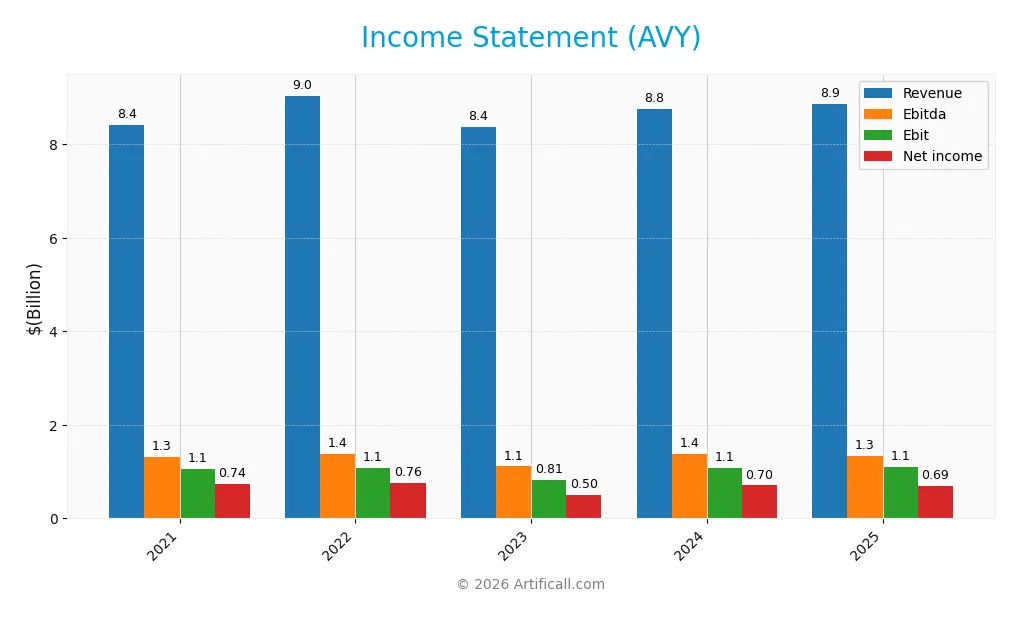
The table below summarizes Avery Dennison Corporation’s key income statement figures for fiscal years 2021 through 2025, reported in USD.
| 2021 | 2022 | 2023 | 2024 | 2025 | |
|---|---|---|---|---|---|
| Revenue | 8.41B | 9.04B | 8.36B | 8.76B | 8.86B |
| Cost of Revenue | 6.10B | 6.64B | 6.09B | 6.23B | 6.31B |
| Operating Expenses | 1.27B | 1.33B | 1.32B | 1.40B | 1.44B |
| Gross Profit | 2.31B | 2.40B | 2.27B | 2.53B | 2.55B |
| EBITDA | 1.31B | 1.37B | 1.11B | 1.38B | 1.34B |
| EBIT | 1.06B | 1.08B | 814M | 1.07B | 1.10B |
| Interest Expense | 70.2M | 84.1M | 119M | 117M | 135M |
| Net Income | 740M | 757M | 503M | 705M | 688M |
| EPS | 8.93 | 9.28 | 6.23 | 8.73 | 8.80 |
| Filing Date | 2022-02-23 | 2023-02-22 | 2024-02-21 | 2025-02-26 | 2026-02-25 |
Income Statement Evolution
From 2021 to 2025, Avery Dennison’s revenue exhibited modest growth of 5.3%, slowing to 1.1% in the latest year. Net income declined by 7%, reflecting margin pressures. Gross margin remained stable near 29%, while EBIT margin slightly improved to 12.4%. However, net margin contracted by nearly 12%, indicating rising costs or lower operational leverage.
Is the Income Statement Favorable?
The 2025 income statement shows stable gross and EBIT margins, supporting solid core profitability. Interest expense is well contained at 1.5% of revenue, which is favorable. Yet, net income fell 3.5% year-over-year, driven by a shrinking net margin of 7.8%. Overall, the fundamentals reflect operational resilience but margin erosion suggests caution in earnings quality.
Financial Ratios
The table below summarizes key financial ratios for Avery Dennison Corporation (AVY) over the past five fiscal years, providing insight into profitability, valuation, liquidity, leverage, and efficiency:
| Ratios | 2021 | 2022 | 2023 | 2024 | 2025 |
|---|---|---|---|---|---|
| Net Margin | 8.8% | 8.4% | 6.0% | 8.1% | 7.8% |
| ROE | 38.5% | 37.3% | 23.6% | 30.5% | 30.7% |
| ROIC | 13.6% | 14.1% | 11.3% | 13.6% | 12.3% |
| P/E | 24.3 | 19.5 | 32.4 | 21.5 | 20.5 |
| P/B | 9.3 | 7.3 | 7.7 | 6.6 | 6.3 |
| Current Ratio | 1.07 | 0.99 | 1.04 | 1.08 | 1.13 |
| Quick Ratio | 0.72 | 0.63 | 0.69 | 0.73 | 0.76 |
| D/E | 1.61 | 1.53 | 1.52 | 1.36 | 1.66 |
| Debt-to-Assets | 39% | 39% | 40% | 38% | 42% |
| Interest Coverage | 14.8 | 12.7 | 8.0 | 9.6 | 8.2 |
| Asset Turnover | 1.05 | 1.14 | 1.02 | 1.04 | 1.01 |
| Fixed Asset Turnover | 5.69 | 5.87 | 5.14 | 5.52 | 5.51 |
| Dividend Yield | 1.23% | 1.62% | 1.57% | 1.83% | 2.05% |
Evolution of Financial Ratios
From 2021 to 2025, Avery Dennison’s Return on Equity (ROE) showed a slight decline but remained strong, ending at 30.7%. The Current Ratio improved modestly from around 1.07 to 1.13, signaling stable liquidity. However, the Debt-to-Equity Ratio rose to 1.66 in 2025, indicating increased leverage over the period. Profitability margins held relatively stable.
Are the Financial Ratios Favorable?
In 2025, profitability indicators such as ROE (30.7%) and Return on Invested Capital (12.3%) outperformed the weighted average cost of capital (7.15%), signaling efficient capital use. Liquidity ratios were mixed; Current Ratio was neutral at 1.13, but Quick Ratio was unfavorable at 0.76. Leverage ratios, including Debt-to-Equity at 1.66, also appeared unfavorable. Market valuation showed a neutral P/E of 20.46 and an unfavorable price-to-book ratio near 6.3. Overall, the ratio profile is slightly favorable.
Shareholder Return Policy
Avery Dennison maintains a consistent dividend policy with a payout ratio near 42% and a dividend yield around 2%. Dividends per share have steadily increased over recent years, supported by free cash flow coverage above 80%. The company also engages in share buybacks.
This balanced approach supports sustainable long-term value creation by returning capital without compromising financial flexibility. Coverage ratios and incremental dividends suggest prudent capital allocation, though continued monitoring of leverage levels remains essential.
Score analysis
The following radar chart displays key financial scores evaluating Avery Dennison Corporation’s current investment appeal:

Avery Dennison’s scores show strong return on equity (5) and favorable return on assets (4). Discounted cash flow and price-to-earnings scores are moderate (3 each). However, debt-to-equity and price-to-book scores are very unfavorable (1 each), indicating leverage and valuation concerns.
Analysis of the company’s bankruptcy risk
The Altman Z-Score places Avery Dennison in the safe zone, suggesting a low probability of bankruptcy risk at present:

Is the company in good financial health?
This Piotroski Score diagram illustrates Avery Dennison’s financial strength based on nine key criteria:

A score of 7 classifies the company as financially strong, reflecting solid profitability, liquidity, and operational efficiency despite some areas requiring caution.
Competitive Landscape & Sector Positioning
This section examines Avery Dennison Corporation’s strategic position within the Industrials sector. I will analyze revenue by segment, key products, and main competitors. I aim to determine whether Avery Dennison holds a competitive advantage over its peers.
Strategic Positioning
Avery Dennison maintains a diversified product portfolio across three main segments: Label and Graphic Materials, Retail Branding and Information Solutions, and Industrial and Healthcare Materials. Its geographic exposure spans the United States, Europe, Asia, Latin America, and other international markets, balancing mature and emerging economies.
Revenue by Segment
The pie chart illustrates Avery Dennison’s revenue distribution by segment for the fiscal year 2024, highlighting the company’s primary business drivers.

In 2024, Avery Dennison’s Label And Graphic Materials segment generated 6B, dominating the revenue mix. The Retail Branding And Information Solutions segment contributed 2.7B, showing steady growth. These two segments drive the business with strong, consistent performance. The 2025 data shows negative values, signaling possible reporting anomalies or divestitures. Overall, the company remains concentrated in its core labeling and branding solutions, with no emerging segments altering the mix significantly.
Key Products & Brands
The table below outlines Avery Dennison Corporation’s principal products and brands across its core business segments:
| Product | Description |
|---|---|
| Label and Graphic Materials Segment | Pressure-sensitive label and packaging materials; graphics and reflective products under Fasson, JAC, Avery Dennison, and Mactac brands. Serves markets including food, beverage, pharmaceuticals, and automotive. |
| Retail Branding and Information Solutions Segment | Brand embellishments, graphic tickets, tags, labels, sustainable packaging, RFID products, price ticketing, brand protection, and security solutions for retailers and brand owners. |
| Industrial and Healthcare Materials Segment | Tapes, pressure-sensitive adhesive materials, medical fasteners, and performance polymers under Fasson, Avery Dennison, and Yongle brands, serving automotive, electronics, medical, and industrial markets. |
Avery Dennison’s product portfolio spans pressure-sensitive materials and branding solutions, supported by a diverse brand lineup. Its offerings address multiple industries, reinforcing its broad market reach.
Main Competitors
Avery Dennison Corporation faces competition from 89 companies in its sector, with the table listing the top 10 leaders by market capitalization:
| Competitor | Market Cap. |
|---|---|
| GE Aerospace | 338B |
| Caterpillar Inc. | 280B |
| RTX Corporation | 251B |
| The Boeing Company | 171B |
| Union Pacific Corporation | 138B |
| Eaton Corporation plc | 127B |
| Deere & Company | 126B |
| Honeywell International Inc. | 124B |
| Lockheed Martin Corporation | 116B |
| Parker-Hannifin Corporation | 114B |
Avery Dennison ranks 67th among 89 competitors, with a market cap just 4.4% the size of the sector leader, GE Aerospace. The company sits below both the average market cap of the top 10 (179B) and the median market cap for the sector (36B). It maintains a 2.95% gap above its nearest competitor, indicating a modest but clear distance in scale.
Comparisons with competitors
Check out how we compare the company to its competitors:
Aucun article trouvé pour ces critères.
Does AVY have a competitive advantage?
Avery Dennison demonstrates a competitive advantage with an ROIC exceeding its WACC by 5.16%, indicating value creation despite a declining profitability trend. The firm maintains a slightly favorable moat, reflecting efficient capital use but facing pressure on returns.
Looking ahead, Avery Dennison’s diversified product lines and global presence across key markets like the U.S., Europe, and Asia support growth opportunities. Its innovation in sustainable packaging and RFID solutions positions the company to capture emerging demand in branding and industrial segments.
SWOT Analysis
This SWOT analysis highlights Avery Dennison Corporation’s strategic position by identifying core strengths, weaknesses, opportunities, and threats.
Strengths
- strong ROE at 30.7%
- consistent value creation with ROIC > WACC
- diversified global revenue base
Weaknesses
- declining ROIC trend
- unfavorable net income growth over 5 years
- elevated debt-to-equity ratio at 1.66
Opportunities
- expansion in emerging markets
- innovation in sustainable packaging
- growth in healthcare materials segment
Threats
- rising raw material costs
- competitive pressures in labeling industry
- currency fluctuations impacting international sales
Avery Dennison combines solid profitability with global reach, but its declining profitability and leverage pose risks. Strategic focus on innovation and emerging markets can drive growth while managing debt and cost pressures remains critical.
Stock Price Action Analysis
The weekly stock chart for Avery Dennison Corporation (AVY) highlights price movements and volatility over the past 12 months:

Trend Analysis
Over the past 12 months, AVY’s stock price declined by 11.61%, indicating a bearish trend. The trend shows acceleration with notable volatility at a 19.92% standard deviation. The highest price reached 227.59, while the lowest fell to 158.67, confirming significant downward momentum.
Volume Analysis
Trading volumes have increased overall, with sellers slightly dominating historically at 51.19%. However, the last three months exhibit a buyer-dominant pattern at 64.68%. This shift suggests growing investor confidence and stronger market participation favoring buying activity.
Target Prices
Analysts set a firm target consensus for Avery Dennison Corporation, reflecting confidence in its growth prospects.
| Target Low | Target High | Consensus |
|---|---|---|
| 200 | 234 | 221 |
The target range from 200 to 234 suggests moderate upside potential. The consensus at 221 signals steady market optimism.

Don’t Let Luck Decide Your Entry Point
Optimize your entry points with our advanced ProRealTime indicators. You’ll get efficient buy signals with precise price targets for maximum performance. Start outperforming now!
Analyst & Consumer Opinions
This section examines Avery Dennison Corporation’s analyst ratings and consumer feedback to assess market sentiment and reputation.
Stock Grades
Here is the latest verified grading summary for Avery Dennison Corporation from leading financial institutions:
| Grading Company | Action | New Grade | Date |
|---|---|---|---|
| JP Morgan | Maintain | Overweight | 2026-02-09 |
| Citigroup | Maintain | Neutral | 2026-02-06 |
| BMO Capital | Maintain | Outperform | 2026-02-06 |
| UBS | Maintain | Buy | 2026-02-05 |
| Truist Securities | Maintain | Buy | 2026-01-06 |
| Citigroup | Maintain | Neutral | 2026-01-06 |
| Argus Research | Upgrade | Buy | 2025-10-28 |
| JP Morgan | Upgrade | Overweight | 2025-10-23 |
| UBS | Upgrade | Buy | 2025-10-23 |
| Truist Securities | Maintain | Buy | 2025-10-13 |
The consensus reflects consistent positive sentiment with upgrades across several firms in late 2025 and stable high ratings into early 2026. Buy and outperform grades dominate, signaling broad analyst confidence.
Consumer Opinions
Consumer sentiment around Avery Dennison Corporation (AVY) reveals a mixed but generally positive view of the brand’s products and services.
| Positive Reviews | Negative Reviews |
|---|---|
| “High-quality materials that last long.” | “Customer service response times need improvement.” |
| “Innovative packaging solutions that boost efficiency.” | “Pricing is higher compared to competitors.” |
| “Reliable supply chain with consistent delivery.” | “Limited product customization options.” |
Overall, consumers praise Avery Dennison’s product durability and innovation. However, concerns about customer service and pricing recur frequently, suggesting areas for management to address.
Risk Analysis
The following table summarizes key risks Avery Dennison faces, assessing their likelihood and potential impact:
| Category | Description | Probability | Impact |
|---|---|---|---|
| Financial Leverage | High debt-to-equity ratio (1.66) increases financial strain. | Medium | Medium |
| Liquidity | Quick ratio at 0.76 signals possible short-term cash issues. | Medium | Medium |
| Valuation | Elevated price-to-book ratio (6.28) suggests overvaluation. | Medium | Medium |
| Market Volatility | Beta near 1 reflects sensitivity to market swings. | High | Medium |
| Industry Cyclicality | Exposure to cyclical industrial demand may reduce sales. | Medium | High |
Avery Dennison’s leverage and liquidity present moderate risks amid a stable Altman Z-score of 3.7, indicating low bankruptcy risk. However, the elevated valuation multiples warrant caution. Market volatility remains the most likely risk, as its beta nears unity, exposing the stock to broader economic swings.
Should You Buy Avery Dennison Corporation?
Avery Dennison appears to be a moderately profitable company with a slightly favorable moat, as its ROIC exceeds WACC despite a declining trend. While operational efficiency suggests value creation, its leverage profile could be seen as substantial, warranting caution. The overall rating is B, reflecting a balanced but cautious investment profile.
Strength & Efficiency Pillars
Avery Dennison Corporation exhibits solid profitability with a favorable ROE of 30.69% and an ROIC of 12.31%. Importantly, its ROIC exceeds the WACC of 7.15%, marking it as a clear value creator. Margins remain stable, with a net margin of 7.77% and an EBIT margin of 12.39%, reflecting efficient core operations. The company’s interest coverage ratio at 8.1 and strong asset turnover ratios further support operational efficiency and effective capital deployment.
Weaknesses and Drawbacks
Avery Dennison faces valuation challenges; its price-to-book ratio stands at an unfavorable 6.28, indicating a potentially expensive equity relative to book value. Leverage is a concern, with a debt-to-equity ratio of 1.66 flagged as unfavorable, raising financial risk. The quick ratio at 0.76 suggests liquidity constraints, which could pressure short-term obligations. Although the Altman Z-Score at 3.71 places the company safely outside distress, the bearish overall stock trend and moderate P/E of 20.46 warrant cautious attention.
Our Final Verdict about Avery Dennison Corporation
Avery Dennison’s financial fundamentals appear solid, supported by strong profitability and a safe solvency profile. Despite a bearish long-term stock trend, recent buyer dominance with 64.68% suggests potential positive momentum. The profile may appear attractive for long-term exposure but warrants a measured approach given valuation and leverage concerns. Investors could consider monitoring for improved market trends before committing capital.
Disclaimer: This content is for informational purposes only and does not constitute financial, investment, or other professional advice. Investing in financial markets involves a significant risk of loss, and past performance is not indicative of future results.
Additional Resources
- Avery Dennison Corp SEC 10-K Report – TradingView (Feb 25, 2026)
- Equitable Trust Co. Takes $903,000 Position in Avery Dennison Corporation $AVY – MarketBeat (Feb 24, 2026)
- Can Avery Dennison’s (AVY) Resilient Margins and Cash Flows Reframe Its Long-Term Investment Narrative? – simplywall.st (Feb 23, 2026)
- Avery Dennison Corporation (AVY): A Bull Case Theory – Yahoo Finance (Feb 02, 2026)
- Avery Dennison Announces Upcoming Investor Events – Business Wire (Feb 11, 2026)
For more information about Avery Dennison Corporation, please visit the official website: averydennison.com