Home > Analyses > Real Estate > AvalonBay Communities, Inc.
AvalonBay Communities, Inc. transforms urban living by crafting vibrant apartment communities across key U.S. metros. With a portfolio spanning 291 properties and over 86,000 homes, it sets high standards in residential real estate through strategic development and management. Renowned for its innovation and quality, AvalonBay shapes how thousands experience city life daily. As market dynamics evolve, I question whether its core fundamentals continue to support its premium valuation and growth trajectory.

Table of contents
Business Model & Company Overview
AvalonBay Communities, Inc., founded in 1994 and headquartered in Arlington, VA, stands as a leading equity REIT specializing in residential real estate. It owns or holds interests in 291 apartment communities totaling 86K homes across 11 states and the District of Columbia. The company’s portfolio spans core markets like New England, New York/New Jersey, and California, plus expanding hubs in Southeast Florida and Denver. Its integrated approach combines development, redevelopment, acquisition, and management into a cohesive platform focused on high-demand metropolitan areas.
AvalonBay’s revenue engine balances rental income from its large-scale residential assets with ongoing redevelopment projects driving future growth. The firm’s footprint in key U.S. regions secures diversified cash flow streams from stable, recurring rents. This geographic mix offers resilience against localized downturns. The company’s competitive advantage lies in its scale and market positioning, which create barriers to entry and support premium pricing power, positioning it as a durable industry leader shaping the future of urban living.
Financial Performance & Fundamental Metrics
I analyze AvalonBay Communities, Inc.’s income statement, key financial ratios, and dividend payout policy to assess its core financial health and shareholder returns.
Income Statement
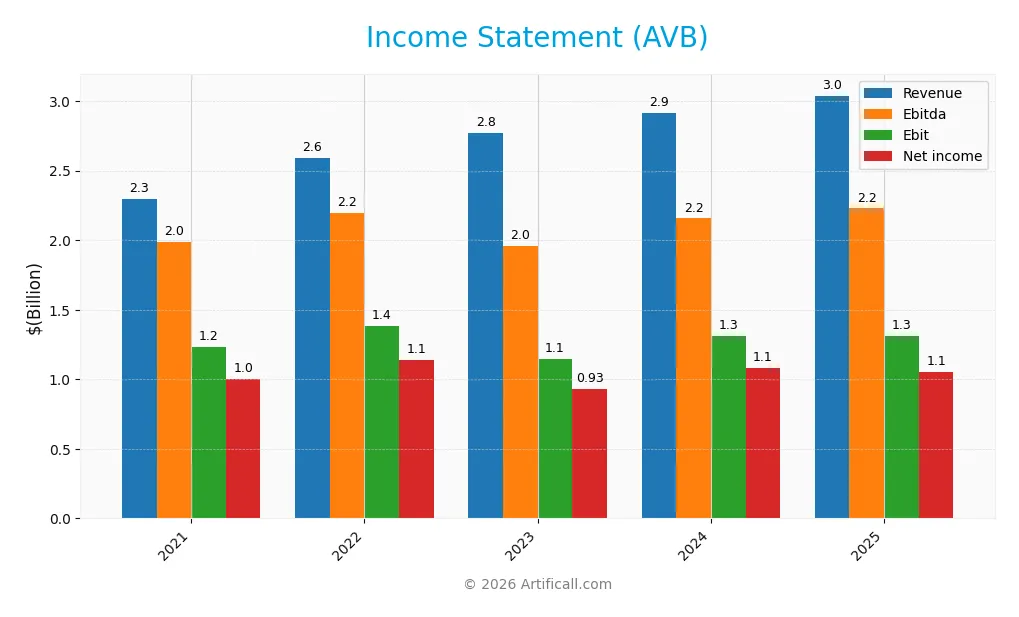
The table below summarizes AvalonBay Communities, Inc.’s key income statement figures over the past five fiscal years, highlighting revenue, profitability, and earnings per share trends.
| 2021 | 2022 | 2023 | 2024 | 2025 | |
|---|---|---|---|---|---|
| Revenue | 2.29B | 2.59B | 2.77B | 2.91B | 3.04B |
| Cost of Revenue | 854M | 919M | 988M | 1.07B | 1.00B |
| Operating Expenses | 828M | 889M | 893M | 925M | 1.12B |
| Gross Profit | 1.44B | 1.67B | 1.78B | 1.84B | 2.04B |
| EBITDA | 1.99B | 2.20B | 1.96B | 2.16B | 2.23B |
| EBIT | 1.23B | 1.38B | 1.14B | 1.31B | 1.31B |
| Interest Expense | 220M | 230M | 206M | 227M | 259M |
| Net Income | 1.00B | 1.14B | 929M | 1.08B | 1.05B |
| EPS | 7.19 | 8.13 | 6.57 | 7.61 | 7.40 |
| Filing Date | 2022-02-25 | 2023-02-24 | 2024-02-23 | 2025-02-27 | 2026-02-27 |
Income Statement Evolution
AvalonBay Communities, Inc. saw revenue rise steadily by 32% from 2021 to 2025, with a modest 4.3% increase in the last year. Gross profit expanded faster than revenue, improving margins to nearly 67%. However, net margin declined over the period, slipping 21%, signaling margin pressure despite stable EBIT growth and operational leverage.
Is the Income Statement Favorable?
In 2025, AVB delivered a 3B revenue and a 1.05B net income, reflecting a solid 34.6% net margin, which remains favorable against industry norms. EBITDA and EBIT margins also stayed robust at 73.4% and 43.3%. Still, net income and EPS dipped slightly year-over-year, suggesting moderate headwinds. Interest expense held steady, posing no immediate risk. Overall, fundamentals appear favorable but with caution on margin erosion.
Financial Ratios
The table below presents key financial ratios for AvalonBay Communities, Inc. over the last five fiscal years, offering insight into profitability, liquidity, leverage, and market valuation:
| Ratios | 2021 | 2022 | 2023 | 2024 | 2025 |
|---|---|---|---|---|---|
| Net Margin | 44% | 44% | 34% | 37% | 35% |
| ROE | 9.2% | 10.1% | 7.9% | 9.1% | 8.9% |
| ROIC | 3.2% | 3.9% | 4.4% | 4.5% | 4.3% |
| P/E | 35.1 | 19.8 | 28.5 | 28.9 | 24.3 |
| P/B | 3.22 | 2.00 | 2.25 | 2.62 | 2.16 |
| Current Ratio | 0.91 | 1.11 | 0.76 | 0.36 | 0.25 |
| Quick Ratio | 0.91 | 1.11 | 0.76 | 0.36 | 0.25 |
| D/E | 0.76 | 0.75 | 0.69 | 0.69 | 0.79 |
| Debt-to-Assets | 42% | 41% | 39% | 39% | 42% |
| Interest Coverage | 2.78 | 3.41 | 4.30 | 4.04 | 3.53 |
| Asset Turnover | 0.12 | 0.13 | 0.13 | 0.14 | 0.14 |
| Fixed Asset Turnover | 16.0 | 18.1 | 20.6 | 18.8 | 0.15 |
| Dividend Yield | 2.5% | 3.9% | 3.5% | 3.1% | 3.9% |
Note: Fixed Asset Turnover for 2025 appears inconsistent with prior years, warranting caution when interpreting this metric.
Evolution of Financial Ratios
From 2021 to 2025, AvalonBay’s Return on Equity (ROE) declined from roughly 9.2% to 8.9%, indicating slight weakening profitability. The Current Ratio fell sharply from 0.91 in 2021 to 0.25 in 2025, signaling reduced liquidity. Debt-to-Equity remained relatively stable around 0.75 to 0.79, reflecting consistent leverage levels. Profit margins fluctuated but remained strong overall.
Are the Financial Ratios Favorable?
In 2025, AvalonBay showed a favorable net margin at 34.6% and a strong interest coverage ratio of 5.07, supporting profitability and debt servicing. However, ROE at 8.9% and return on invested capital at 4.3% lag the 6.1% WACC, implying capital inefficiency. Liquidity ratios are unfavorable, with a current ratio of 0.25. Leverage ratios are neutral, while price multiples (P/E 24.3, P/B 2.16) are neutral. Overall, the ratio profile is slightly unfavorable.
Shareholder Return Policy
AvalonBay Communities, Inc. maintains a high dividend payout ratio near 94%, with dividends per share rising steadily to $7.05 in 2025. Its dividend yield stands at 3.9%, supported by free cash flow coverage and moderate share buybacks.
The policy reflects strong cash flow discipline, balancing distributions with ongoing capital needs. This approach appears aligned with sustainable long-term shareholder value creation, though the high payout ratio warrants monitoring for potential risks in adverse market conditions.
Score analysis
The radar chart below illustrates AvalonBay Communities, Inc.’s key financial scores across valuation, profitability, and leverage metrics:
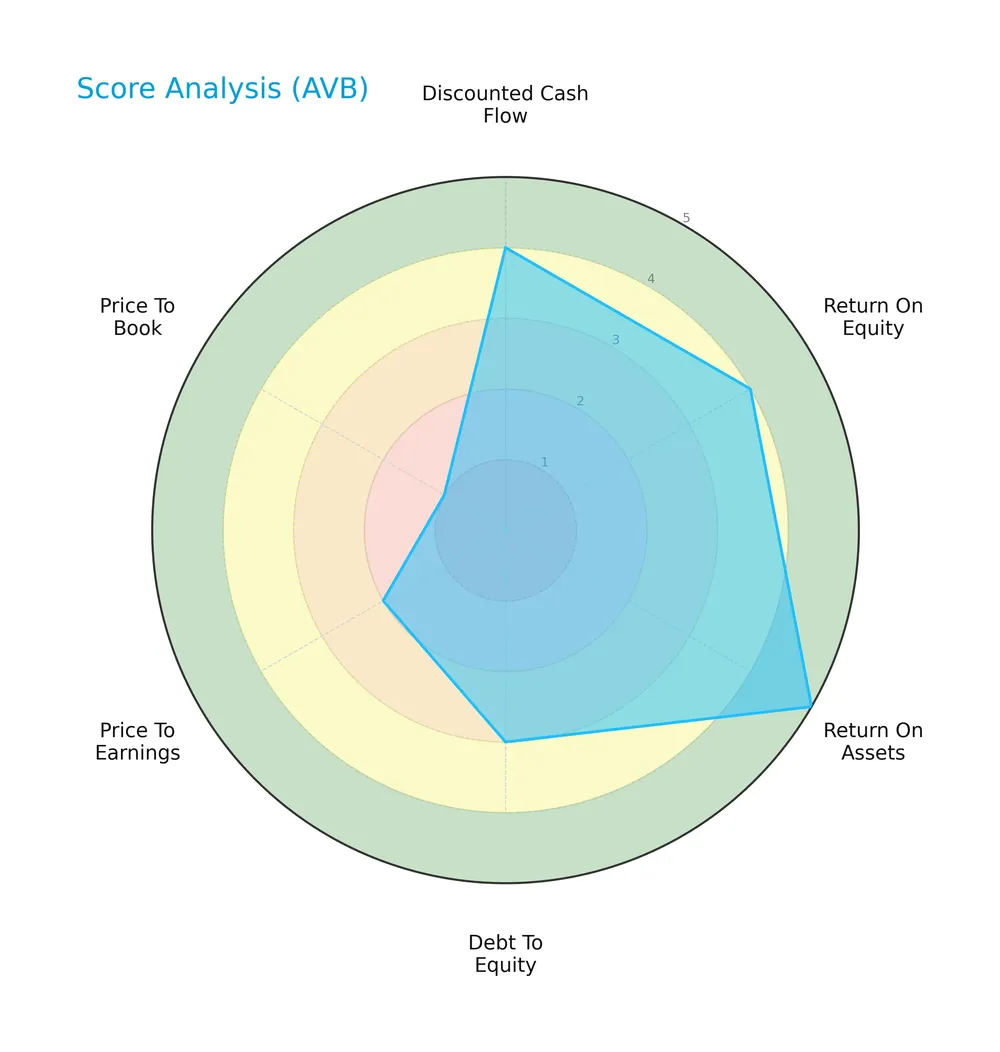
AvalonBay shows strength in discounted cash flow (4) and return on equity (4), with a very favorable return on assets score (5). Debt-to-equity is moderate (3), but valuation scores lag, with price-to-earnings (2) and price-to-book (1) rated unfavorably.
Analysis of the company’s bankruptcy risk
AvalonBay currently falls into the distress zone with an Altman Z-Score of approximately 1.77, signaling elevated bankruptcy risk compared to safer benchmarks:

Is the company in good financial health?
The Piotroski Score diagram highlights AvalonBay’s financial strength, reflecting solid profitability and operational efficiency:

With a strong Piotroski Score of 7, AvalonBay demonstrates robust financial health, suggesting effective management and potential resilience despite some valuation concerns.
Competitive Landscape & Sector Positioning
This analysis explores AvalonBay Communities, Inc.’s strategic positioning within the residential REIT sector. I will examine its revenue segments, key products, and main competitors. I aim to determine whether AvalonBay holds a competitive advantage over its peers.
Strategic Positioning
AvalonBay Communities focuses on residential REITs with a concentrated geographic footprint in 11 states, including major metros like New England and California. Its product portfolio centers on apartment communities, with a strong emphasis on same-store operations and selective development or redevelopment projects.
Revenue by Segment
This pie chart illustrates AvalonBay Communities, Inc.’s revenue distribution by segment for fiscal year 2023, highlighting the company’s income sources across its core business lines.
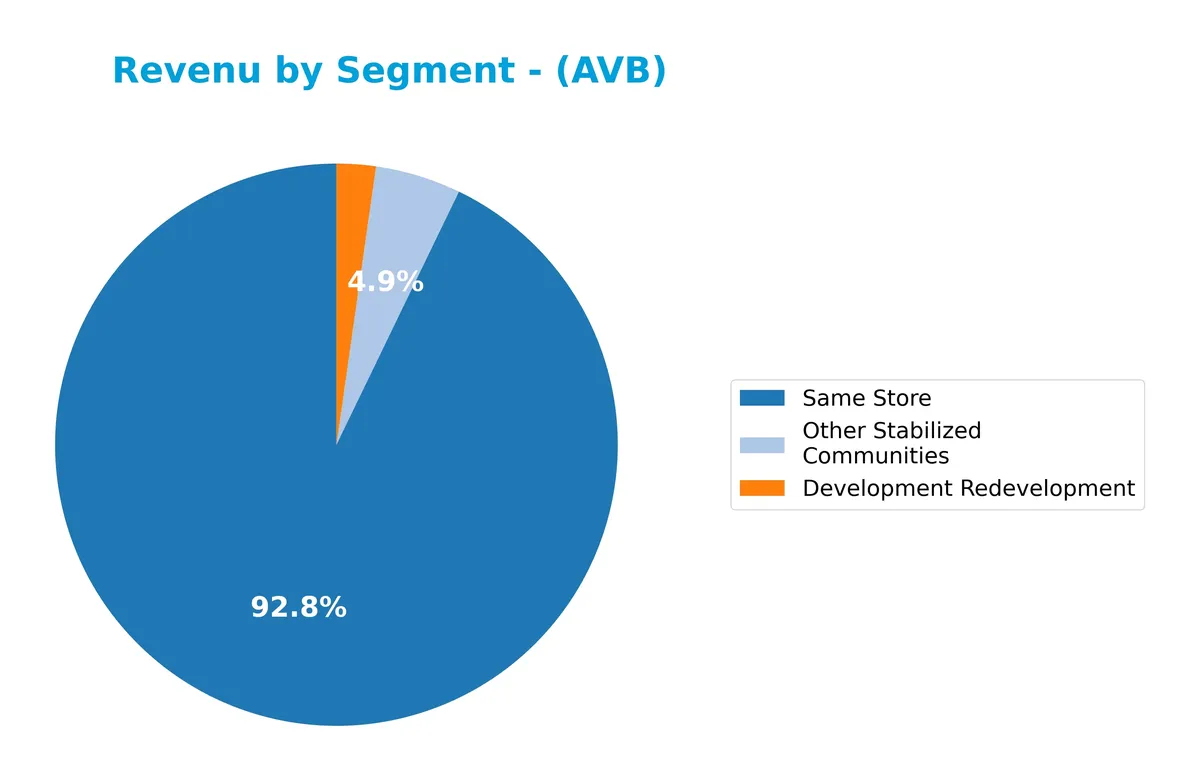
In 2023, the “Same Store” segment dominates revenue at 2.54B, reflecting steady organic growth in existing communities. “Other Stabilized Communities” contribute a smaller 135M, showing modest scale. “Development Redevelopment” revenue declined to 62M, signaling a slowdown or cautious capital deployment in new projects. The concentration in “Same Store” revenues underscores reliance on established assets, suggesting investors watch for diversification risks amid market cycles.
Key Products & Brands
AvalonBay’s revenue streams come primarily from distinct residential property segments as follows:
| Product | Description |
|---|---|
| Same Store Communities | Revenue from existing apartment communities consistently operated and stabilized. |
| Development & Redevelopment | Income generated from newly developed or significantly renovated apartment communities. |
| Other Stabilized Communities | Earnings from other fully operational apartment communities not classified under the above. |
AvalonBay’s product portfolio centers on residential apartment communities across various stages—stable, developing, and redeveloping. This segmentation reflects its core business model as a residential REIT focused on key metropolitan markets.
Main Competitors
AvalonBay Communities, Inc. faces competition from 7 key players, with the table listing the top 7 leaders by market capitalization:
| Competitor | Market Cap. |
|---|---|
| AvalonBay Communities, Inc. | 25.6B |
| Equity Residential | 23.6B |
| Invitation Homes Inc. | 17.0B |
| Essex Property Trust, Inc. | 16.5B |
| Mid-America Apartment Communities, Inc. | 16.3B |
| UDR, Inc. | 12.1B |
| Camden Property Trust | 11.7B |
AvalonBay ranks 1st among its competitors, with a market cap nearly equal to the sector leader (relative market cap 0.9784). It stands above both the average market cap of the top 10 (17.6B) and the median sector market cap (16.5B). The company maintains a 6.33% lead over its closest competitor below.
Comparisons with competitors
Check out how we compare the company to its competitors:
Does AVB have a competitive advantage?
AvalonBay Communities, Inc. shows a slightly unfavorable competitive advantage, as it is currently shedding value with an ROIC below its WACC. However, its growing ROIC trend indicates improving profitability despite this challenge.
Looking ahead, AVB’s portfolio includes 18 communities under development and expansion into Southeast Florida and Denver markets. These initiatives present opportunities to enhance its position in leading metropolitan residential real estate sectors.
SWOT Analysis
This analysis highlights AvalonBay Communities, Inc.’s core strengths, weaknesses, opportunities, and threats to guide strategic decisions.
Strengths
- Strong net margin at 34.64%
- Favorable dividend yield of 3.89%
- Growing ROIC trend indicates improving profitability
Weaknesses
- Low current and quick ratios at 0.25 signal liquidity concerns
- ROIC below WACC suggests value destruction
- Declining net margin growth and EPS growth
Opportunities
- Expansion into Southeast Florida and Denver markets
- Development and redevelopment pipeline with 18 communities under development
- Potential to improve operational efficiency
Threats
- Interest rate increases affecting financing costs
- Competitive pressure in metropolitan residential REIT space
- Market volatility impacting asset valuations
AvalonBay leverages strong profitability and dividend appeal but faces liquidity and value creation challenges. Strategic focus on operational efficiency and market expansion is crucial to offset financial risks.
Stock Price Action Analysis
The weekly stock chart displays AvalonBay Communities, Inc. (AVB) price movements over the past 12 months, highlighting key highs and lows:
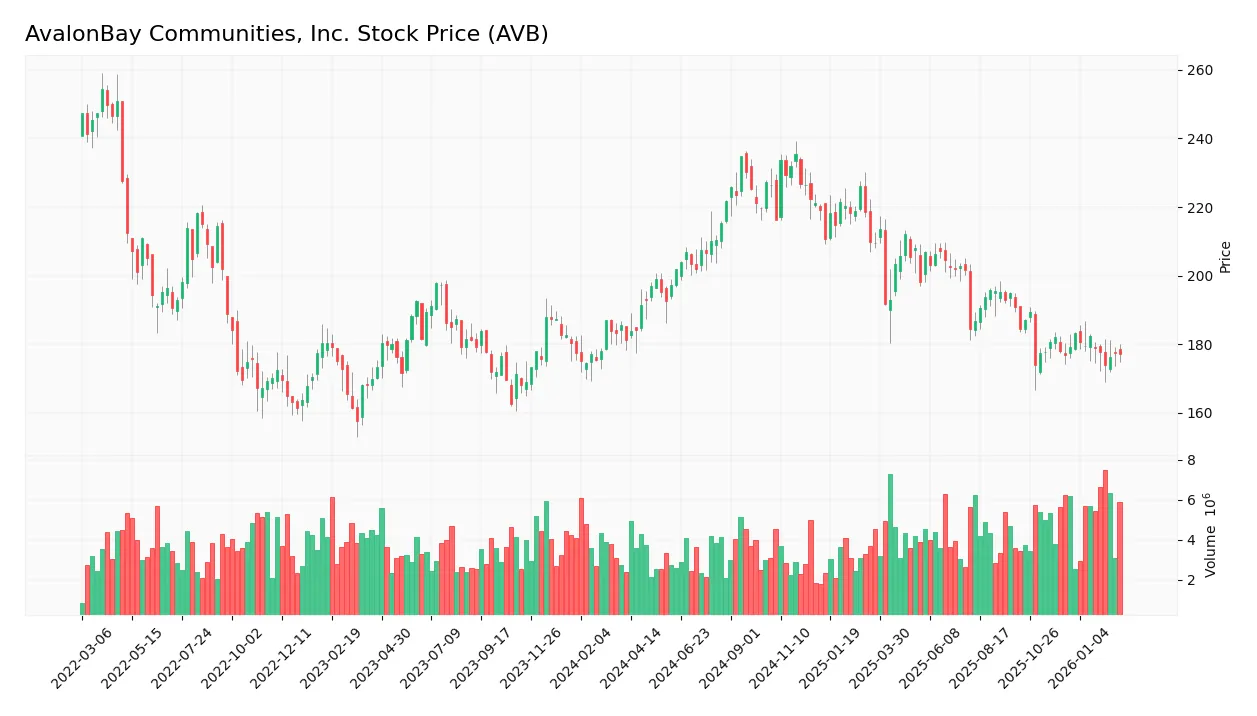
Trend Analysis
AVB’s stock price declined by 2.13% over the past year, indicating a bearish trend. The trend shows deceleration despite high volatility, with a standard deviation of 17.04. The highest price reached 235.35, and the lowest fell to 173.83, reflecting a wide trading range.
Volume Analysis
Trading volume has been increasing, totaling 470M shares with a slight seller dominance at 52%. Over the last three months, sellers accounted for 63%, signaling persistent selling pressure. This suggests cautious investor sentiment and subdued buying interest in AVB shares.
Target Prices
Analysts set a clear target consensus for AvalonBay Communities, Inc. (AVB).
| Target Low | Target High | Consensus |
|---|---|---|
| 172 | 217 | 192.9 |
The consensus indicates moderate upside potential, reflecting steady confidence in AVB’s market position and growth prospects.

Don’t Let Luck Decide Your Entry Point
Optimize your entry points with our advanced ProRealTime indicators. You’ll get efficient buy signals with precise price targets for maximum performance. Start outperforming now!
Analyst & Consumer Opinions
This section reviews AvalonBay Communities, Inc. (AVB) through expert grades and consumer feedback to gauge market sentiment.
Stock Grades
Here is a concise summary of AvalonBay Communities, Inc.’s recent analyst grades from reputable firms:
| Grading Company | Action | New Grade | Date |
|---|---|---|---|
| Citigroup | Maintain | Neutral | 2026-02-13 |
| Piper Sandler | Maintain | Neutral | 2026-02-09 |
| Cantor Fitzgerald | Maintain | Neutral | 2026-02-09 |
| RBC Capital | Maintain | Sector Perform | 2026-02-06 |
| Truist Securities | Maintain | Buy | 2026-01-20 |
| Barclays | Maintain | Overweight | 2026-01-13 |
| UBS | Maintain | Neutral | 2026-01-08 |
| Colliers Securities | Downgrade | Neutral | 2025-12-04 |
| Truist Securities | Maintain | Buy | 2025-12-02 |
| Barclays | Upgrade | Overweight | 2025-11-25 |
The overall consensus leans toward a Hold, reflecting a balance between Buy and Neutral ratings. Recent downgrades and maintained Neutral grades indicate cautious optimism among analysts.
Consumer Opinions
AvalonBay Communities, Inc. consistently earns praise for its quality living spaces and responsive management, though some tenants highlight areas for improvement.
| Positive Reviews | Negative Reviews |
|---|---|
| Well-maintained properties with modern amenities | Occasional delays in maintenance requests |
| Friendly and professional leasing staff | Higher rent compared to nearby complexes |
| Quiet neighborhoods with good security | Some units show signs of aging interiors |
| Responsive to tenant concerns | Limited parking availability in some locations |
Overall, consumers appreciate AvalonBay’s commitment to quality and service but express concerns about pricing and maintenance speed. This mix suggests a strong reputation tempered by operational execution challenges.
Risk Analysis
Below is a summary of key risks AvalonBay Communities, Inc. faces, considering likelihood and potential impact:
| Category | Description | Probability | Impact |
|---|---|---|---|
| Liquidity Risk | Current and quick ratios at 0.25 indicate weak liquidity. | High | High |
| Financial Distress | Altman Z-Score at 1.77 places company in distress zone. | Moderate | High |
| Valuation Risk | P/E and P/B ratios show neutral to unfavorable valuation. | Moderate | Medium |
| Operational Risk | Low asset turnover (0.14) suggests asset inefficiency. | Moderate | Medium |
| Interest Rate Risk | REIT sector sensitive to rising interest rates. | High | High |
Liquidity risk is most pressing due to low current ratios, signaling difficulty meeting short-term obligations. The distress zone Altman Z-Score warns of moderate bankruptcy risk. Meanwhile, interest rate hikes threaten REIT profitability. Investors must weigh these headwinds against a strong dividend yield (3.89%) and stable interest coverage (5.07x).
Should You Buy AvalonBay Communities, Inc.?
AvalonBay appears to be improving profitability with growing ROIC, yet it is shedding value relative to WACC, suggesting a slightly unfavorable moat. Despite significant leverage and liquidity concerns, its B+ rating reflects very favorable operational efficiency and moderate risk.
Strength & Efficiency Pillars
AvalonBay Communities, Inc. shows solid operational efficiency with a robust net margin of 34.64% and an EBIT margin of 43.26%, highlighting effective cost control. Its gross margin stands strong at 66.99%, reflecting pricing power. However, the return on invested capital (ROIC) at 4.28% trails its weighted average cost of capital (WACC) of 6.1%, indicating the company is currently destroying value despite an improving ROIC trend. The interest coverage ratio of 5.07 signals manageable debt servicing capacity.
Weaknesses and Drawbacks
The company is in financial distress with an Altman Z-Score of 1.77, signaling a high bankruptcy risk. This solvency concern dominates the risk profile regardless of operational margins. Additionally, liquidity is strained, as the current and quick ratios sit at a precarious 0.25, far below the safe threshold of 1.0. Valuation metrics reveal moderate caution with a price-to-earnings ratio of 24.26 and price-to-book ratio of 2.16, neither cheap nor expensive but reflective of market uncertainty. Recent seller dominance at 62.9% further pressures share price in the short term.
Our Final Verdict about AvalonBay Communities, Inc.
Despite operational strengths, AvalonBay Communities’ solvency risk, evidenced by its distress-zone Altman Z-Score of 1.77, renders its investment profile highly speculative. This financial fragility outweighs favorable margins and a strong Piotroski score of 7. Investors seeking conservative exposure might find this profile too risky. Prudence suggests monitoring for improved financial stability before considering long-term commitment.
Disclaimer: This content is for informational purposes only and does not constitute financial, investment, or other professional advice. Investing in financial markets involves a significant risk of loss, and past performance is not indicative of future results.
Additional Resources
- AvalonBay Communities, Inc. Announces Participation in the 2026 Citi Global Property CEO Conference, Provides First Quarter 2026 Business Update, and Publishes Updated Investor Presentation – Business Wire (Feb 27, 2026)
- AVALONBAY COMMUNITIES INC SEC 10-K Report – TradingView (Feb 27, 2026)
- Citigroup Inc. Cuts Position in AvalonBay Communities, Inc. $AVB – MarketBeat (Feb 25, 2026)
- AVB PE Ratio & Valuation, Is AVB Overvalued – Intellectia AI (Feb 28, 2026)
- AvalonBay (AVB) Price Target Lowered by Citi as Multifamily REIT Outlook Remains Mixed – Yahoo Finance (Feb 21, 2026)
For more information about AvalonBay Communities, Inc., please visit the official website: avalonbay.com