Home > Analyses > Consumer Cyclical > AutoZone, Inc.
AutoZone, Inc. powers the mobility of millions by providing essential automotive parts and accessories that keep vehicles running smoothly across North America. Renowned for its extensive product range and industry-leading retail footprint, AutoZone combines innovation with reliable quality to maintain its dominant position in the auto parts sector. As the automotive landscape evolves, I explore whether AutoZone’s robust fundamentals and strategic initiatives continue to support its premium market valuation and growth prospects.

Table of contents
Business Model & Company Overview
AutoZone, Inc., founded in 1979 and headquartered in Memphis, Tennessee, stands as a dominant player in the auto parts retail and distribution industry. Its ecosystem integrates a broad range of automotive replacement parts and accessories, spanning from hard parts like batteries and engines to maintenance products and non-automotive items. This comprehensive product suite supports cars, SUVs, vans, and light trucks, creating a unified platform for vehicle upkeep and enhancement.
The company’s revenue engine balances physical retail outlets—over 6,700 stores across the US, Mexico, and Brazil—with a growing digital presence through its ALLDATA software and e-commerce channels. This blend of hardware sales and software services fuels steady cash flows across key Americas markets. AutoZone’s robust competitive advantage lies in its extensive network and integrated customer offerings, securing its role in shaping the future of automotive aftermarket retail.
Financial Performance & Fundamental Metrics
In this section, I analyze AutoZone, Inc.’s income statement, key financial ratios, and dividend payout policy to assess its overall financial health and investment appeal.
Income Statement
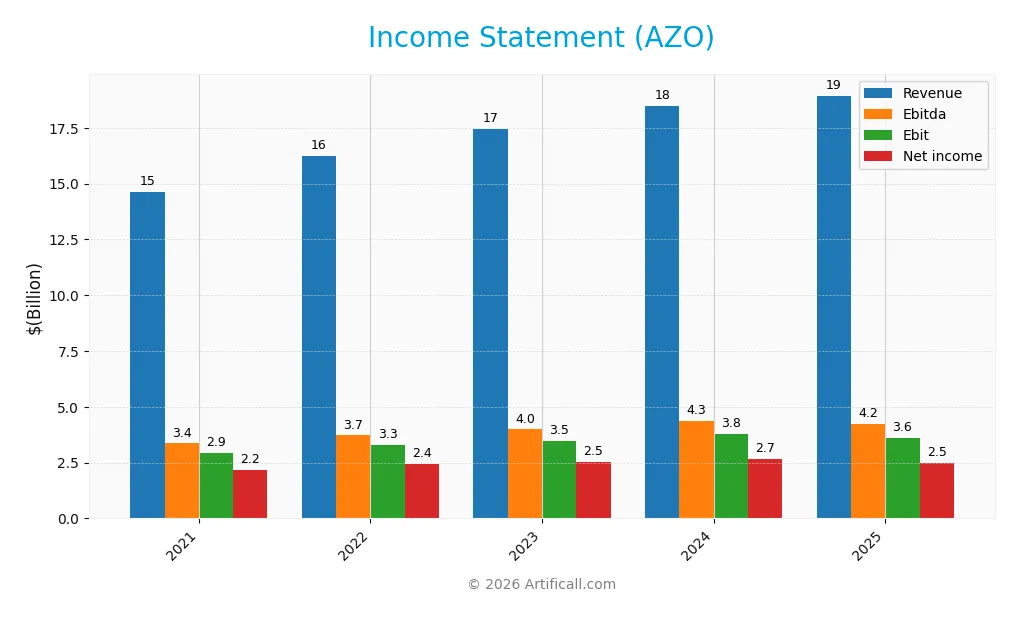
The table below presents AutoZone, Inc.’s key income statement figures for the fiscal years 2021 through 2025, highlighting revenue, profitability, and earnings per share metrics.
| 2021 | 2022 | 2023 | 2024 | 2025 | |
|---|---|---|---|---|---|
| Revenue | 14.63B | 16.25B | 17.46B | 18.49B | 18.94B |
| Cost of Revenue | 6.91B | 7.78B | 8.39B | 8.67B | 8.97B |
| Operating Expenses | 4.77B | 5.20B | 5.60B | 6.03B | 6.36B |
| Gross Profit | 7.72B | 8.47B | 9.07B | 9.82B | 9.97B |
| EBITDA | 3.36B | 3.72B | 3.98B | 4.35B | 4.22B |
| EBIT | 2.95B | 3.28B | 3.49B | 3.80B | 3.61B |
| Interest Expense | 197M | 194M | 316M | 461M | 487M |
| Net Income | 2.17B | 2.43B | 2.53B | 2.66B | 2.50B |
| EPS | 97.6 | 120.83 | 136.6 | 153.82 | 148.8 |
| Filing Date | 2021-10-25 | 2022-10-24 | 2023-10-24 | 2024-10-28 | 2025-10-27 |
Income Statement Evolution
From 2021 to 2025, AutoZone, Inc. demonstrated a favorable overall growth trend with revenue increasing by 29.45% and net income by 15.11%. However, in the most recent year, revenue growth slowed to 2.43%, while net income and EBIT declined by 8.39% and 5.0%, respectively. Margins showed mixed dynamics: gross margin remained stable and favorable at 52.62%, but net margin contracted by 11.08% over the period.
Is the Income Statement Favorable?
The 2025 income statement reveals solid fundamentals with a gross margin of 52.62% and EBIT margin of 19.06%, both rated favorable. Interest expense is well controlled at 2.57% of revenue, supporting a net margin of 13.19%. Despite a slowdown in growth and some margin compression, the overall income statement evaluation is favorable, reflecting strength in profitability and cost management amid recent challenges.
Financial Ratios
The following table presents key financial ratios for AutoZone, Inc. (ticker: AZO) over the fiscal years 2021 to 2025, providing insight into profitability, valuation, liquidity, leverage, and efficiency metrics:
| Ratios | 2021 | 2022 | 2023 | 2024 | 2025 |
|---|---|---|---|---|---|
| Net Margin | 15% | 15% | 14% | 14% | 13% |
| ROE | -121% | -69% | -58% | -56% | -73% |
| ROIC | 31% | 37% | 35% | 34% | 28% |
| P/E | 16 | 18 | 18 | 21 | 28 |
| P/B | -19 | -12 | -10 | -12 | -21 |
| Current Ratio | 0.87 | 0.77 | 0.80 | 0.84 | 0.88 |
| Quick Ratio | 0.24 | 0.12 | 0.12 | 0.13 | 0.14 |
| D/E | -4.58 | -2.63 | -2.51 | -2.60 | -3.60 |
| Debt-to-Assets | 57% | 61% | 68% | 72% | 63% |
| Interest Coverage | 15 | 17 | 11 | 8 | 7 |
| Asset Turnover | 1.01 | 1.06 | 1.09 | 1.08 | 0.98 |
| Fixed Asset Turnover | 1.93 | 2.01 | 2.03 | 2.00 | 1.85 |
| Dividend Yield | 0% | 0% | 0% | 0% | 0% |
Evolution of Financial Ratios
From 2021 to 2025, AutoZone, Inc.’s Return on Equity (ROE) remained negative and deteriorated further to -73.17% in 2025, indicating declining shareholder profitability. The Current Ratio showed a slight improvement to 0.88 in 2025 but stayed below 1, suggesting persistent liquidity constraints. The Debt-to-Equity Ratio remained negative, reflecting an unusual capital structure, while profitability metrics such as net profit margin decreased slightly but stayed above 13%, showing relative stability.
Are the Financial Ratios Fovorable?
In 2025, profitability appears mixed with a favorable net margin of 13.19% and a strong Return on Invested Capital (28.13%), yet ROE is unfavorable. Liquidity ratios including Current (0.88) and Quick (0.14) are unfavorable, signaling tight short-term financial flexibility. Leverage ratios are mixed: Debt-to-Equity is favorable at -3.6, but Debt-to-Assets is high at 63.49%, an unfavorable sign. Efficiency ratios like asset turnover are neutral. Overall, the ratio profile is balanced with 43% favorable, 43% unfavorable, and 14% neutral, yielding a neutral global assessment.
Shareholder Return Policy
AutoZone, Inc. does not pay dividends, reflecting a strategy likely focused on reinvestment or growth rather than direct shareholder income. Although the company maintains no dividend payout, it is important to note that there is no explicit mention of share buyback programs in the provided data.
This approach, with zero dividend yield and payout ratio, may align with long-term value creation if supported by operational performance and free cash flow generation. However, without share repurchases or dividend distributions, shareholder returns rely primarily on capital appreciation.
Score analysis
The following radar chart presents an overview of key financial scores for AutoZone, Inc.:
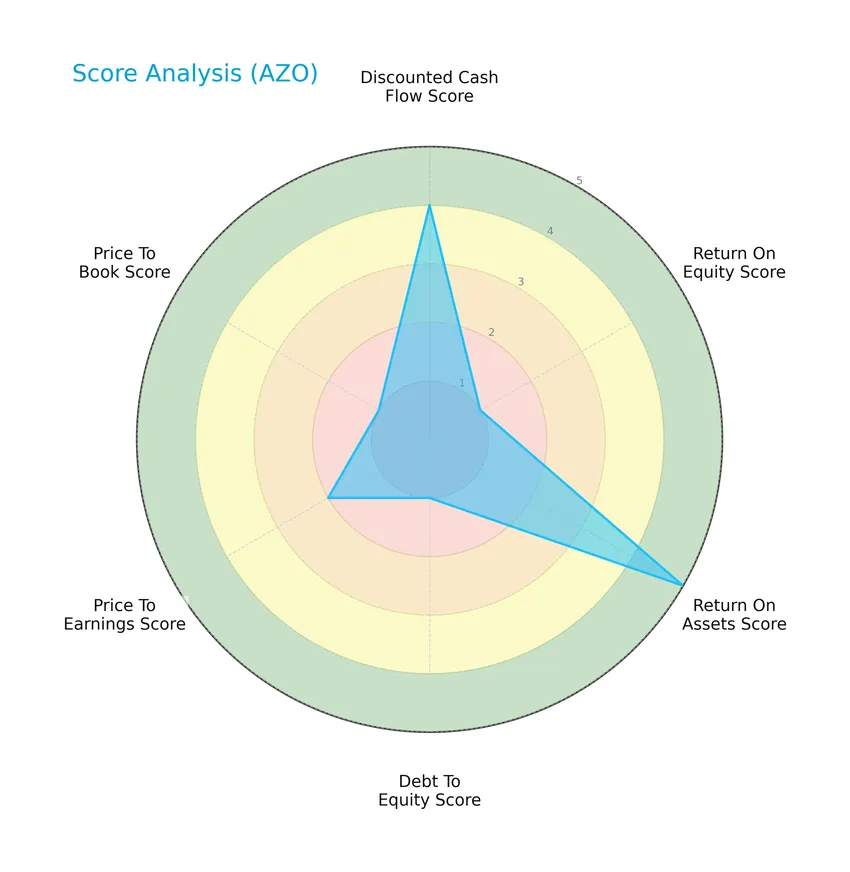
AutoZone shows a favorable discounted cash flow score of 4 and a very favorable return on assets score of 5. However, the return on equity, debt to equity, and price to book scores are very unfavorable at 1 each, while the price to earnings score is moderate at 2.
Analysis of the company’s bankruptcy risk
The Altman Z-Score places AutoZone in the grey zone, indicating a moderate risk of bankruptcy:

Is the company in good financial health?
This Piotroski diagram illustrates AutoZone’s financial strength based on key profitability, leverage, liquidity, and efficiency criteria:

With a Piotroski Score of 7, AutoZone demonstrates strong financial health, suggesting solid fundamentals though not at the very strongest level.
Competitive Landscape & Sector Positioning
This sector analysis will examine AutoZone, Inc.’s strategic positioning, revenue by segment, key products, main competitors, competitive advantages, and SWOT analysis. I will assess whether the company holds a competitive advantage over its industry peers.
Strategic Positioning
AutoZone, Inc. maintains a concentrated product portfolio focused on automotive parts and accessories, generating over $18.9B in 2025 primarily from its auto parts locations. Geographically, it is mainly exposed to the US market, with about $16.7B revenue, and a smaller presence in Mexico and Brazil contributing $2.3B.
Revenue by Segment
This pie chart illustrates AutoZone, Inc.’s revenue distribution by segment for the fiscal year 2025, highlighting the relative size of each business area.
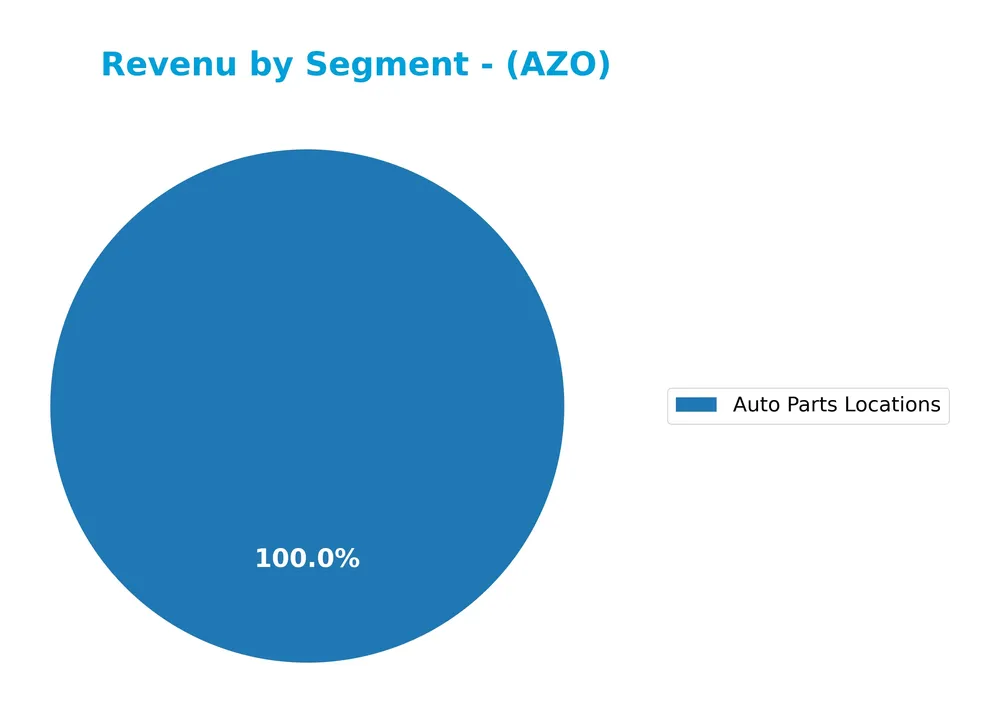
The dominant revenue driver for AutoZone remains the “Auto Parts Locations” segment, generating $18.9B in 2025, reflecting consistent growth from $7.2B in 2010. Other segments contribute marginally, with no significant shift in revenue concentration. The business shows steady expansion in its core segment, but investors should note the heavy reliance on this single revenue source, which could pose concentration risk if market conditions change.
Key Products & Brands
The main products and brands of AutoZone, Inc. include automotive parts, maintenance items, accessories, and software solutions:
| Product | Description |
|---|---|
| Automotive Replacement Parts | New and remanufactured hard parts for cars, SUVs, vans, and light trucks, including batteries, belts, brakes, and more. |
| Maintenance Products | Items such as antifreeze, windshield washer fluids, oil and transmission fluids, and various filters. |
| Accessories | Interior and exterior car accessories, including floor mats, seat covers, steering wheel covers, and air fresheners. |
| Automotive Diagnostic Software | ALLDATA brand diagnostic and repair software sold through online platforms. |
| Retail Stores | Operates 6,785 stores (6,066 US, 666 Mexico, 53 Brazil) for distribution and retail of automotive products. |
AutoZone’s portfolio centers on a broad range of automotive parts and maintenance products distributed through its extensive store network, supplemented by software services under the ALLDATA brand.
Main Competitors
There are 4 main competitors in the Auto – Parts industry; the table below lists the top 4 leaders by market capitalization:
| Competitor | Market Cap. |
|---|---|
| O’Reilly Automotive, Inc. | 76.3B |
| AutoZone, Inc. | 55.3B |
| Aptiv PLC | 17.0B |
| Mobileye Global Inc. | 8.5B |
AutoZone, Inc. ranks 2nd among its 4 main competitors, with a market cap approximately 81% that of the leader, O’Reilly Automotive. The company is positioned above both the average market cap of the top 10 competitors (39.3B) and the sector median (36.1B). It maintains a 24.06% gap below the closest competitor above, demonstrating a strong scale relative to its peers.
Comparisons with competitors
Check out how we compare the company to its competitors:
Does AutoZone have a competitive advantage?
AutoZone presents a competitive advantage as it consistently generates returns on invested capital (ROIC) well above its weighted average cost of capital (WACC), indicating value creation despite a declining ROIC trend. Its gross margin of 52.62% and net margin of 13.19% remain favorable, supporting its profitability in the auto parts retail sector.
Looking ahead, AutoZone’s extensive store network across the US, Mexico, and Brazil and its diversified product range, including automotive diagnostic software, position it to capitalize on opportunities in new markets and product segments. Continued innovation and expansion in commercial credit and delivery services may further support its competitive positioning.
SWOT Analysis
This SWOT analysis highlights the key internal and external factors influencing AutoZone, Inc.’s strategic position.
Strengths
- Strong market presence with over 6,700 stores across US and international markets
- High gross margin of 52.6% indicating pricing power
- Solid ROIC of 28.1% surpassing WACC by a wide margin
Weaknesses
- Declining ROIC trend signaling profitability pressures
- Low liquidity ratios with current ratio at 0.88
- Negative ROE at -73.2% reflecting equity return issues
Opportunities
- Expansion potential in emerging markets like Mexico and Brazil
- Growth in online sales channels including ALLDATA software platform
- Increasing demand for automotive maintenance and aftermarket parts
Threats
- Intense competition from other auto parts retailers and e-commerce giants
- Rising debt-to-assets ratio at 63.5% increasing financial risk
- Macroeconomic slowdown impacting consumer discretionary spending
AutoZone’s strengths in market reach and profitability create a strong foundation, yet its liquidity and equity returns require attention. Capitalizing on digital growth and geographic expansion while managing financial risks will be critical for sustainable strategy execution.
Stock Price Action Analysis
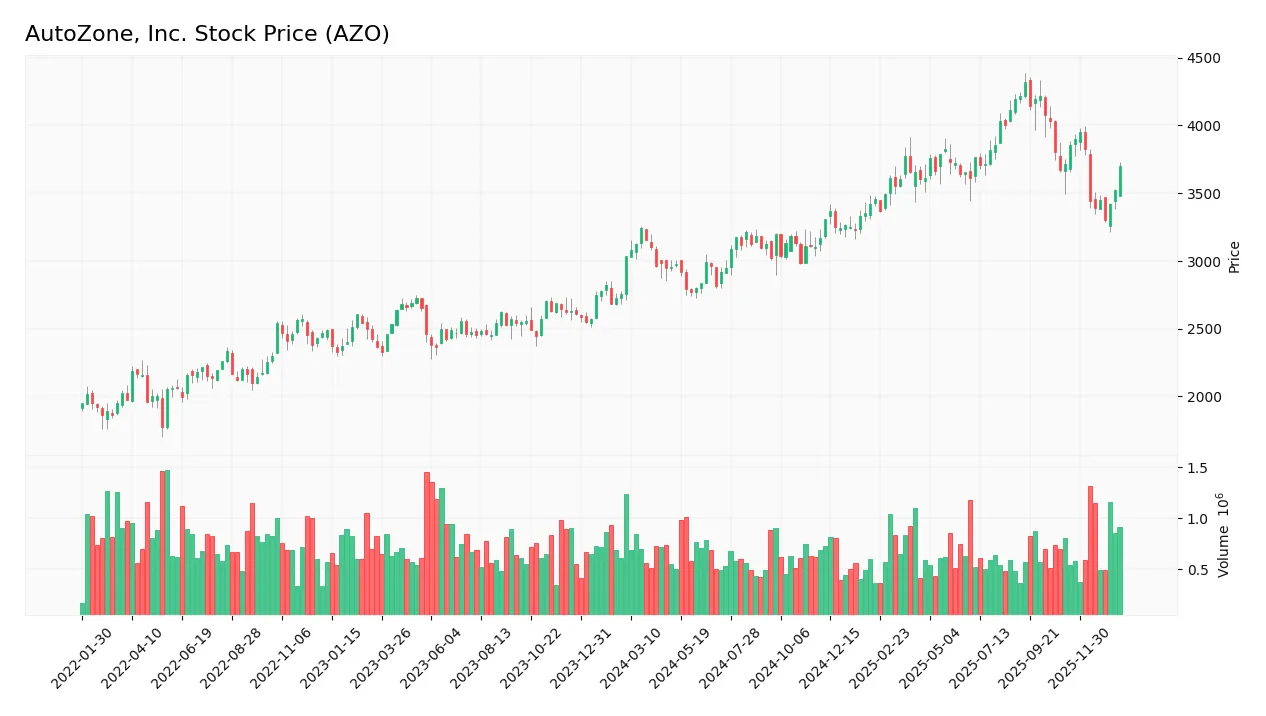
The following weekly stock chart illustrates AutoZone, Inc.’s price movements over the last 12 months, highlighting key highs, lows, and recent trends:
Trend Analysis
Over the past 12 months, AutoZone’s stock price increased by 21.87%, indicating a bullish trend overall. The trend shows deceleration despite the positive gain. Price volatility is high with a standard deviation of 393.62. The stock peaked at 4322.15 and bottomed at 2769.94, reflecting significant price range fluctuations.
Volume Analysis
Trading volume over the last three months is decreasing, with buyers accounting for 61.63% of activity, suggesting buyer dominance. This indicates sustained investor interest, though waning volume points to cautious market participation and potentially reduced momentum in recent sessions.
Target Prices
The consensus target price for AutoZone, Inc. reflects a positive outlook from analysts.
| Target High | Target Low | Consensus |
|---|---|---|
| 4,800 | 3,550 | 4,321.47 |
Analysts expect the stock price to range between 3,550 and 4,800, with a consensus around 4,321, indicating confidence in potential upside.

Don’t Let Luck Decide Your Entry Point
Optimize your entry points with our advanced ProRealTime indicators. You’ll get efficient buy signals with precise price targets for maximum performance. Start outperforming now!
Analyst & Consumer Opinions
This section examines the latest analyst ratings and consumer feedback regarding AutoZone, Inc. (AZO) performance and reputation.
Stock Grades
The following table summarizes the recent stock grades assigned to AutoZone, Inc. by prominent financial institutions:
| Grading Company | Action | New Grade | Date |
|---|---|---|---|
| Morgan Stanley | Maintain | Overweight | 2026-01-15 |
| Barclays | Maintain | Overweight | 2026-01-08 |
| Mizuho | Downgrade | Neutral | 2026-01-05 |
| JP Morgan | Maintain | Overweight | 2025-12-18 |
| Wolfe Research | Downgrade | Peer Perform | 2025-12-16 |
| Citigroup | Maintain | Buy | 2025-12-11 |
| UBS | Maintain | Buy | 2025-12-10 |
| BMO Capital | Maintain | Outperform | 2025-12-10 |
| Barclays | Maintain | Overweight | 2025-12-10 |
| Guggenheim | Maintain | Buy | 2025-12-10 |
Overall, the grades show a prevailing positive outlook, with multiple institutions maintaining Overweight and Buy ratings. Some recent downgrades to Neutral and Peer Perform indicate a cautious stance among certain analysts.
Consumer Opinions
AutoZone, Inc. continues to receive mixed feedback from its customers, reflecting a balance of satisfaction and areas for improvement.
| Positive Reviews | Negative Reviews |
|---|---|
| Wide selection of auto parts readily available | Higher prices compared to competitors |
| Knowledgeable and helpful staff | Occasional stock shortages |
| Convenient store locations and hours | Long wait times during peak hours |
Overall, consumers appreciate AutoZone’s product variety and expert service, but pricing and occasional inventory issues remain common concerns. These insights suggest potential areas for the company to focus on enhancing customer satisfaction.
Risk Analysis
Below is a summary table of key risks associated with AutoZone, Inc., highlighting their probability and potential impact on the company’s performance:
| Category | Description | Probability | Impact |
|---|---|---|---|
| Financial Stability | Altman Z-Score in the grey zone (2.78) signals moderate bankruptcy risk despite strong sales. | Medium | High |
| Profitability | Negative Return on Equity (-73.17%) poses concerns about shareholder value creation. | High | High |
| Liquidity | Low current ratio (0.88) and quick ratio (0.14) indicate potential short-term liquidity issues. | High | Medium |
| Leverage | High debt-to-assets ratio (63.49%) increases financial risk despite favorable interest coverage. | High | High |
| Valuation | Unfavorable P/E (28.22) and negative P/B (-20.65) may indicate overvaluation or accounting issues. | Medium | Medium |
| Dividend Policy | No dividend yield limits income returns for investors seeking cash flow. | Low | Low |
| Market Volatility | Low beta (0.42) suggests limited sensitivity to market swings but may reduce upside potential. | Low | Low |
The most pressing risks for AutoZone involve its financial leverage and poor return on equity, which could undermine investor confidence. Despite strong operational metrics and a solid Piotroski score of 7, the company’s liquidity constraints and moderate bankruptcy risk warrant cautious monitoring.
Should You Buy AutoZone, Inc.?
AutoZone, Inc. appears to be generating robust operational efficiency with a durable competitive moat, despite a declining return on invested capital. Its leverage profile could be seen as substantial but manageable, supporting a very favorable B- rating and moderate financial strength signals.
Strength & Efficiency Pillars
AutoZone, Inc. displays solid profitability with a net margin of 13.19% and a robust EBIT margin of 19.06%, reflecting effective cost management and operational efficiency. Its return on invested capital (ROIC) at 28.13% significantly exceeds its weighted average cost of capital (WACC) at 5.39%, confirming that the company is a clear value creator. Financial health is moderately stable, with an Altman Z-score of 2.78 placing it in the grey zone, while a Piotroski score of 7 indicates strong financial strength. These metrics collectively underscore AutoZone’s efficiency and prudent value generation.
Weaknesses and Drawbacks
Despite favorable profitability, AutoZone faces several notable risks. Its return on equity (ROE) is deeply negative at -73.17%, signaling potential issues with equity returns. The valuation metrics are mixed: a relatively high price-to-earnings ratio of 28.22 suggests a premium valuation, while the price-to-book ratio appears favorable but is negatively signed, which warrants caution. The company’s liquidity ratios are weak, with a current ratio of 0.88 and a quick ratio of 0.14, indicating potential short-term liquidity stress. Additionally, a high debt-to-assets ratio of 63.49% points to significant leverage risk.
Our Verdict about AutoZone, Inc.
AutoZone’s long-term fundamental profile may appear favorable given its strong value creation and profitability, but the mixed signals from leverage, liquidity, and valuation require caution. The overall bullish stock trend combined with buyer dominance in the recent period suggests positive technical momentum. However, the deceleration in price gains advises a measured approach. Thus, AutoZone might be suited for investors seeking exposure to a value-creating company but who are willing to monitor liquidity and leverage risks closely.
Disclaimer: This content is for informational purposes only and does not constitute financial, investment, or other professional advice. Investing in financial markets involves a significant risk of loss, and past performance is not indicative of future results.
Additional Resources
- AutoZone, Inc. (AZO) is Attracting Investor Attention: Here is What You Should Know – Yahoo Finance (Jan 21, 2026)
- Wealth Enhancement Advisory Services LLC Increases Position in AutoZone, Inc. $AZO – MarketBeat (Jan 22, 2026)
- Jim Cramer on AutoZone: “This Company Always Pivots and Always Pivots Well” – Finviz (Jan 18, 2026)
- What to expect from AutoZone’s next quarterly earnings report – MSN (Jan 22, 2026)
- AutoZone: It’s In The Buy Zone (NYSE:AZO) – Seeking Alpha (Jan 07, 2026)
For more information about AutoZone, Inc., please visit the official website: autozone.com