Home > Analyses > Technology > Autodesk, Inc.
Autodesk revolutionizes how architects, engineers, and designers bring ideas to life. Its cutting-edge 3D design and engineering software powers projects spanning from skyscrapers to blockbuster films. Renowned for innovation and a robust cloud platform, Autodesk commands a leading role in creative and industrial workflows. As the software landscape evolves, I explore whether Autodesk’s solid market influence and product suite continue to justify its premium valuation and growth prospects.

Table of contents
Business Model & Company Overview
Autodesk, Inc., founded in 1982 and headquartered in San Rafael, CA, commands a leading position in application software for 3D design, engineering, and entertainment. Its portfolio integrates tools like AutoCAD, BIM 360, and Maya into a seamless ecosystem serving architecture, manufacturing, and media industries. This cohesive offering drives productivity across complex workflows and creative projects worldwide.
The company’s revenue engine balances software licenses and growing cloud-based services, including construction management and production tracking platforms. Autodesk’s global footprint spans the Americas, Europe, and Asia, addressing diverse professional needs. Its strong economic moat stems from entrenched industry standards and continuous innovation, shaping the future of digital design and engineering.
Financial Performance & Fundamental Metrics
I will analyze Autodesk, Inc.’s income statement, key financial ratios, and dividend payout policy to assess its overall financial health and shareholder value.
Income Statement
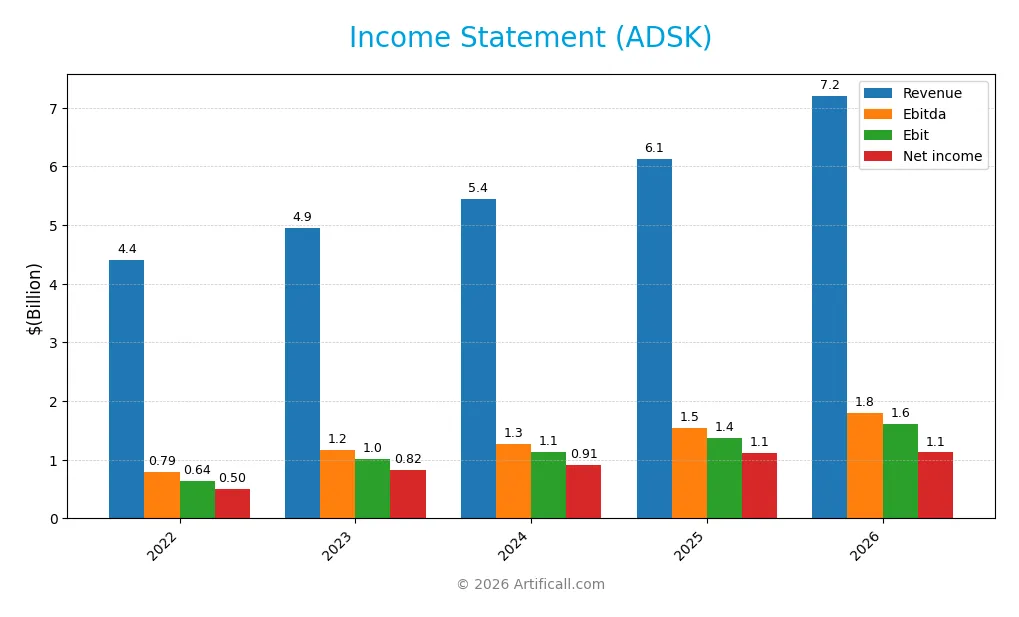
Below is Autodesk, Inc.’s Income Statement for fiscal years 2022 through 2026, showing key profitability and expense metrics in USD.
| 2022 | 2023 | 2024 | 2025 | 2026 | |
|---|---|---|---|---|---|
| Revenue | 4.40B | 4.95B | 5.44B | 6.13B | 7.21B |
| Cost of Revenue | 458M | 517M | 553M | 578M | 703M |
| Operating Expenses | 3.28B | 3.44B | 3.77B | 4.20B | 4.71B |
| Gross Profit | 3.94B | 4.43B | 4.89B | 5.55B | 6.50B |
| EBITDA | 789M | 1.17B | 1.27B | 1.55B | 1.80B |
| EBIT | 641M | 1.02B | 1.14B | 1.37B | 1.60B |
| Interest Expense | 76M | 71M | 0 | 0 | 0 |
| Net Income | 497M | 823M | 906M | 1.11B | 1.12B |
| EPS | 2.26 | 3.81 | 4.19 | 5.17 | 5.28 |
| Filing Date | 2022-03-14 | 2023-03-14 | 2024-06-10 | 2025-03-06 | 2026-03-03 |
Income Statement Evolution
Autodesk’s revenue grew steadily from 4.4B in 2022 to 7.2B in 2026, a 64% increase over five years. Gross margin remained robust around 90%, while net income more than doubled, reaching 1.12B in 2026. Operating and EBITDA margins improved steadily, reflecting disciplined cost control alongside top-line growth.
Is the Income Statement Favorable?
In 2026, Autodesk posted a 7.2B revenue with a high gross margin of 90.24% and an EBIT margin of 22.25%. Net margin held at a healthy 15.6%, despite a slight dip in net margin growth last year. Interest expense was zero, enhancing profitability. Overall, the income statement fundamentals appear favorable, supported by strong margin stability and consistent earnings growth.
Financial Ratios
The following table presents key financial ratios for Autodesk, Inc. over the last five fiscal years, providing insight into profitability, efficiency, liquidity, leverage, and valuation metrics:
| Ratios | 2022 | 2023 | 2024 | 2025 | 2026 |
|---|---|---|---|---|---|
| Net Margin | 11.3% | 16.6% | 16.7% | 18.1% | 15.6% |
| ROE | 58.5% | 71.9% | 48.8% | 42.4% | 36.9% |
| ROIC | 11.6% | 15.6% | 15.8% | 18.0% | 18.7% |
| P/E | 110.4 | 56.5 | 60.5 | 60.2 | 47.9 |
| P/B | 64.6 | 40.6 | 29.6 | 25.5 | 17.7 |
| Current Ratio | 0.69 | 0.84 | 0.82 | 0.68 | 0.85 |
| Quick Ratio | 0.69 | 0.84 | 0.82 | 0.68 | 0.85 |
| D/E | 3.60 | 2.33 | 1.42 | 0.98 | 0.90 |
| Debt-to-Assets | 35.6% | 28.2% | 26.5% | 23.6% | 21.9% |
| Interest Coverage | 8.67 | 13.97 | 0 | 0 | 0 |
| Asset Turnover | 0.51 | 0.52 | 0.55 | 0.57 | 0.58 |
| Fixed Asset Turnover | 9.42 | 12.7 | 15.8 | 21.4 | 45.9 |
| Dividend Yield | 0% | 0% | 0% | 0% | 0% |
Evolution of Financial Ratios
From 2022 to 2026, Autodesk’s Return on Equity (ROE) showed volatility, peaking around 72% in 2023 but settling at 37% in 2026. The Current Ratio remained below 1.0, indicating consistent liquidity constraints. Debt-to-Equity Ratio improved markedly from 3.6 in 2022 to 0.9 in 2026, signaling reduced leverage and enhanced financial stability.
Are the Financial Ratios Fovorable?
In 2026, profitability metrics such as net margin (15.6%) and ROE (36.9%) are favorable, reflecting strong earnings relative to equity. Liquidity ratios remain mixed; the current ratio at 0.85 flags potential short-term risks, while the quick ratio is neutral. Leverage metrics show a moderate debt-to-equity ratio of 0.9, deemed neutral, and a favorable debt-to-assets ratio of 21.9%. Market valuation ratios, including a high P/E of 47.9 and P/B of 17.7, are unfavorable, suggesting stretched investor expectations. Overall, ratio analysis is slightly favorable but warrants caution on valuation and liquidity fronts.
Shareholder Return Policy
Autodesk, Inc. does not pay dividends, reflecting a focus on reinvestment and growth rather than immediate cash returns. The company instead preserves cash for operational needs and strategic initiatives, with no dividend payout ratio or yield reported.
The absence of dividends aligns with Autodesk’s strategy to sustain long-term value through capital allocation in innovation and expansion. Although share buyback data is not provided, the zero dividend policy suggests prioritization of growth over shareholder distributions at this stage.
Score analysis
The following radar chart displays key financial scores evaluating Autodesk, Inc.’s valuation and performance metrics:
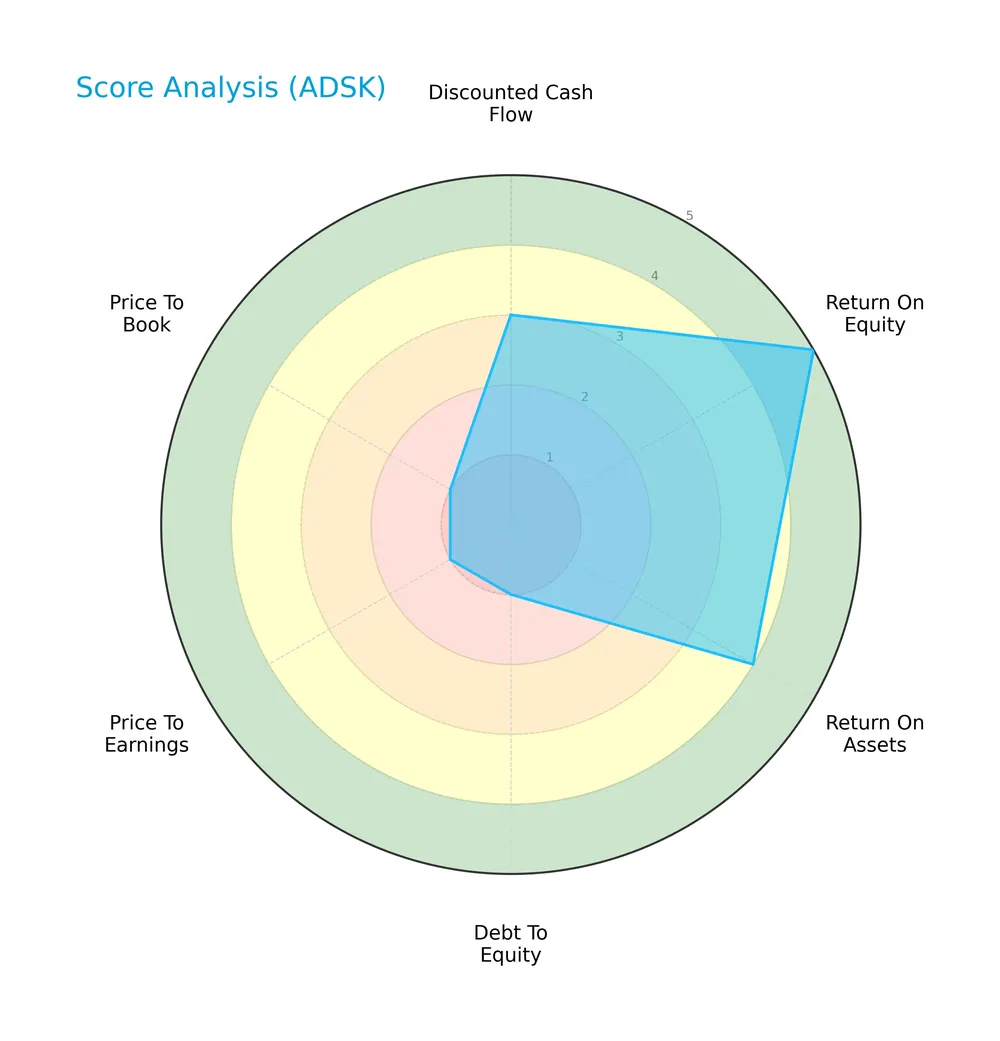
Autodesk shows strong return on equity (5) and return on assets (4), indicating operational efficiency. However, its debt-to-equity (1), price-to-earnings (1), and price-to-book (1) scores suggest significant valuation and leverage concerns.
Analysis of the company’s bankruptcy risk
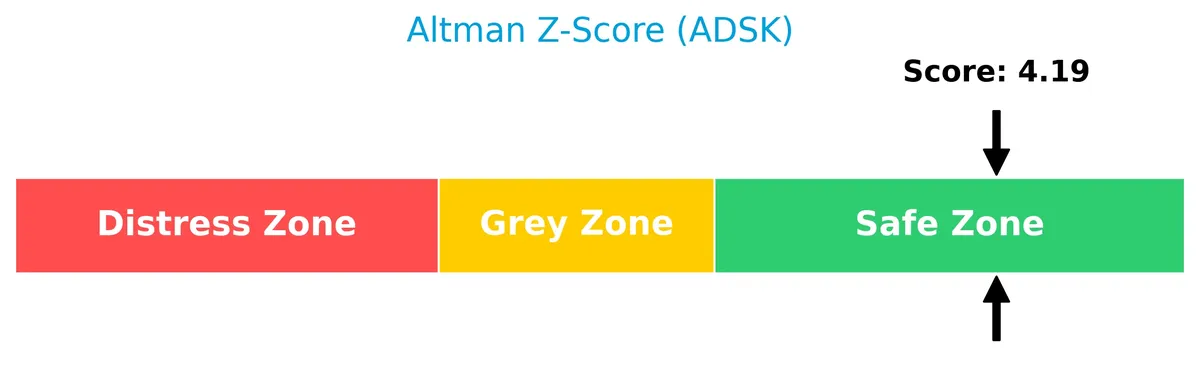
The Altman Z-Score places Autodesk in the safe zone, indicating low bankruptcy risk and solid financial stability:
Is the company in good financial health?
The Piotroski Score diagram highlights Autodesk’s strong financial condition based on profitability, leverage, and efficiency metrics:

With a Piotroski Score of 8, Autodesk demonstrates very strong financial health, reflecting robust fundamentals and effective capital management.
Competitive Landscape & Sector Positioning
This analysis explores Autodesk, Inc.’s strategic positioning within the software application industry. It reviews revenue by segment, key products, main competitors, and competitive advantages. I will assess whether Autodesk holds a sustainable competitive advantage over its peers.
Strategic Positioning
Autodesk maintains a diversified product portfolio spanning architecture, manufacturing, and media software, with Architecture Engineering and Construction leading at $3.58B in 2026. Geographically, revenue is balanced across Americas ($3.18B), EMEA ($2.79B), and Asia Pacific ($1.23B), reflecting global exposure.
Revenue by Segment
This pie chart breaks down Autodesk, Inc.’s revenue by product segment for the fiscal year 2026, highlighting the distribution across its key business areas.
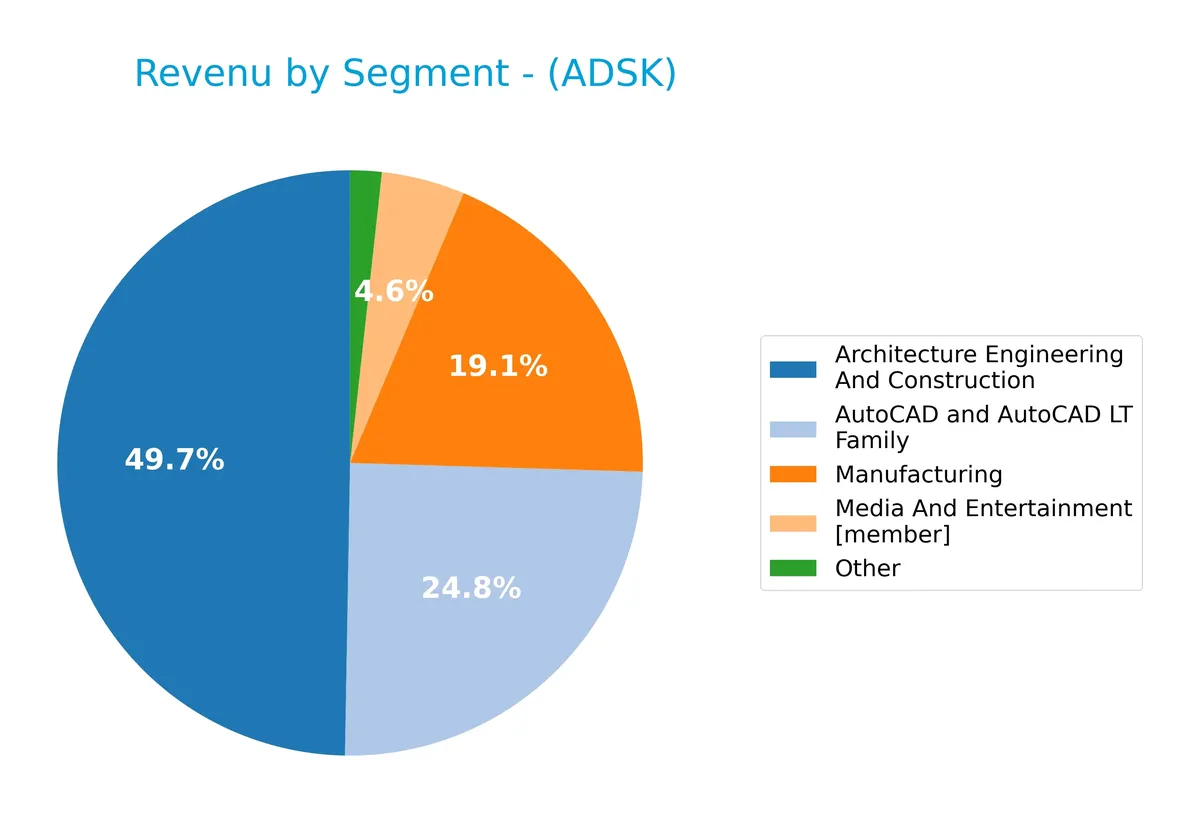
Architecture Engineering And Construction leads with $3.58B, showing robust growth from prior years. AutoCAD and AutoCAD LT Family and Manufacturing follow at $1.79B and $1.38B, respectively, both accelerating steadily. Media And Entertainment and Other segments contribute smaller shares at $332M and $125M. The 2026 figures reveal increased concentration in core segments, emphasizing Autodesk’s focus on its engineering and design software moat.
Key Products & Brands
The following table lists Autodesk’s main products and brands alongside their core descriptions:
| Product | Description |
|---|---|
| AutoCAD and AutoCAD LT Family | Software for professional design, drafting, detailing, and visualization. |
| Architecture Engineering And Construction | Solutions including AutoCAD Civil 3D and BIM 360 for civil engineering and construction management. |
| Manufacturing | Tools like Fusion 360 and Inventor for 3D CAD, CAM, simulation, and manufacturing workflows. |
| Media And Entertainment | Maya, 3ds Max, and ShotGrid software for 3D modeling, animation, effects, and production tracking. |
| Other | Miscellaneous products and services not classified in the main segments. |
Autodesk’s product range spans key sectors: architecture, manufacturing, and media. Each brand targets specialized professional workflows, driving steady revenue growth across segments.
Main Competitors
Among 33 competitors in the Software – Application industry, the top 10 leaders by market capitalization are:
| Competitor | Market Cap. |
|---|---|
| Salesforce, Inc. | 242.5B |
| Shopify Inc. | 209.6B |
| AppLovin Corporation | 209.0B |
| Intuit Inc. | 175.2B |
| Uber Technologies, Inc. | 172.2B |
| ServiceNow, Inc. | 153.0B |
| Cadence Design Systems, Inc. | 84.5B |
| Snowflake Inc. | 73.4B |
| Autodesk, Inc. | 61.2B |
| Workday, Inc. | 54.9B |
Autodesk ranks 9th among its top 10 competitors by market cap. It holds 22.3% of the market cap of Salesforce, the sector leader. Autodesk is below the average market cap of the top 10 but above the median for the sector. The company maintains a 36% market cap premium over its closest competitor above, Snowflake Inc.
Comparisons with competitors
Check out how we compare the company to its competitors:
Does Autodesk have a competitive advantage?
Autodesk demonstrates a clear competitive advantage, supported by a very favorable moat rating and a ROIC exceeding WACC by 8.57%, indicating value creation. Its growing ROIC trend of 62.3% over 2022-2026 signals improving capital efficiency and profitability.
Looking ahead, Autodesk’s extensive product portfolio spans 3D design, engineering, and entertainment software, serving diverse industries globally. Expansion in cloud-based solutions and emerging markets offers significant growth opportunities, reinforcing its competitive positioning.
SWOT Analysis
This SWOT analysis identifies Autodesk’s key internal and external factors shaping its strategic outlook.
Strengths
- strong 90% gross margin
- robust 37% ROE
- sustainable competitive advantage with growing ROIC
Weaknesses
- high P/E at 48 signals expensive valuation
- low current ratio at 0.85 raises liquidity concerns
- no dividend yield limits income appeal
Opportunities
- expanding cloud-based software adoption
- growth in Asia Pacific and EMEA markets
- increasing demand for 3D design in emerging industries
Threats
- intense competition in software sector
- rapid technology changes require continuous innovation
- economic downturns could reduce capital spending
Autodesk’s strengths in profitability and moat support its premium valuation but pose valuation risks. The company must leverage growth markets and innovation to offset competitive and liquidity challenges.
Stock Price Action Analysis
The following weekly stock chart displays Autodesk, Inc.’s price movements over the past 12 months:
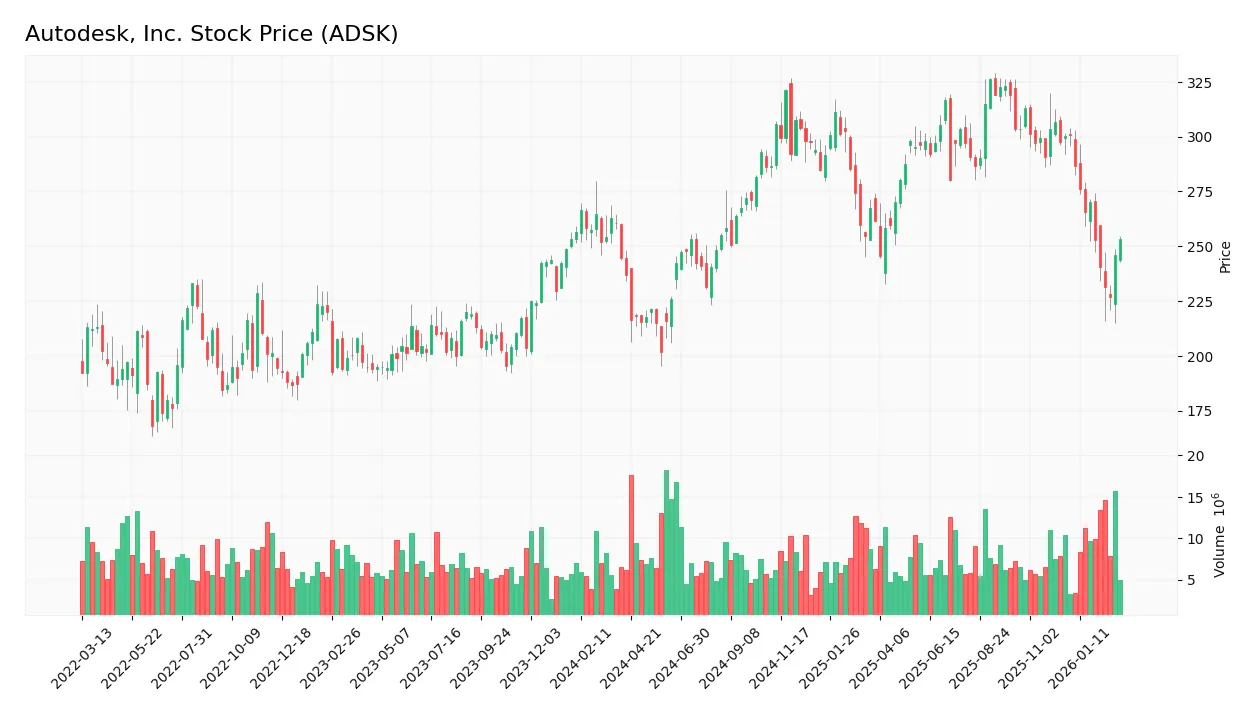
Trend Analysis
Over the past 12 months, ADSK’s stock price increased by 6.93%, indicating a bullish trend with deceleration. The price ranged from a low of 201.6 to a high of 326.37. Volatility remains elevated with a standard deviation of 30.67.
Volume Analysis
In the last three months, trading volume is increasing but seller dominance prevails, with buyers at 39.08%. This suggests weakening investor confidence and higher selling pressure despite rising activity.
Target Prices
Analysts set a clear target consensus for Autodesk, Inc., reflecting solid confidence in its growth trajectory.
| Target Low | Target High | Consensus |
|---|---|---|
| 279 | 380 | 342 |
The target range spans 279 to 380, with a consensus near 342, indicating bullish expectations amid steady sector performance.

Don’t Let Luck Decide Your Entry Point
Optimize your entry points with our advanced ProRealTime indicators. You’ll get efficient buy signals with precise price targets for maximum performance. Start outperforming now!
Analyst & Consumer Opinions
This section reviews Autodesk, Inc.’s recent analyst ratings and consumer feedback to gauge market sentiment and user satisfaction.
Stock Grades
Here are the most recent verified stock grades for Autodesk, Inc. from leading financial institutions:
| Grading Company | Action | New Grade | Date |
|---|---|---|---|
| Piper Sandler | Maintain | Overweight | 2026-03-02 |
| Wells Fargo | Maintain | Overweight | 2026-02-27 |
| DA Davidson | Maintain | Buy | 2026-02-27 |
| BTIG | Maintain | Buy | 2026-02-27 |
| Rosenblatt | Maintain | Buy | 2026-02-27 |
| Barclays | Maintain | Overweight | 2026-02-27 |
| Macquarie | Maintain | Outperform | 2026-02-27 |
| RBC Capital | Maintain | Outperform | 2026-02-27 |
| Rosenblatt | Maintain | Buy | 2026-02-24 |
| Oppenheimer | Maintain | Outperform | 2026-02-24 |
The consensus among analysts strongly favors Autodesk with consistent “Buy,” “Overweight,” and “Outperform” ratings. There is no recent downgrade, indicating stable positive sentiment in the market.
Consumer Opinions
Autodesk, Inc. consistently garners attention for its innovative design software, sparking strong opinions among its user base.
| Positive Reviews | Negative Reviews |
|---|---|
| Intuitive interface accelerates design workflows. | Steep learning curve for new users. |
| Robust cloud collaboration enhances teamwork. | Subscription pricing feels expensive. |
| Frequent updates introduce valuable features. | Customer support response time can lag. |
| Software stability impresses in complex projects. | Occasional bugs disrupt critical deadlines. |
Overall, consumers praise Autodesk’s cutting-edge tools and collaboration features. However, price sensitivity and onboarding challenges remain common concerns, signaling room for improvement in user experience and support.
Risk Analysis
Below is a summary of key risks facing Autodesk, Inc. considering their likelihood and potential impact:
| Category | Description | Probability | Impact |
|---|---|---|---|
| Valuation Risk | Elevated P/E (47.9) and P/B (17.7) ratios suggest overvaluation. | High | High |
| Liquidity Risk | Current ratio at 0.85 indicates potential short-term liquidity issues. | Moderate | Moderate |
| Debt Risk | Debt-to-equity ratio is neutral (0.9), but low interest coverage risk. | Low | Low |
| Market Volatility | Beta of 1.47 implies above-market price swings. | High | Moderate |
| Growth Execution | Reliance on continual innovation in competitive software sector. | Moderate | High |
Autodesk’s valuation multiples stand out as the most pressing risk. The P/E and P/B ratios far exceed industry averages, raising concerns about a market correction. The current ratio below 1 signals possible liquidity strain during downturns. However, strong return metrics and a safe Altman Z-score mitigate bankruptcy risk. I remain cautious but see resilience backed by solid cash flow and market position.
Should You Buy Autodesk, Inc.?
Autodesk appears to be a robust value creator with a durable competitive moat strengthened by growing ROIC well above WACC. Despite a manageable leverage profile, valuation metrics suggest caution. Overall, the company’s financial health could be seen as very favorable with a B- rating.
Strength & Efficiency Pillars
Autodesk, Inc. demonstrates robust operational efficiency with a net margin of 15.6% and a return on equity (ROE) of 36.91%. Its return on invested capital (ROIC) stands at 18.74%, comfortably exceeding the weighted average cost of capital (WACC) at 10.17%. This confirms Autodesk as a clear value creator. The company also boasts a very strong Piotroski score of 8, signaling solid financial health and operational strength. Such metrics reflect a sustainable competitive advantage with growing profitability over the 2022-2026 period.
Weaknesses and Drawbacks
Despite strong fundamentals, Autodesk faces significant valuation headwinds. The price-to-earnings (P/E) ratio at 47.92 and price-to-book (P/B) ratio at 17.69 indicate a stretched premium valuation, which could limit upside. Additionally, the current ratio of 0.85 signals liquidity concerns, posing potential short-term financial strain. Recent market activity shows seller dominance with only 39.08% buyer volume, suggesting near-term pressure and volatility risks. These factors warrant caution despite the company’s operational strengths.
Our Final Verdict about Autodesk, Inc.
Autodesk’s long-term fundamentals appear attractive due to its value creation and solid profitability. However, despite a bullish overall stock trend, the recent seller dominance suggests a wait-and-see approach may be prudent. The current premium valuation and liquidity risks imply that investors might consider waiting for a more favorable entry point before increasing exposure. The profile suggests potential but carries near-term market and valuation headwinds that cannot be ignored.
Disclaimer: This content is for informational purposes only and does not constitute financial, investment, or other professional advice. Investing in financial markets involves a significant risk of loss, and past performance is not indicative of future results.
Additional Resources
- Autodesk, Inc. $ADSK Shares Sold by AustralianSuper Pty Ltd – MarketBeat (Mar 04, 2026)
- AUTODESK, INC. ANNOUNCES FISCAL 2026 FOURTH QUARTER RESULTS – PR Newswire (Feb 26, 2026)
- Autodesk, Inc. (ADSK) Q4 Revenue Surges 19% YoY, Exceeds Guidance Across Key Metrics – Yahoo Finance (Mar 02, 2026)
- Autodesk (NASDAQ: ADSK) grows revenue 18% and sharply lifts cash flow – Stock Titan (Mar 03, 2026)
- ADSK Earnings History & Surprises | EPS & Revenue Results | AUTODESK INC (NASDAQ:ADSK) – ChartMill (Mar 02, 2026)
For more information about Autodesk, Inc., please visit the official website: autodesk.com