Home > Analyses > Industrials > ATS Corporation
ATS Corporation transforms the manufacturing landscape by delivering cutting-edge automation solutions that power industries worldwide. Renowned for its expertise in designing, building, and servicing automated manufacturing systems, ATS leads with innovative technologies that enhance operational efficiency across sectors like life sciences, transportation, and consumer products. As the company advances its digital and software capabilities, investors must consider whether ATS’s strong market position and growth prospects justify its current valuation and future potential.
Table of contents
Business Model & Company Overview
ATS Corporation, founded in 1978 and headquartered in Cambridge, Canada, stands as a leader in the industrial machinery sector. With a core mission centered on delivering comprehensive automation solutions, ATS integrates planning, design, manufacturing, and servicing into a seamless ecosystem that spans multiple industries, including life sciences and transportation. Its evolution from ATS Automation Tooling Systems Inc. to its current identity in 2022 reflects a commitment to innovation and global industrial impact.
The company’s revenue engine thrives on a balanced mix of hardware manufacturing, software development, and recurring services such as maintenance and process optimization. ATS leverages its extensive capabilities—from engineering and prototyping to digital factory management—across key markets in the Americas, Europe, and Asia. This strategic global presence, combined with its diverse service portfolio, fortifies ATS’s competitive advantage and cements its role in shaping the future of automation technology.
Financial Performance & Fundamental Metrics
I will analyze ATS Corporation’s income statement, key financial ratios, and dividend payout policy to provide a clear view of its financial health and shareholder returns.
Income Statement
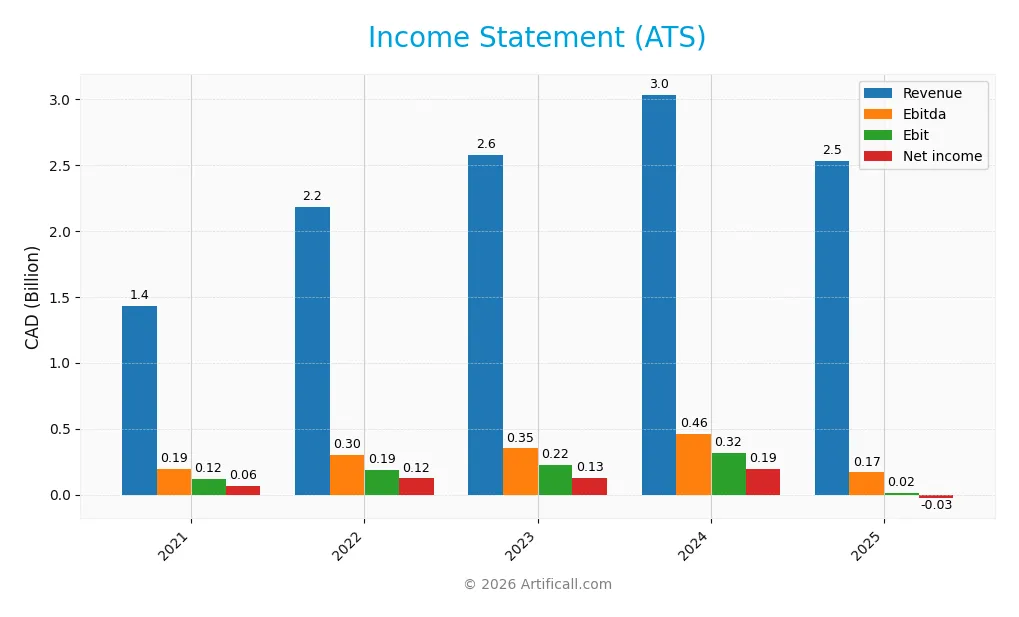
The table below summarizes ATS Corporation’s key income statement figures for the fiscal years 2021 through 2025, reported in CAD.
| 2021 | 2022 | 2023 | 2024 | 2025 | |
|---|---|---|---|---|---|
| Revenue | 1.43B | 2.18B | 2.58B | 3.03B | 2.53B |
| Cost of Revenue | 1.05B | 1.57B | 1.85B | 2.18B | 1.89B |
| Operating Expenses | 265M | 426M | 503M | 540M | 637M |
| Gross Profit | 384M | 612M | 726M | 856M | 647M |
| EBITDA | 192M | 303M | 350M | 459M | 168M |
| EBIT | 121M | 187M | 224M | 317M | 15.3M |
| Interest Expense | 41.8M | 32.7M | 64.7M | 70.7M | 98.2M |
| Net Income | 64.1M | 122M | 127M | 194M | -28M |
| EPS | 0.70 | 1.32 | 1.39 | 1.98 | -0.29 |
| Filing Date | 2021-03-31 | 2022-03-31 | 2023-03-31 | 2024-03-31 | 2025-05-29 |
Income Statement Evolution
ATS Corporation’s revenue increased by 77.15% from 2021 to 2025, but declined 16.47% in the last year, reflecting volatility in top-line growth. Gross margin remained favorable at 25.53%, yet EBIT margin contracted significantly to 0.6%, indicating pressure on operating profitability. Net income and net margin deteriorated sharply over the period, with net income turning negative in 2025.
Is the Income Statement Favorable?
The latest fiscal year ended with a net loss of 28M CAD and a negative net margin of -1.11%, marking a substantial decline from prior years. EBIT margin is neutral at 0.6%, while interest expenses remain favorable at 3.88% of revenue. Despite a solid gross margin, the overall fundamentals are unfavorable due to significant declines in net income and earnings per share, signaling earnings and profitability challenges.
Financial Ratios
The table below presents key financial ratios of ATS Corporation over the fiscal years 2021 to 2025, providing insight into profitability, valuation, liquidity, leverage, and efficiency:
| Ratios | 2021 | 2022 | 2023 | 2024 | 2025 |
|---|---|---|---|---|---|
| Net Margin | 4.5% | 5.6% | 4.9% | 6.4% | -1.1% |
| ROE | 9.0% | 12.4% | 11.3% | 11.5% | -1.6% |
| ROIC | 7.8% | 6.5% | 7.0% | 8.0% | 0.1% |
| P/E | 38.3 | 33.9 | 40.6 | 22.9 | -125.3 |
| P/B | 3.4 | 4.2 | 4.6 | 2.6 | 2.1 |
| Current Ratio | 1.40 | 1.36 | 1.39 | 1.70 | 1.69 |
| Quick Ratio | 1.17 | 1.11 | 1.15 | 1.42 | 1.41 |
| D/E | 0.57 | 1.12 | 1.12 | 0.77 | 1.00 |
| Debt-to-Assets | 23.2% | 35.9% | 35.5% | 31.5% | 36.8% |
| Interest Coverage | 2.9 | 5.7 | 3.4 | 4.5 | 0.1 |
| Asset Turnover | 0.82 | 0.71 | 0.73 | 0.74 | 0.55 |
| Fixed Asset Turnover | 7.1 | 7.2 | 7.2 | 7.5 | 5.7 |
| Dividend Yield | 0% | 0% | 0% | 0% | 0% |
Evolution of Financial Ratios
From 2021 to 2025, ATS Corporation’s Return on Equity (ROE) showed a declining trend, turning negative at -1.64% in 2025, indicating reduced profitability. The Current Ratio remained stable around 1.4 to 1.7, suggesting consistent liquidity. The Debt-to-Equity Ratio fluctuated and closed at 1.0 in 2025, reflecting a neutral leverage position. Profitability notably weakened in the most recent year.
Are the Financial Ratios Fovorable?
In 2025, ATS’s profitability ratios, including net margin (-1.11%) and ROE (-1.64%), were unfavorable, while the Price-to-Earnings ratio was favorable despite being negative. Liquidity ratios such as Current Ratio (1.69) and Quick Ratio (1.41) were favorable, supporting short-term financial stability. Leverage and asset efficiency ratios were mostly neutral. Overall, the global evaluation of financial ratios is slightly unfavorable, with 36% unfavorable and 28% favorable ratios.
Shareholder Return Policy
ATS Corporation does not pay dividends, reflecting its recent negative net profit margin of -1.1% in 2025 and ongoing reinvestment needs. The company’s free cash flow per share is negative, indicating limited capacity for cash distributions, though it has not engaged in share buybacks.
This approach aligns with a focus on sustaining long-term value through reinvestment rather than immediate shareholder returns. However, persistent losses and negative free cash flow highlight risks to financial stability that might affect future returns.
Score analysis
The following radar chart presents a visual summary of ATS Corporation’s key financial evaluation scores:
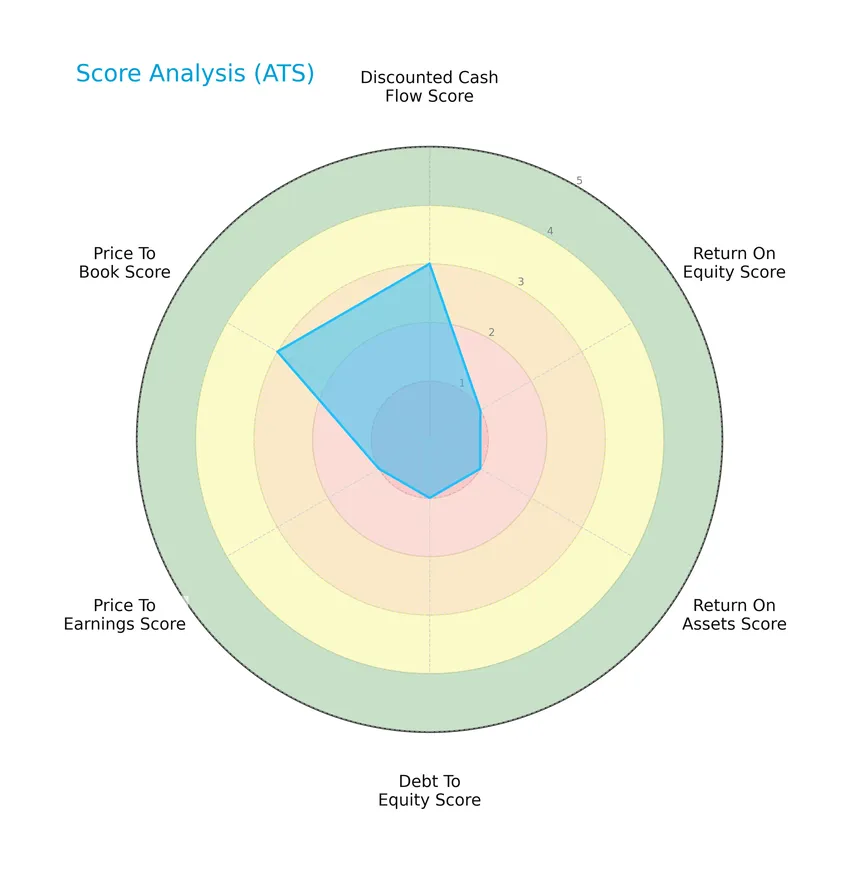
ATS Corporation’s scores reveal a mixed financial picture, with a moderate discounted cash flow and price-to-book score of 3. However, return on equity, return on assets, debt to equity, and price to earnings scores are all very unfavorable at 1, indicating significant challenges in profitability, leverage, and valuation metrics.
Analysis of the company’s bankruptcy risk
The Altman Z-Score places ATS Corporation in the distress zone, indicating a high risk of financial distress and potential bankruptcy:

Is the company in good financial health?
The following Piotroski diagram illustrates ATS Corporation’s financial health based on key accounting criteria:

With a Piotroski Score of 3, ATS Corporation is classified as very weak in financial health, suggesting several operational and financial weaknesses that could concern investors.
Competitive Landscape & Sector Positioning
This sector analysis will examine ATS Corporation’s strategic positioning, revenue by segment, key products, main competitors, competitive advantages, and SWOT analysis. I will assess whether ATS Corporation holds a competitive advantage over its industry peers.
Strategic Positioning
ATS Corporation has a diversified geographic exposure with significant revenue from the United States (1.04B CAD), Other Europe (599M CAD), Germany (251M CAD), Italy (88M CAD), and other countries (427M CAD). Its product portfolio covers automation solutions across multiple industries globally.
Key Products & Brands
The table below outlines ATS Corporation’s main products and service offerings:
| Product | Description |
|---|---|
| Automation Solutions | Design, build, commissioning, and servicing of automated manufacturing and assembly systems worldwide. |
| Pre-Automation Services | Discovery, analysis, concept development, simulation, and total cost of ownership modelling. |
| Post-Automation Services | Training, process optimization, preventative maintenance, emergency support, spare parts, retooling, retrofits, equipment relocation. |
| Contract Manufacturing Services | Manufacturing services including engineering design, prototyping, process verification, software and process controls development. |
| Standard Automation Products/Platforms | Equipment design and build, third-party equipment qualification, procurement, integration, installation, commissioning, validation, and documentation. |
| Software and Digital Solutions | Connected factory floor management systems for real-time machine data analysis, troubleshooting, downtime prevention, and efficiency improvements. |
ATS Corporation provides comprehensive automation and manufacturing solutions with a broad portfolio spanning engineering, software, and after-sales services, serving multiple industrial sectors globally.
Main Competitors
There are 24 competitors in the Industrials sector, with the table below listing the top 10 leaders by market capitalization:
| Competitor | Market Cap. |
|---|---|
| Eaton Corporation plc | 127.1B |
| Parker-Hannifin Corporation | 114.2B |
| Howmet Aerospace Inc. | 85.2B |
| Emerson Electric Co. | 76.3B |
| Illinois Tool Works Inc. | 73.0B |
| Cummins Inc. | 71.9B |
| AMETEK, Inc. | 48.3B |
| Roper Technologies, Inc. | 46.8B |
| Rockwell Automation, Inc. | 44.8B |
| Symbotic Inc. | 35.9B |
ATS Corporation ranks 23rd among 24 competitors in the Industrial – Machinery industry. Its market capitalization is only 2.26% of the leader Eaton Corporation plc’s 127.1B. ATS is positioned well below both the average market cap of the top 10 competitors (72.4B) and the sector median (32.4B). The company maintains a 16.66% market cap gap with its closest competitor above, indicating a significant scale difference within the sector.
Does ATS have a competitive advantage?
ATS Corporation does not currently present a competitive advantage, as evidenced by its very unfavorable moat status, declining ROIC trend, and ROIC significantly below WACC, indicating value destruction and decreasing profitability. The company’s income statement evaluation is mostly unfavorable, with negative net margins and shrinking EBIT, further reflecting operational challenges.
Looking ahead, ATS serves diverse markets including life sciences, transportation, and energy, and offers a broad portfolio of automation solutions and digital factory management systems. These product and market opportunities could provide avenues for future growth, though current financial metrics highlight caution regarding sustained competitive strength.
Comparisons with competitors
Check out how we compare the company to its competitors:
SWOT Analysis
This SWOT analysis highlights ATS Corporation’s current strategic position by evaluating its internal strengths and weaknesses alongside external opportunities and threats.
Strengths
- diversified global presence
- strong industrial automation expertise
- favorable gross margin of 25.53%
Weaknesses
- declining net margin at -1.11%
- unfavorable revenue and profit growth in recent year
- weak financial health scores (Altman Z in distress zone)
Opportunities
- expanding automation demand in life sciences and energy sectors
- potential growth in connected factory floor management
- increasing need for process optimization and digital solutions
Threats
- intense competition in automation space
- economic downturn impacting industrial spending
- technological disruptions requiring continuous innovation
Overall, ATS Corporation shows solid operational strengths but faces significant financial and profitability challenges. The company must leverage growth opportunities in automation and digitalization while addressing its financial weaknesses to improve investor confidence and long-term sustainability.
Stock Price Action Analysis
The weekly stock chart for ATS Corporation illustrates price movements and volatility over the past 100 weeks:
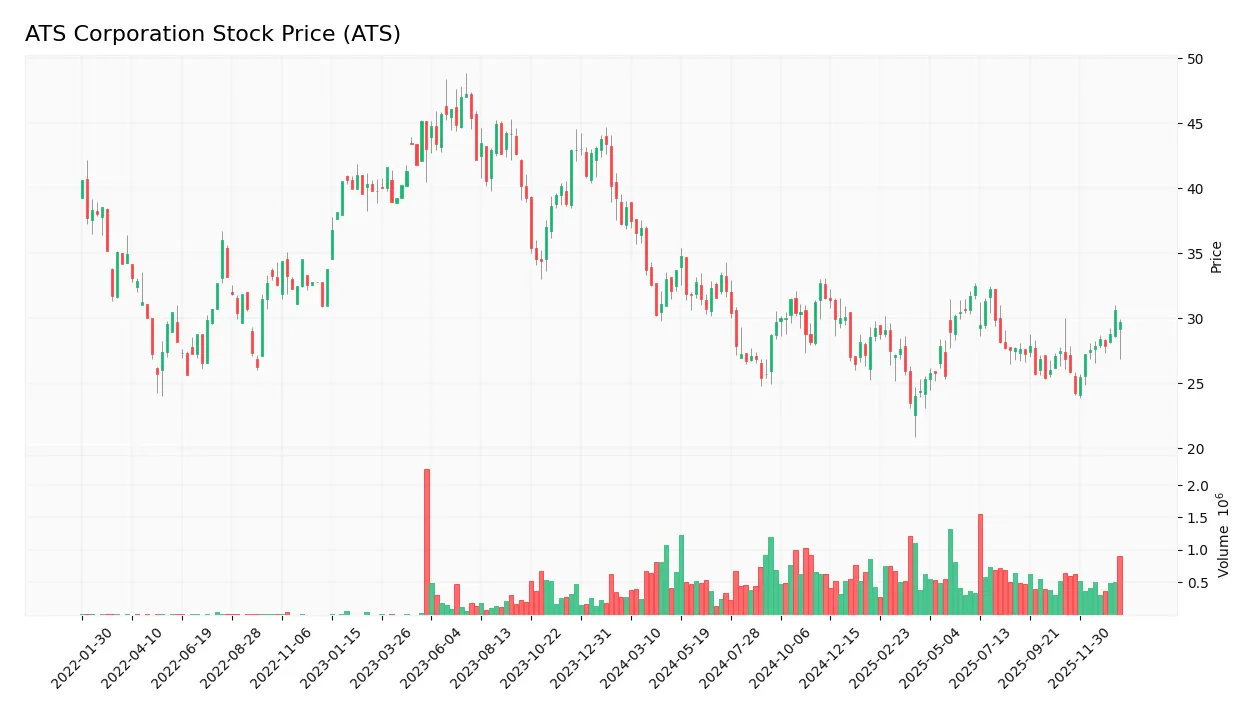
Trend Analysis
Over the past 12 months, ATS stock price declined by 23.05%, indicating a bearish trend with accelerating downward momentum. The stock showed notable volatility with a standard deviation of 2.98. The highest price reached 38.57, the lowest 23.5, highlighting a wide trading range and intensified selling pressure over this period.
Volume Analysis
Trading volume over the last three months shows a nearly balanced buyer-seller distribution with buyer volume at 3.11M and seller volume at 3.14M. Buyer dominance is neutral at 49.8%, while overall volume is increasing. This balanced activity suggests cautious investor sentiment and steady market participation without clear directional bias.
Target Prices
The consensus target price for ATS Corporation stands firmly at 34.
| Target High | Target Low | Consensus |
|---|---|---|
| 34 | 34 | 34 |
Analysts uniformly expect the stock to reach 34, indicating a clear and consistent outlook with limited variance among forecasts.
Analyst & Consumer Opinions
This section examines recent analyst grades and consumer feedback related to ATS Corporation’s market performance and reputation.

Don’t Let Luck Decide Your Entry Point
Optimize your entry points with our advanced ProRealTime indicators. You’ll get efficient buy signals with precise price targets for maximum performance. Start outperforming now!
Stock Grades
Here is the latest verified grading data for ATS Corporation from recognized financial institutions:
| Grading Company | Action | New Grade | Date |
|---|---|---|---|
| JP Morgan | Maintain | Neutral | 2026-01-16 |
| JP Morgan | Maintain | Neutral | 2024-08-13 |
| Goldman Sachs | Maintain | Sell | 2024-08-13 |
| JP Morgan | Maintain | Neutral | 2024-05-24 |
The consensus rating for ATS is “Hold,” reflecting a balanced outlook with JP Morgan consistently neutral and Goldman Sachs maintaining a sell rating. This suggests cautious investor sentiment without strong momentum in either direction.
Consumer Opinions
Consumers have expressed a mix of enthusiasm and concern regarding ATS Corporation, reflecting a balanced view of the company’s performance and service quality.
| Positive Reviews | Negative Reviews |
|---|---|
| “ATS Corporation offers reliable products with excellent durability.” | “Customer service response times are often slow and unhelpful.” |
| “I appreciate the innovative features and user-friendly design.” | “Pricing seems higher compared to competitors for similar quality.” |
| “The company’s commitment to sustainability is impressive.” | “Occasional delays in product delivery have been frustrating.” |
Overall, consumers praise ATS Corporation for product reliability and innovation but frequently point out issues with customer support and pricing as areas needing improvement.
Risk Analysis
Below is a table summarizing the key risks related to ATS Corporation, highlighting their likelihood and potential impact:
| Category | Description | Probability | Impact |
|---|---|---|---|
| Financial Stability | ATS is in the distress zone with an Altman Z-Score of 1.71, signaling a moderate to high bankruptcy risk. | High | High |
| Profitability | The company posted negative net margin (-1.11%) and ROE (-1.64%), indicating ongoing profitability challenges. | High | High |
| Liquidity | Despite favorable current (1.69) and quick ratios (1.41), interest coverage is very low (0.16), risking solvency under stress. | Moderate | Medium |
| Debt Management | Debt to equity ratio is 1.0 and debt to assets 36.8%, showing moderate leverage but with unfavorable coverage. | Moderate | Medium |
| Market Valuation | Negative P/E ratio (-125) signals losses; valuation may be weak despite a neutral PB (2.06). | High | Medium |
| Operational Risk | Beta of 1.268 indicates higher stock volatility compared to the market, implying increased market risk. | Moderate | Medium |
| Dividend Policy | No dividend yield raises concerns for income-focused investors and may reflect cash flow constraints. | High | Low |
The most critical risks are ATS’s elevated bankruptcy risk and persistent unprofitability, as confirmed by its distress-zone Altman Z-Score and negative profitability metrics. Additionally, low interest coverage heightens solvency concerns. Investors should monitor these financial health indicators closely while considering the stock’s volatility and valuation challenges.
Should You Buy ATS Corporation?
ATS Corporation appears to be experiencing deteriorating profitability and a very unfavorable competitive moat, suggesting value erosion and declining operational efficiency. Despite a manageable liquidity profile, its leverage and financial strength ratings are weak, resulting in an overall C rating that could be seen as cautious.
Strength & Efficiency Pillars
ATS Corporation exhibits moderate financial health, supported by a current ratio of 1.69 and a quick ratio of 1.41, indicating reasonable short-term liquidity. The company maintains a gross margin of 25.53%, reflecting operational efficiency in controlling production costs. However, profitability metrics remain weak, with a net margin of -1.11% and return on equity at -1.64%, signaling operational challenges. The company is not a value creator as its ROIC stands at a mere 0.09%, significantly below the WACC of 8.11%, highlighting value destruction. Additionally, the Altman Z-Score of 1.71 places ATS in the distress zone, raising concerns about financial stability.
Weaknesses and Drawbacks
Several unfavorable indicators cast a shadow over ATS’s investment case. The negative net margin and a severely declining EBIT growth of -95.18% over one year reflect deteriorating profitability. Leverage is moderate with a debt-to-equity ratio of 1.0, but interest coverage is critically low at 0.16, suggesting difficulty servicing debt. Valuation metrics are mixed; despite a favorable negative P/E ratio of -125.28, the price-to-book ratio of 2.06 is neutral, indicating neither strong undervaluation nor overvaluation. Market pressure is observable in a bearish overall stock trend with a -23.05% price change, though recent buyer and seller volumes are nearly balanced, showing neutral short-term sentiment.
Our Verdict about ATS Corporation
The long-term fundamental profile of ATS Corporation is unfavorable, characterized by persistent value destruction and weak profitability. The bearish overall market trend reinforces caution, despite a recent modest price recovery and neutral buyer behavior. Given the financial distress signals and operational struggles, ATS might appear unsuitable for aggressive investment at this stage. However, the recent stabilization in trading volume and slight upward price movement could suggest a potential wait-and-see approach for investors seeking a better entry point.
Disclaimer: This content is for informational purposes only and does not constitute financial, investment, or other professional advice. Investing in financial markets involves a significant risk of loss, and past performance is not indicative of future results.
Additional Resources
- ATS Announces CFO Resignation – Business Wire (Jan 19, 2026)
- Why ATS Corporation Shares Are Sliding Despite Growth – TipRanks (Jan 20, 2026)
- Stifel Maintains ATS Corp(ATS.US) With Buy Rating, Raises Target Price to $37.71 – 富途资讯 (Jan 23, 2026)
- ATS to Host Third Quarter Earnings Call Wednesday February 4, 2026, at 8:30 a.m. Eastern – The Globe and Mail (Jan 23, 2026)
- Ryan McLeod Resigns as CFO of ATS Corporation – GuruFocus (Jan 19, 2026)
For more information about ATS Corporation, please visit the official website: atsautomation.com