Home > Analyses > Utilities > Atmos Energy Corporation
Atmos Energy Corporation powers millions of homes and businesses with reliable natural gas, quietly shaping daily life across eight U.S. states. As a key player in the regulated gas industry, Atmos boasts a vast distribution network and robust pipeline and storage operations, underpinned by decades of expertise and operational excellence. Renowned for its steady growth and dividend reliability, the company’s fundamentals invite a deeper look—does its current valuation still reflect its growth and stability in a transforming energy landscape?

Table of contents
Business Model & Company Overview
Atmos Energy Corporation, founded in 1906 and headquartered in Dallas, Texas, stands as a dominant player in the regulated natural gas sector. Its integrated ecosystem spans natural gas distribution, pipeline, and storage operations, serving approximately three million customers across eight states. The company’s extensive infrastructure includes over 71,900 miles of underground distribution and transmission mains, complemented by nearly 5,700 miles of gas transmission lines, positioning it at the core of America’s energy delivery network.
The company’s revenue engine balances stable, regulated natural gas distribution with pipeline transportation and storage services, creating diversified income streams. Atmos Energy’s operations primarily focus on the US market, leveraging its scale and regulatory framework to maintain steady cash flows. Its strategic asset base and service offerings form a resilient economic moat, underpinning its critical role in shaping the future of natural gas infrastructure and utility services.
Financial Performance & Fundamental Metrics
In this section, I analyze Atmos Energy Corporation’s income statement, key financial ratios, and dividend payout policy to assess its fundamental strength.
Income Statement
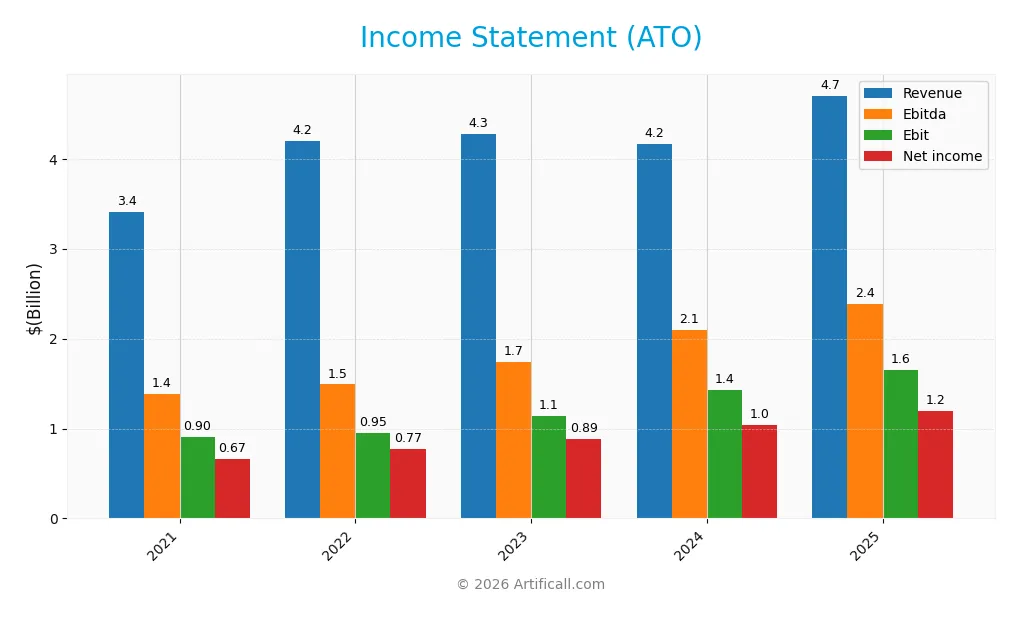
The table below presents Atmos Energy Corporation’s key income statement figures for fiscal years 2021 through 2025, reflecting revenue, expenses, profits, and earnings per share.
| 2021 | 2022 | 2023 | 2024 | 2025 | |
|---|---|---|---|---|---|
| Revenue | 3.41B | 4.20B | 4.28B | 4.17B | 4.70B |
| Cost of Revenue | 1.71B | 2.39B | 2.22B | 1.75B | 2.24B |
| Operating Expenses | 791M | 888M | 991M | 1.06B | 903M |
| Gross Profit | 1.70B | 1.81B | 2.06B | 2.41B | 2.46B |
| EBITDA | 1.38B | 1.49B | 1.74B | 2.10B | 2.38B |
| EBIT | 903M | 955M | 1.14B | 1.43B | 1.65B |
| Interest Expense | 84M | 103M | 137M | 191M | 172M |
| Net Income | 666M | 774M | 885M | 1.04B | 1.20B |
| EPS | 5.12 | 5.62 | 6.10 | 6.83 | 7.54 |
| Filing Date | 2021-11-12 | 2022-11-14 | 2023-11-14 | 2024-11-18 | 2025-11-14 |
Income Statement Evolution
Atmos Energy Corporation’s revenue increased steadily from 3.41B in 2021 to 4.70B in 2025, reflecting a 38.01% growth over the period. Net income showed a strong 80.11% rise, reaching 1.20B in 2025. Gross margin remained stable around 52%, while EBIT and net margins improved, indicating better profitability and operational efficiency throughout these years.
Is the Income Statement Favorable?
In 2025, Atmos Energy delivered revenue growth of 12.91% and a 15.65% increase in EBIT, with net margin expanding modestly to 25.49%. Interest expense as a percentage of revenue was controlled at 3.65%, supporting healthy earnings. Overall, 85.71% of key income statement metrics are favorable, suggesting solid financial fundamentals and consistent performance in the most recent fiscal year.
Financial Ratios
The table below presents key financial ratios for Atmos Energy Corporation over the past five fiscal years, offering a concise view of profitability, efficiency, liquidity, leverage, and shareholder returns:
| Ratios | 2021 | 2022 | 2023 | 2024 | 2025 |
|---|---|---|---|---|---|
| Net Margin | 20.0% | 18.4% | 20.7% | 25.0% | 25.5% |
| ROE | 8.42% | 8.22% | 8.14% | 8.58% | 8.84% |
| ROIC | 3.97% | 3.98% | 4.41% | 4.76% | 4.58% |
| P/E | 17.2 | 18.1 | 17.4 | 20.3 | 22.6 |
| P/B | 1.45 | 1.49 | 1.41 | 1.74 | 2.00 |
| Current Ratio | 0.81 | 0.85 | 0.65 | 0.94 | 0.67 |
| Quick Ratio | 0.75 | 0.74 | 0.45 | 0.78 | 0.53 |
| D/E | 0.96 | 0.89 | 0.66 | 0.67 | 0.69 |
| Debt-to-Assets | 38.6% | 37.7% | 31.6% | 32.3% | 32.2% |
| Interest Coverage | 10.8 | 9.0 | 7.8 | 7.1 | 9.1 |
| Asset Turnover | 0.17 | 0.19 | 0.19 | 0.17 | 0.16 |
| Fixed Asset Turnover | 0.22 | 0.24 | 0.22 | 0.19 | 0.18 |
| Dividend Yield | 2.83% | 2.68% | 2.80% | 2.33% | 2.04% |
Evolution of Financial Ratios
From 2021 to 2025, Atmos Energy Corporation’s Return on Equity (ROE) showed a slight fluctuation but remained relatively stable, ending at 8.84% in 2025. The Current Ratio declined from around 0.81 in 2021 to 0.67 in 2025, indicating reduced short-term liquidity. The Debt-to-Equity Ratio held steady near 0.69 in 2025, reflecting consistent leverage levels. Profitability margins improved modestly, with net profit margin rising to 25.49%.
Are the Financial Ratios Favorable?
In 2025, profitability metrics such as net margin (25.49%) and interest coverage (9.61) are favorable, while ROE (8.84%) and return on invested capital (4.58%) are unfavorable. Liquidity ratios, including current (0.67) and quick ratio (0.53), are also unfavorable, suggesting tight short-term financial flexibility. Leverage ratios remain neutral, with debt-to-equity at 0.69 and debt-to-assets at 32.19%. Market valuation ratios like P/E (22.64) and P/B (2.0) are neutral. Overall, the ratio profile is slightly unfavorable.
Shareholder Return Policy
Atmos Energy Corporation maintains a consistent dividend payout ratio near 46%-48% with dividend per share rising from $2.50 in 2021 to $3.48 in 2025, yielding about 2.0%-2.8% annually. Despite negative free cash flow coverage, dividends and capital expenditures are funded prudently without excessive share repurchases.
The company’s balanced approach, reflected in a stable dividend yield and moderate payout ratio, supports sustainable long-term value creation. However, negative free cash flow coverage suggests careful monitoring is warranted to avoid distribution risks or overleveraging in buybacks.
Score analysis
The following radar chart illustrates key financial scores relevant to the company’s valuation and operational efficiency:
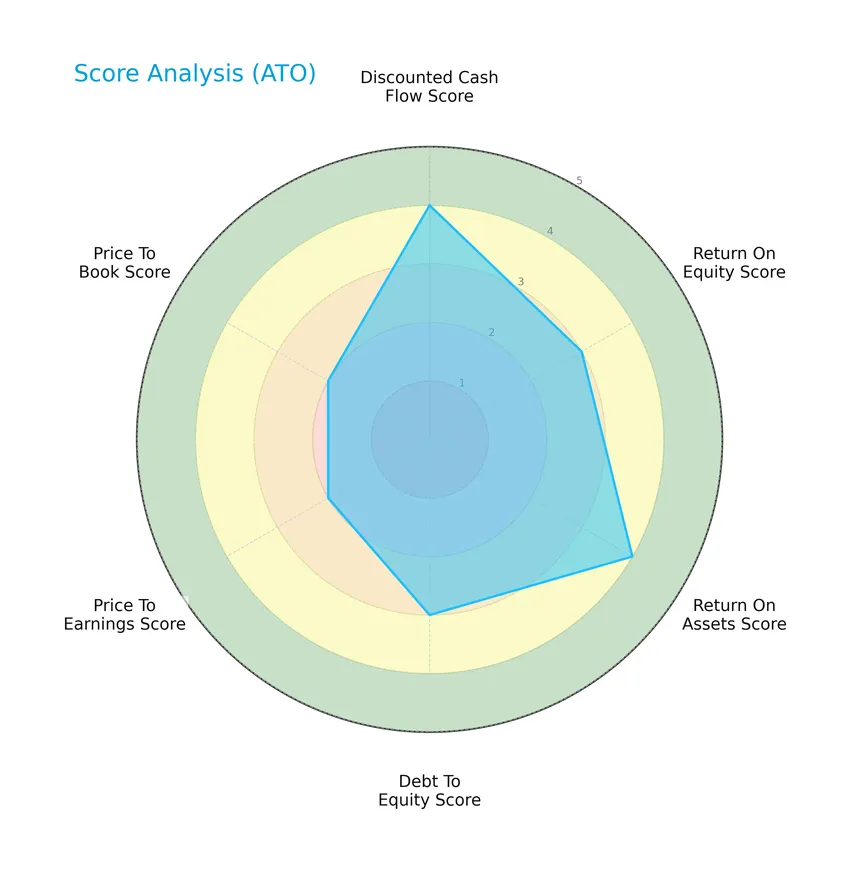
Atmos Energy Corporation’s scores reveal a favorable discounted cash flow and return on assets, moderate return on equity and debt to equity, alongside moderate price to earnings and price to book ratios, indicating a balanced financial profile.
Analysis of the company’s bankruptcy risk
The Altman Z-Score places the company in the distress zone, signaling a higher risk of financial distress and potential bankruptcy:

Is the company in good financial health?
The Piotroski diagram below presents the company’s financial health based on its Piotroski Score:

With a Piotroski Score of 5, Atmos Energy Corporation exhibits average financial health, suggesting moderate strength but room for improvement in its fundamentals.
Competitive Landscape & Sector Positioning
This sector analysis of Atmos Energy Corporation will cover strategic positioning, revenue by segment, key products, main competitors, competitive advantages, and a SWOT analysis. I will assess whether Atmos Energy holds a competitive advantage within the regulated gas utilities sector.
Strategic Positioning
Atmos Energy Corporation maintains a concentrated product portfolio focused on regulated natural gas distribution and pipeline and storage services within the US. Its revenue predominantly stems from the Distribution segment, serving about three million customers across eight states, complemented by pipeline operations primarily in Texas.
Revenue by Segment
This pie chart illustrates Atmos Energy Corporation’s revenue distribution by segment for the fiscal year 2025, highlighting the contribution of each business unit to total revenue.
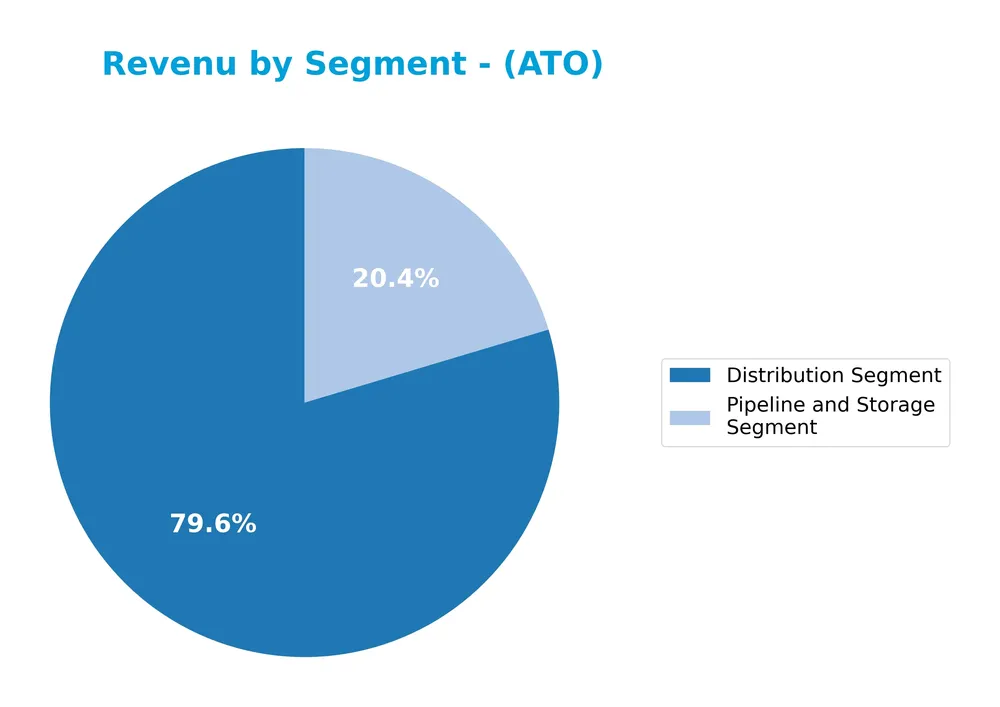
In 2025, Atmos Energy’s revenue is primarily driven by the Distribution Segment, generating 4.4B USD, significantly outweighing the Pipeline and Storage Segment at 1.1B USD. Over recent years, the Distribution Segment has shown consistent growth, reflecting steady demand and expansion. The Pipeline and Storage Segment also grew but at a slower pace, indicating a concentration risk toward distribution. This trend underscores the company’s reliance on its core distribution operations for revenue stability.
Key Products & Brands
The following table presents Atmos Energy Corporation’s main products and brands, detailing their core functions:
| Product | Description |
|---|---|
| Distribution Segment | Regulated natural gas distribution and related sales operations serving ~3M customers across 8 states, with 71,921 miles of underground mains. |
| Pipeline and Storage Segment | Pipeline transportation for third parties, management of 5 underground storage reservoirs in Texas, and ancillary pipeline services including parking, lending, and inventory sales. |
Atmos Energy’s business is primarily divided between natural gas distribution to residential and commercial customers and pipeline and storage operations, reflecting a blend of regulated utility and service activities.
Main Competitors
There are 2 competitors in the sector, with the table below listing the top 10 leaders by market capitalization:
| Competitor | Market Cap. |
|---|---|
| Atmos Energy Corporation | 27.4B |
| NiSource Inc. | 19.8B |
Atmos Energy Corporation ranks 1st among its competitors, holding a market cap roughly 98% of the top leader’s scale. It is positioned above both the average market cap of the top 10 competitors and the median market cap in the sector. The company enjoys a significant 34.8% market cap lead over its closest competitor, NiSource Inc.
Comparisons with competitors
Check out how we compare the company to its competitors:
Does ATO have a competitive advantage?
Atmos Energy Corporation currently presents a slightly unfavorable competitive advantage, as it is shedding value with a ROIC below its WACC, despite showing a growing ROIC trend. This indicates the company is not yet creating excess returns but is improving its profitability over time.
Looking ahead, Atmos Energy’s regulated natural gas distribution and pipeline operations across eight states provide opportunities to expand its customer base of approximately three million. Continued investments in infrastructure and ancillary pipeline services could support future growth and enhance operational efficiency.
SWOT Analysis
This SWOT analysis aims to highlight the key internal and external factors that affect Atmos Energy Corporation’s current position and future prospects.
Strengths
- Regulated natural gas distribution with stable revenue
- Strong net margin at 25.5%
- Growing revenue and net income over recent years
Weaknesses
- Low liquidity ratios (current ratio 0.67, quick ratio 0.53)
- ROE and ROIC below WACC indicating value destruction
- Moderate debt levels with potential leverage risks
Opportunities
- Expansion in pipeline and storage services
- Growing demand for clean energy alternatives
- Potential regulatory support for infrastructure upgrades
Threats
- Regulatory risks impacting tariff structures
- Competition from renewable energy sources
- Market volatility affecting commodity prices
In summary, Atmos Energy benefits from a solid regulated business model and strong profitability metrics but faces challenges in liquidity and return on capital. Strategic focus should be placed on improving operational efficiency and leveraging growth opportunities in infrastructure while carefully managing regulatory and market risks.
Stock Price Action Analysis
The weekly stock chart for Atmos Energy Corporation (ATO) illustrates price movements and key levels over the last 100 weeks:
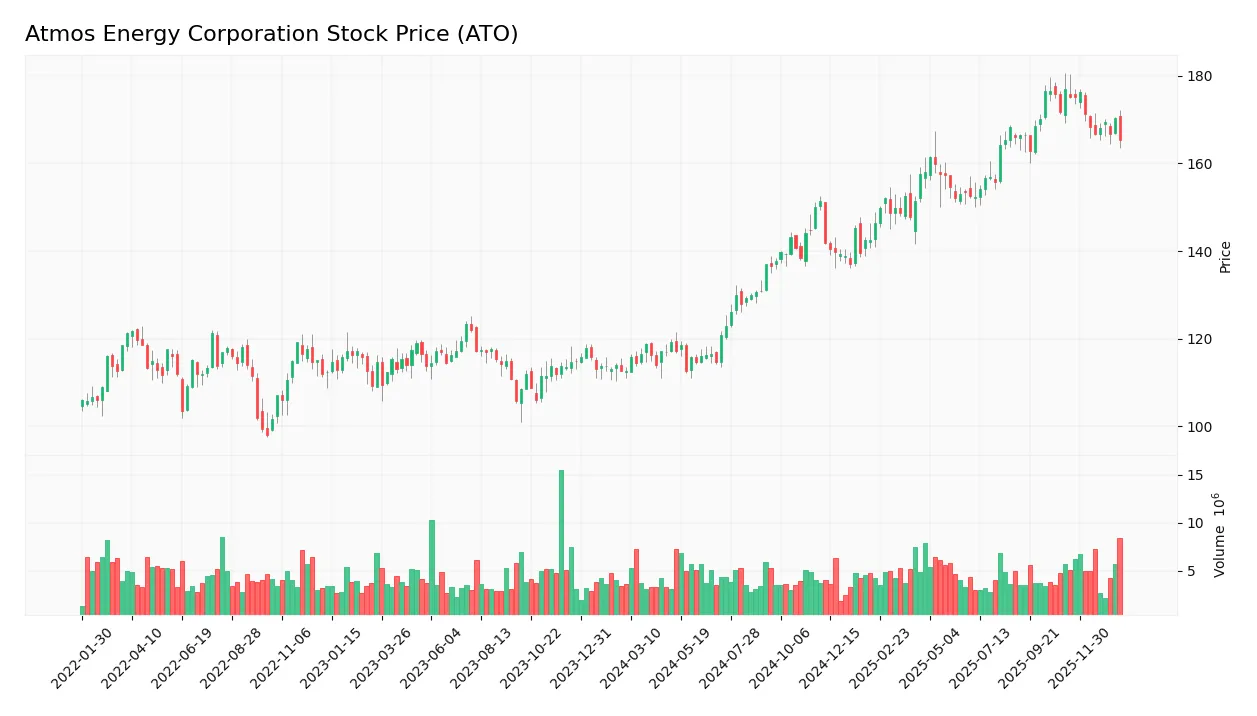
Trend Analysis
Over the past 12 months, ATO’s stock price increased by 46.67%, indicating a bullish trend with deceleration in momentum. The price ranged between a low of 112.61 and a high of 176.91, with a volatility measure of 19.4% standard deviation. However, from November 2025 to January 2026, the trend reversed with a -6.54% drop, showing a short-term bearish slope.
Volume Analysis
In the last three months, trading volume for ATO has been increasing overall, with total volume at 543.5M shares. Buyer volume accounted for 54.52%, suggesting buyer-driven activity historically. Recently, from November 2025 to January 2026, seller volume slightly dominated at 54.48%, indicating a modest shift toward selling pressure and cautious investor sentiment.
Target Prices
The consensus target prices for Atmos Energy Corporation (ATO) indicate a moderately bullish outlook.
| Target High | Target Low | Consensus |
|---|---|---|
| 180 | 165 | 174.2 |
Analysts expect the stock to trade between $165 and $180, with an average target price around $174, suggesting potential upside from current levels.

Don’t Let Luck Decide Your Entry Point
Optimize your entry points with our advanced ProRealTime indicators. You’ll get efficient buy signals with precise price targets for maximum performance. Start outperforming now!
Analyst & Consumer Opinions
This section examines the latest grades and consumer feedback regarding Atmos Energy Corporation to provide insight.
Stock Grades
The following table presents the latest verified stock grades for Atmos Energy Corporation from reputable financial institutions:
| Grading Company | Action | New Grade | Date |
|---|---|---|---|
| Barclays | Maintain | Equal Weight | 2026-01-15 |
| Citigroup | Maintain | Neutral | 2026-01-13 |
| UBS | Maintain | Neutral | 2025-12-17 |
| Morgan Stanley | Downgrade | Equal Weight | 2025-12-16 |
| Mizuho | Maintain | Neutral | 2025-12-02 |
| Morgan Stanley | Maintain | Overweight | 2025-10-22 |
| B of A Securities | Downgrade | Neutral | 2025-10-16 |
| Mizuho | Maintain | Neutral | 2025-09-26 |
| Morgan Stanley | Maintain | Overweight | 2025-09-25 |
| Ladenburg Thalmann | Downgrade | Neutral | 2025-08-08 |
Overall, the grades indicate a prevailing neutral or equal weight stance with a few downgrades from buy or overweight ratings, reflecting cautious sentiment among analysts in recent months. The consensus remains a Hold based on 9 Buy and 11 Hold ratings, with no Sell recommendations.
Consumer Opinions
Atmos Energy Corporation has garnered a mix of feedback from its customer base, reflecting both satisfaction and areas for improvement.
| Positive Reviews | Negative Reviews |
|---|---|
| Reliable and consistent gas service. | Customer service can be slow to respond. |
| Transparent billing and fair pricing. | Occasional delays in outage resolution. |
| Proactive in safety measures and updates. | Limited online account management features. |
Overall, consumers appreciate Atmos Energy’s reliability and clear billing, but some express frustration with customer support responsiveness and digital service options. Improving these areas could enhance customer satisfaction significantly.
Risk Analysis
The table below summarizes key risks associated with Atmos Energy Corporation, highlighting their likelihood and potential impact:
| Category | Description | Probability | Impact |
|---|---|---|---|
| Financial Stability | Altman Z-score of 1.65 places the company in the distress zone, signaling heightened bankruptcy risk. | High | High |
| Liquidity Risk | Unfavorable current and quick ratios (0.67 and 0.53 respectively) indicate potential short-term liquidity constraints. | Medium | Medium |
| Operational Efficiency | Low asset turnover ratios (0.16) suggest inefficient use of assets impacting profitability. | Medium | Medium |
| Regulatory Risk | As a regulated gas utility, changes in regulations or rate approvals could affect revenues. | Medium | High |
| Market Volatility | Beta of 0.76 indicates moderate sensitivity to market movements, with some downside risk. | Medium | Medium |
The most pressing risk is financial distress, as reflected by the low Altman Z-score, which warns of possible bankruptcy without corrective action. Liquidity issues and regulatory changes also present notable challenges that could impact the company’s performance and dividend stability going forward.
Should You Buy Atmos Energy Corporation?
Atmos Energy Corporation appears to be navigating a slightly unfavorable moat profile with value destruction despite improving profitability metrics. While its leverage profile suggests manageable risk, the Altman Z-Score remains in the distress zone. Overall, a B+ rating could be seen as reflecting moderate operational efficiency and financial health.
Strength & Efficiency Pillars
Atmos Energy Corporation exhibits solid profitability with a net margin of 25.49% and an EBIT margin of 35.08%, indicating efficient cost management. Despite a moderate return on equity of 8.84% and a return on invested capital (ROIC) of 4.58% trailing its weighted average cost of capital (WACC) at 6.35%, the company maintains favorable financial health signals such as a strong interest coverage ratio of 9.61 and a stable dividend yield of 2.04%. The Altman Z-Score of 1.65 signals financial distress risk, but the average Piotroski Score of 5 reflects moderate operational strength.
Weaknesses and Drawbacks
Key concerns for Atmos Energy include its unfavorable liquidity ratios, with a current ratio of 0.67 and a quick ratio of 0.53, highlighting potential short-term solvency challenges. The company’s ROIC below WACC implies value destruction, raising questions about capital efficiency. Additionally, the price-to-earnings ratio of 22.64 and price-to-book ratio of 2.0 suggest a valuation that is neither cheap nor richly discounted, yet the recent period shows seller dominance (54.48% sellers vs. 45.52% buyers), contributing to a 6.54% price decline, which may pressure near-term market sentiment.
Our Verdict about Atmos Energy Corporation
Atmos Energy’s long-term fundamental profile appears moderately favorable due to its strong profitability and improving operational metrics, despite liquidity and capital efficiency weaknesses. Although the overall stock trend remains bullish with a 46.67% price increase, recent seller dominance signals a cautious environment. This combination suggests that, despite long-term strength, recent market pressure might warrant a wait-and-see approach for a more favorable entry point.
Disclaimer: This content is for informational purposes only and does not constitute financial, investment, or other professional advice. Investing in financial markets involves a significant risk of loss, and past performance is not indicative of future results.
Additional Resources
- Atmos Energy Corporation (ATO) Q2 2025 Earnings Call Transcript – AlphaStreet (Jan 22, 2026)
- Atmos Energy Corporation’s (NYSE:ATO) Fundamentals Look Pretty Strong: Could The Market Be Wrong About The Stock? – Yahoo Finance (Jan 10, 2026)
- Atmos Energy Corporation to Host Fiscal 2026 First Quarter Earnings Conference Call on February 4, 2026 – Business Wire (Jan 07, 2026)
- Utility Gas Inflation Is Soaring. This Stock Is a Clear Winner – Finviz (Jan 20, 2026)
- Atmos Energy: A Premium Utility That Requires Patience (NYSE:ATO) – Seeking Alpha (Dec 31, 2025)
For more information about Atmos Energy Corporation, please visit the official website: atmosenergy.com