Home > Analyses > Technology > Atlassian Corporation
Atlassian Corporation transforms how teams collaborate and deliver value across industries, powering the daily work of millions globally. Renowned for flagship products like Jira, Confluence, and Trello, Atlassian leads the software application sector with innovative tools that streamline project management, software development, and organizational knowledge. As the company continues to expand its cloud offerings and enterprise solutions, the critical question remains: do Atlassian’s fundamentals support its current market valuation and growth outlook?
Table of contents
Business Model & Company Overview
Atlassian Corporation, founded in 2002 and headquartered in Sydney, Australia, has established itself as a dominant player in the software application industry. Its ecosystem integrates project management, collaboration, and developer tools—such as Jira, Confluence, and Trello—that unify technical and business teams to streamline workflows and knowledge sharing. This cohesive suite supports a broad range of enterprise needs, from agile development to service management.
The company’s revenue engine balances software licensing with recurring cloud services, offering scalable solutions like Jira Service Management and Atlassian Access across global markets in the Americas, Europe, and Asia. This diversified approach underpins steady cash flow and customer retention. Atlassian’s competitive advantage lies in its comprehensive platform and strong network effects, shaping the future of collaborative work across industries.
Financial Performance & Fundamental Metrics
This section analyzes Atlassian Corporation’s income statement, financial ratios, and dividend payout policy to provide a clear view of its fundamental strength.
Income Statement
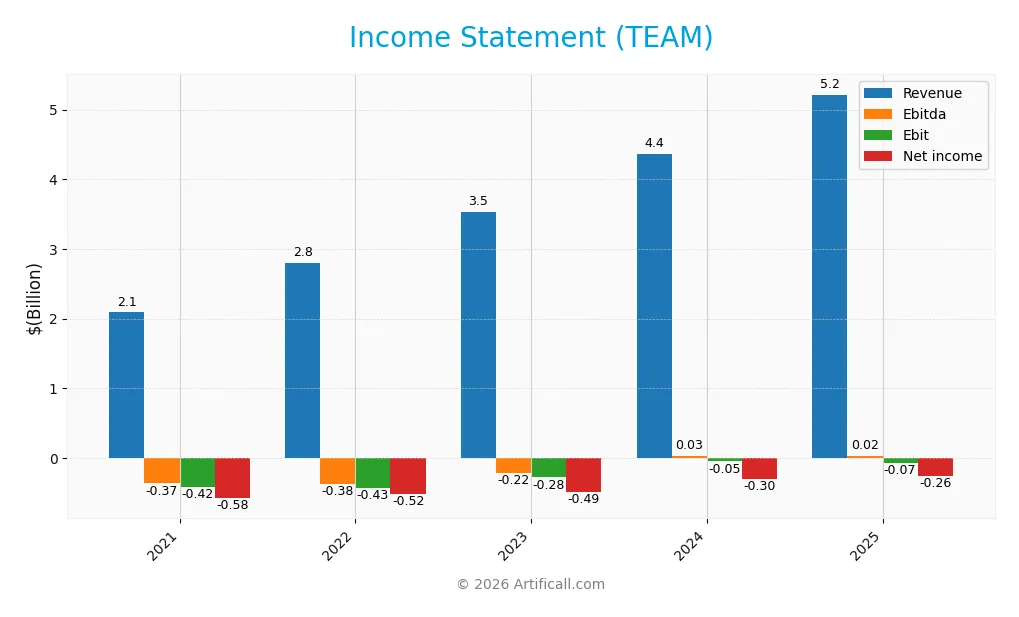
The table below presents Atlassian Corporation’s key income statement figures for fiscal years 2021 through 2025, reported in USD.
| 2021 | 2022 | 2023 | 2024 | 2025 | |
|---|---|---|---|---|---|
| Revenue | 2.09B | 2.80B | 3.53B | 4.36B | 5.22B |
| Cost of Revenue | 332M | 453M | 634M | 803M | 895M |
| Operating Expenses | 1.62B | 2.28B | 3.25B | 3.67B | 4.45B |
| Gross Profit | 1.76B | 2.35B | 2.90B | 3.56B | 4.32B |
| EBITDA | -366M | -378M | -220M | 27M | 24M |
| EBIT | -422M | -429M | -281M | -51M | -68M |
| Interest Expense | 93M | 41M | 30M | 34M | 31M |
| Net Income | -579M | -520M | -487M | -301M | -257M |
| EPS | -2.79 | -2.42 | -1.90 | -1.16 | -0.98 |
| Filing Date | 2021-08-13 | 2022-08-19 | 2023-08-18 | 2024-08-16 | 2025-08-15 |
Income Statement Evolution
Atlassian Corporation’s revenue grew significantly by 19.7% from 4.36B in 2024 to 5.22B in 2025, continuing a strong upward trend since 2021. Gross margin remained favorable at 82.8%, reflecting efficient cost management despite rising expenses. However, operating efficiency declined with EBIT margin slipping to -1.3%, signaling increased operational costs relative to revenue.
Is the Income Statement Favorable?
In 2025, Atlassian reported a net loss of 257M, an improvement over prior years, supported by a favorable net margin growth of 28.6%. Interest expense remained low at 0.59% of revenue, aiding financial stability. Despite negative operating income, the overall income statement is assessed as favorable due to strong revenue growth, improved margins, and positive EPS trends, although profitability challenges persist.
Financial Ratios
The table below summarizes key financial ratios for Atlassian Corporation (TEAM) for the fiscal years 2021 to 2025, providing a clear view of profitability, leverage, liquidity, and valuation metrics:
| Ratios | 2021 | 2022 | 2023 | 2024 | 2025 |
|---|---|---|---|---|---|
| Net Margin | -27.7% | -18.5% | -13.8% | -6.9% | -4.9% |
| ROE | -196.3% | -158.7% | -74.4% | -29.1% | -19.1% |
| ROIC | 13.8% | 4.0% | -15.9% | -4.4% | -4.5% |
| P/E | -111 | -91 | -88 | -154 | -207 |
| P/B | 217.4 | 145.0 | 65.7 | 44.7 | 39.5 |
| Current Ratio | 0.70 | 1.19 | 1.35 | 1.18 | 1.22 |
| Quick Ratio | 0.70 | 1.19 | 1.35 | 1.18 | 1.22 |
| D/E | 2.05 | 4.02 | 1.96 | 1.21 | 0.92 |
| Debt-to-Assets | 20.6% | 39.5% | 31.2% | 24.0% | 20.5% |
| Interest Coverage | 1.53 | 1.69 | -11.5 | -3.44 | -4.27 |
| Asset Turnover | 0.71 | 0.84 | 0.86 | 0.84 | 0.86 |
| Fixed Asset Turnover | 7.69 | 7.42 | 13.3 | 16.8 | 19.0 |
| Dividend Yield | 0.0% | 0.0% | 0.0% | 0.0% | 0.0% |
Evolution of Financial Ratios
Over the examined period, Atlassian Corporation’s Return on Equity (ROE) remained negative, indicating ongoing challenges in profitability, with a slight improvement from -1.96 in 2021 to -0.19 in 2025. The Current Ratio showed modest growth, rising from 0.70 in 2021 to 1.22 in 2025, reflecting improving liquidity. Debt-to-Equity Ratio decreased from over 2.05 in 2021 to 0.92 in 2025, suggesting reduced financial leverage.
Are the Financial Ratios Favorable?
In 2025, profitability ratios such as net margin (-4.92%) and ROE (-19.08%) were unfavorable, while liquidity ratios showed mixed signals: the quick ratio was favorable at 1.22, but the current ratio was neutral. Leverage metrics were generally neutral to favorable, with a debt-to-assets ratio of 20.51% rated favorable. Efficiency ratios like fixed asset turnover were favorable, but interest coverage was unfavorable at -2.24. Overall, the financial ratios present a slightly unfavorable profile for the year.
Shareholder Return Policy
Atlassian Corporation (TEAM) does not pay dividends, reflecting its ongoing net losses and focus on reinvestment to support growth. The company maintains positive free cash flow and has not engaged in share buybacks, indicating a priority on capital allocation for expansion rather than immediate shareholder payouts.
This approach aligns with a high-growth strategy emphasizing long-term value creation through reinvestment rather than current income distribution. The absence of dividends and buybacks underlines a cautious capital management stance, supporting sustainability amid operating losses and negative profitability margins.
Score analysis
The following radar chart displays the company’s key financial scores for evaluation:
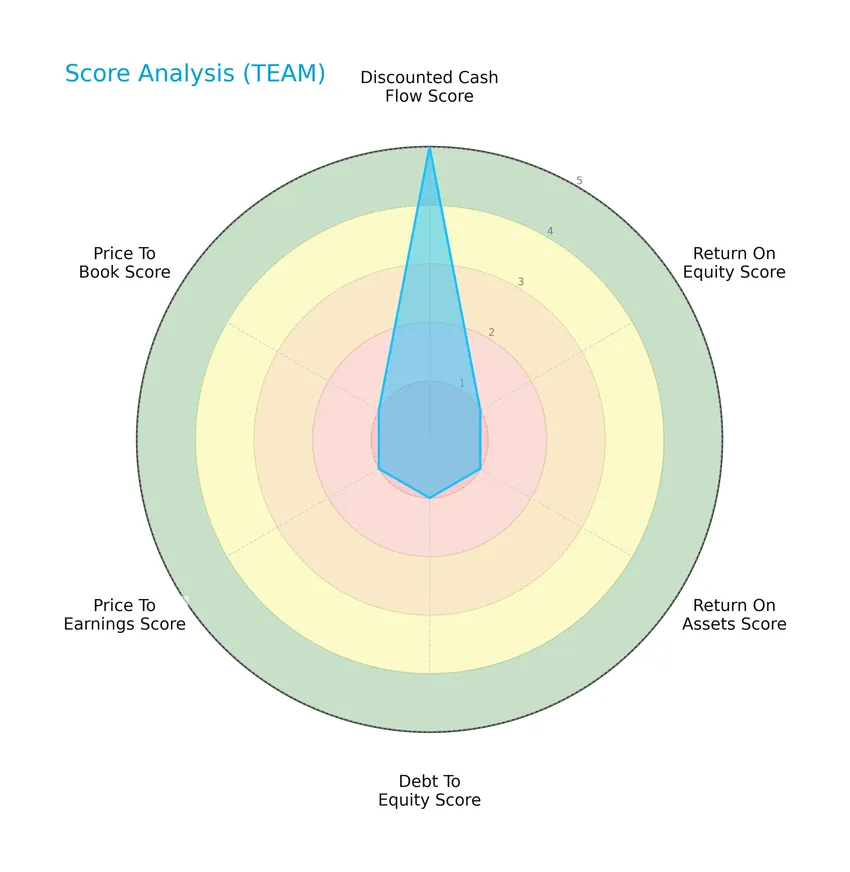
Atlassian Corporation shows a strong discounted cash flow score of 5, indicating favorable intrinsic value. However, other metrics including return on equity, return on assets, debt to equity, price to earnings, and price to book scores all stand at 1, reflecting very unfavorable conditions in profitability, leverage, and valuation metrics.
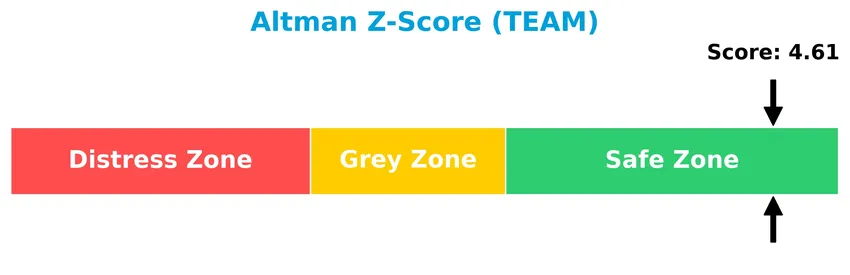
Analysis of the company’s bankruptcy risk
The Altman Z-Score of 4.61 places the company comfortably in the safe zone, indicating a low risk of bankruptcy:
Is the company in good financial health?
The Piotroski Score diagram provides insight into the company’s financial strength based on nine criteria:

With a Piotroski Score of 5, the company is considered to have average financial health, showing moderate strength but room for improvement in profitability and efficiency measures.
Competitive Landscape & Sector Positioning
This section provides an analysis of the sector in which Atlassian Corporation operates, focusing on strategic positioning, revenue by segment, key products, and main competitors. I will evaluate whether Atlassian holds a competitive advantage over its industry peers based on these factors.
Strategic Positioning
Atlassian Corporation maintains a diversified product portfolio focused on software applications for project management, collaboration, and developer tools, including Jira, Confluence, and Trello. Geographically, its revenue is well-distributed across Americas (approx. $2.5B in 2025), EMEA ($2.1B), and Asia Pacific ($570M), reflecting broad international exposure.
Revenue by Segment
The pie chart illustrates Atlassian Corporation’s revenue breakdown by product segments for the fiscal year 2025, highlighting the relative contributions of key business areas.
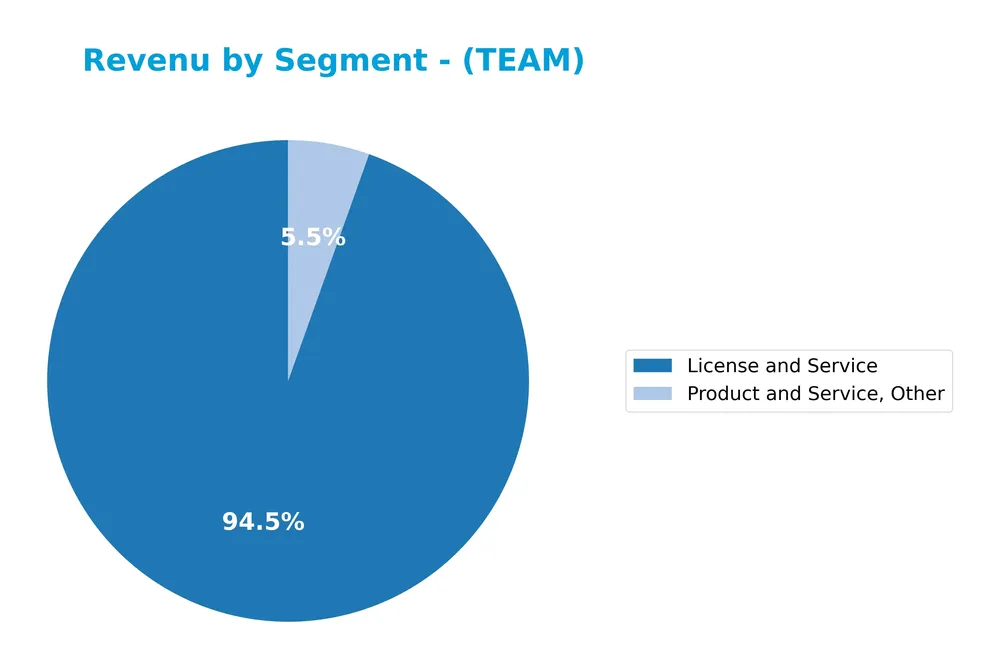
In 2025, “License and Service” dominates Atlassian’s revenue with 4.9B USD, showing a strong growth trajectory from prior years. The “Product and Service, Other” segment contributes a smaller 285M USD, indicating a more niche revenue stream. Earlier years featured segments like “Maintenance” and “Subscription,” but by 2025 these are either consolidated or less significant, signaling a shift towards integrated licensing and service offerings. This concentration suggests focus but also potential risk if diversification does not improve.
Key Products & Brands
The following table summarizes Atlassian Corporation’s key products and brands with their main descriptions:
| Product | Description |
|---|---|
| Jira Software & Jira Work Management | Project management systems connecting technical and business teams to plan, organize, track, and manage work. |
| Confluence | Connected workspace that organizes knowledge across teams to advance work. |
| Trello | Collaboration and organization tool for managing fluid, fast-forming team work. |
| Jira Service Management | Service desk product for managing service experiences across IT, legal, HR, and other service teams. |
| Jira Align | Enterprise agility solution for adapting to dynamic business conditions focused on value creation. |
| Bitbucket | Enterprise Git solution enabling professional development teams to manage, collaborate, and deploy code. |
| Atlassian Access | Enterprise-wide security and centralized administration platform for Atlassian cloud products. |
| Jira Product | Prioritization and road mapping tool. |
| Atlas | Teamwork directory facilitating collaboration. |
| Bamboo | Continuous delivery pipeline tool. |
| Crowd | Single sign-on solution. |
| Crucible | Collaborative code review software. |
| Fisheye | Tool to search, track, and visualize code changes. |
| Compass | Developer experience platform. |
| Opsgenie | On-call and alert management software. |
| Sourcetree | Free Git client for Windows and macOS. |
| Statuspage | Real-time status communication tool for users. |
| Beacon | Intelligent threat detection software. |
Atlassian’s product suite spans project management, collaboration, agile development, code management, and security, supporting diverse teams and enterprise agility.
Main Competitors
There are 33 competitors in the sector, with the table below listing the top 10 leaders by market capitalization:
| Competitor | Market Cap. |
|---|---|
| Salesforce, Inc. | 242.5B |
| Shopify Inc. | 209.6B |
| AppLovin Corporation | 209.0B |
| Intuit Inc. | 175.2B |
| Uber Technologies, Inc. | 172.2B |
| ServiceNow, Inc. | 153.0B |
| Cadence Design Systems, Inc. | 84.5B |
| Snowflake Inc. | 73.4B |
| Autodesk, Inc. | 61.2B |
| Workday, Inc. | 54.9B |
Atlassian Corporation ranks 13th among 33 competitors in the software application industry, with a market cap approximately 14.3% of the leader Salesforce, Inc. The company is positioned below the average market cap of the top 10 competitors (143.6B) but above the sector median (18.8B). It enjoys a 26.23% market cap gap over its closest competitor above, indicating a solid mid-tier standing.
Comparisons with competitors
Check out how we compare the company to its competitors:
Does TEAM have a competitive advantage?
Atlassian Corporation does not currently present a competitive advantage as its return on invested capital (ROIC) is significantly below its weighted average cost of capital (WACC), indicating value destruction and declining profitability. Despite a favorable gross margin of 82.8%, the company shows negative EBIT and net margins, highlighting challenges in converting revenue growth into sustainable profits.
Looking ahead, Atlassian’s extensive software portfolio, including Jira, Confluence, Trello, and emerging enterprise solutions like Jira Align and Atlassian Access, offers opportunities to penetrate new markets and enhance product integration. Continued innovation in service management and developer tools may provide avenues for revenue expansion despite current profitability concerns.
SWOT Analysis
This SWOT analysis highlights key internal and external factors shaping Atlassian Corporation’s current position and future prospects.
Strengths
- strong revenue growth with 149.64% increase over 5 years
- diversified product portfolio including Jira, Trello, and Confluence
- solid market presence in Americas and EMEA
Weaknesses
- negative net margin at -4.92% impacting profitability
- declining ROIC indicating value destruction
- high price-to-book ratio of 39.51 suggesting overvaluation
Opportunities
- expanding cloud adoption boosts demand for collaboration tools
- growth potential in Asia Pacific and emerging markets
- increasing enterprise agility needs drive product innovation
Threats
- intense competition in software application market
- macroeconomic uncertainties affecting IT budgets
- cybersecurity risks impacting SaaS providers
Atlassian demonstrates robust growth and product diversity but faces profitability challenges and valuation concerns. Strategic focus should prioritize improving operational efficiency and leveraging global market expansion while managing competitive and macro risks prudently.
Stock Price Action Analysis
The following weekly stock chart displays Atlassian Corporation’s price movements over the past 12 months, highlighting key fluctuations and trading ranges:
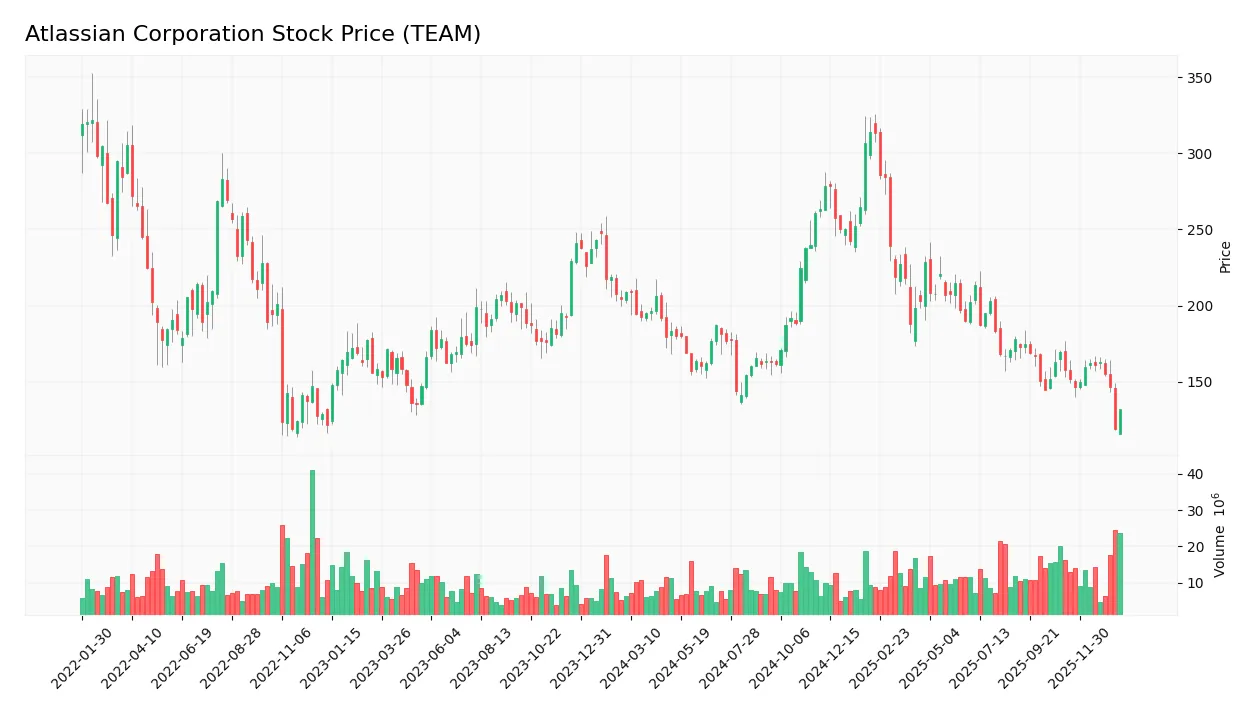
Trend Analysis
Over the past 12 months, TEAM’s stock price declined by 37.02%, indicating a bearish trend. The price range fluctuated between a high of 314.28 and a low of 118.55, with volatility reflected in a 41.69 standard deviation. The downward trend shows deceleration, suggesting the decline pace is slowing.
Volume Analysis
Trading volume for TEAM is increasing overall, with seller volume slightly exceeding buyer volume at 51.25% historically. In the recent 3-month period, seller dominance intensified to 63.94%, indicating seller-driven activity. This suggests cautious or negative investor sentiment with heightened market participation on the sell side.
Target Prices
Analysts present a moderately optimistic consensus for Atlassian Corporation’s stock price targets.
| Target High | Target Low | Consensus |
|---|---|---|
| 290 | 185 | 233.43 |
The target prices suggest that analysts expect Atlassian’s stock to trade between $185 and $290, with an average consensus near $233, indicating potential upside from current levels.

Don’t Let Luck Decide Your Entry Point
Optimize your entry points with our advanced ProRealTime indicators. You’ll get efficient buy signals with precise price targets for maximum performance. Start outperforming now!
Analyst & Consumer Opinions
This section examines recent analyst ratings and consumer feedback regarding Atlassian Corporation (TEAM) to provide balanced insights.
Stock Grades
Here is a summary of recent stock grades for Atlassian Corporation from recognized financial institutions:
| Grading Company | Action | New Grade | Date |
|---|---|---|---|
| Mizuho | Maintain | Outperform | 2026-01-21 |
| TD Cowen | Maintain | Hold | 2026-01-20 |
| Citigroup | Maintain | Buy | 2026-01-16 |
| BTIG | Maintain | Buy | 2026-01-13 |
| Piper Sandler | Maintain | Overweight | 2026-01-05 |
| Bernstein | Maintain | Outperform | 2025-11-18 |
| Macquarie | Maintain | Outperform | 2025-11-03 |
| Bernstein | Maintain | Outperform | 2025-10-31 |
| Mizuho | Maintain | Outperform | 2025-10-31 |
| TD Cowen | Maintain | Hold | 2025-10-27 |
The overall trend shows consistent positive ratings with multiple Outperform and Buy grades, alongside some Hold assessments, reflecting a generally favorable but cautious outlook on Atlassian’s stock.
Consumer Opinions
Consumers have expressed a mix of enthusiasm and criticism regarding Atlassian Corporation’s products and services, reflecting its impact on productivity tools.
| Positive Reviews | Negative Reviews |
|---|---|
| Intuitive interface and seamless collaboration features enhance team productivity. | Occasional bugs and slow customer support responses can hinder workflow. |
| Robust integration with other software makes project management efficient. | Pricing can be high for small businesses and startups. |
| Frequent updates bring valuable new features and improvements. | Some users find the learning curve steep for advanced functionalities. |
Overall, users appreciate Atlassian’s powerful collaboration tools and integrations but note that customer support and pricing pose challenges, especially for smaller teams.
Risk Analysis
Below is a summary table highlighting key risks facing Atlassian Corporation based on recent financial and market data:
| Category | Description | Probability | Impact |
|---|---|---|---|
| Profitability Risk | Negative net margin (-4.92%) and ROE (-19.08%) indicate losses. | High | High |
| Valuation Risk | Extremely high price-to-book ratio (39.51) suggests overvaluation. | Medium | Medium |
| Debt & Solvency Risk | Interest coverage is negative (-2.24), raising concerns on debt servicing. | Medium | High |
| Market Volatility | Beta of 0.888 shows moderate sensitivity to market changes. | Medium | Medium |
| Dividend Risk | No dividend payments, reducing income appeal. | High | Low |
| Financial Health | Altman Z-Score at 4.61 indicates low bankruptcy risk. | Low | High (if occurs) |
The most significant risks for Atlassian are its sustained unprofitability and weak returns on equity, combined with a high valuation that may expose investors to downside if growth falters. However, the strong Altman Z-Score suggests bankruptcy risk is currently low. Caution is warranted given the negative interest coverage and overall slightly unfavorable financial ratios.
Should You Buy Atlassian Corporation?
Atlassian Corporation appears to be experiencing deteriorating operational efficiency and value destruction, reflected in a very unfavorable competitive moat and declining profitability. Despite a manageable leverage profile and a safe Altman Z-Score, its overall rating of C suggests a cautious analytical interpretation.
Strength & Efficiency Pillars
Atlassian Corporation displays solid financial stability, underscored by an Altman Z-Score of 4.61, positioning the company safely above bankruptcy risk thresholds. The Piotroski Score of 5 suggests average financial health, reflecting moderate operational strength. While the weighted average cost of capital (WACC) stands at 7.89%, the return on invested capital (ROIC) is negative at -4.48%, indicating the company is currently not a value creator. Despite negative profitability margins, Atlassian maintains a favorable gross margin of 82.84% and low interest expense at 0.59%, highlighting operational efficiency in cost management.
Weaknesses and Drawbacks
The investment case is challenged by several unfavorable valuation and profitability metrics. Atlassian’s net margin is deeply negative at -4.92%, accompanied by a return on equity (ROE) of -19.08%, signaling profitability issues. The price-to-book ratio is extremely elevated at 39.51, implying a stretched market valuation that may not be supported by fundamentals. Additionally, the company faces seller dominance in recent trading periods, with buyers accounting for only 36.06% of volume, creating short-term market pressure. Interest coverage is also negative at -2.24, raising concerns about the company’s ability to service debt comfortably.
Our Verdict about Atlassian Corporation
The fundamental profile of Atlassian Corporation might appear unfavorable due to ongoing profitability struggles and valuation concerns. Coupled with a bearish overall trend and recent seller dominance, the stock suggests heightened risk in the near term. Despite solid financial stability indicators, recent market behavior and weak returns imply that a cautious, wait-and-see approach could be prudent before considering entry positions.
Disclaimer: This content is for informational purposes only and does not constitute financial, investment, or other professional advice. Investing in financial markets involves a significant risk of loss, and past performance is not indicative of future results.
Additional Resources
- Y Intercept Hong Kong Ltd Purchases 20,078 Shares of Atlassian Corporation PLC $TEAM – MarketBeat (Jan 24, 2026)
- BTIG Stays Bullish on Atlassian (TEAM) After Data Center Pricing Update – Yahoo Finance (Jan 19, 2026)
- Atlassian Corporation (NASDAQ:TEAM) Shares May Have Slumped 27% But Getting In Cheap Is Still Unlikely – simplywall.st (Jan 17, 2026)
- Atlassian Q2 Preview: Is The SaaS Apocalypse Over? (NASDAQ:TEAM) – Seeking Alpha (Jan 19, 2026)
- Atlassian, The Trade Desk, and Bandwidth Shares Skyrocket, What You Need To Know – Finviz (Jan 21, 2026)
For more information about Atlassian Corporation, please visit the official website: atlassian.com