Home > Analyses > Communication Services > AT&T Inc.
AT&T Inc. connects millions daily through its vast telecommunications and media network. It dominates wireless voice, data services, and broadband fiber across the U.S. and Latin America. Known for innovation and a broad product portfolio under brands like AT&T and Cricket, it shapes how businesses and consumers communicate. As competition intensifies and technology evolves, I ask: does AT&T’s current valuation reflect its ability to sustain growth and profitability in a shifting landscape?

Table of contents
Business Model & Company Overview
AT&T Inc., founded in 1983 and headquartered in Dallas, Texas, stands as a dominant player in telecommunications services. It integrates wireless voice, data communications, and broadband fiber under a unified ecosystem. The company serves a broad spectrum from residential customers to multinational corporations, leveraging brand names like AT&T, Cricket, and AT&T Fiber to secure a commanding industry position.
The company’s revenue engine balances hardware sales, including handsets and wireless devices, with robust recurring services such as cloud solutions, security, and managed services. Its strategic footprint spans the Americas, including Mexico, and extends into Latin America’s video market. This competitive advantage underpins AT&T’s durable economic moat and shapes the future of global digital connectivity.
Financial Performance & Fundamental Metrics
I will analyze AT&T Inc.’s income statement, key financial ratios, and dividend payout policy to assess its overall financial health and shareholder value.
Income Statement
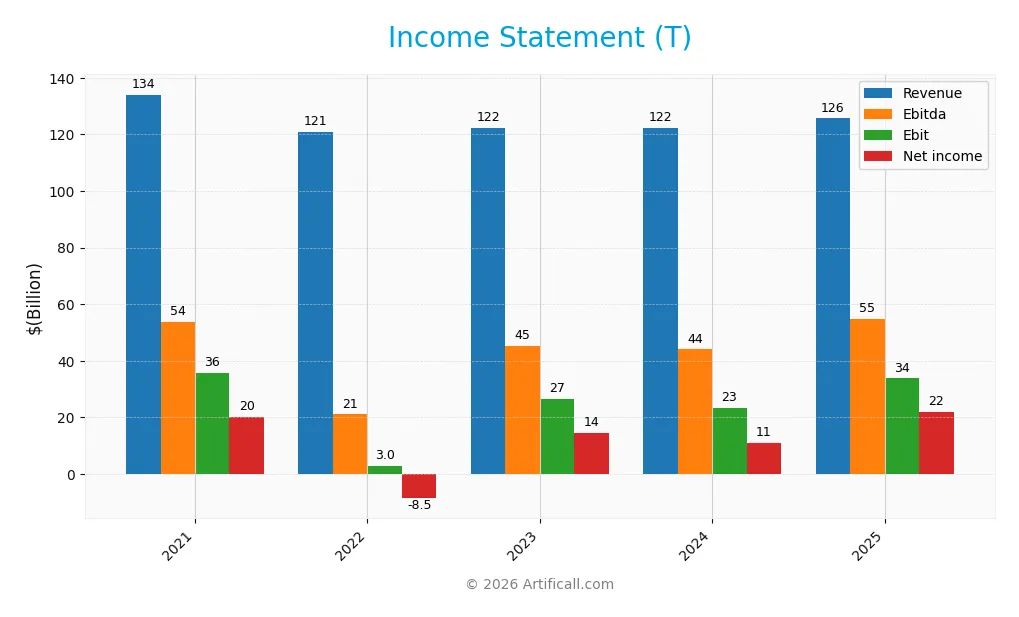
The following table presents AT&T Inc.’s key income statement figures for fiscal years 2021 through 2025, reflecting revenue, expenses, and profitability metrics.
| 2021 | 2022 | 2023 | 2024 | 2025 | |
|---|---|---|---|---|---|
| Revenue | 134B | 121B | 122B | 122B | 126B |
| Cost of Revenue | 60B | 51B | 69B | 70B | 25B |
| Operating Expenses | 48B | 74B | 29B | 28B | 76B |
| Gross Profit | 74B | 70B | 54B | 53B | 100B |
| EBITDA | 54B | 21B | 45B | 44B | 55B |
| EBIT | 36B | 3B | 27B | 23B | 34B |
| Interest Expense | 6.7B | 6.1B | 6.7B | 6.7B | 6.8B |
| Net Income | 20B | -8.5B | 14B | 11B | 22B |
| EPS | 2.77 | -1.22 | 1.97 | 1.49 | 3.04 |
| Filing Date | 2022-02-16 | 2023-02-13 | 2024-02-23 | 2025-02-12 | 2026-02-09 |
Income Statement Evolution
From 2021 to 2025, AT&T’s revenue declined by 6.3%, reflecting sector challenges. However, net income rose 9%, signaling margin improvement. The gross margin expanded to 79.8%, and net margin reached 17.4%, both favorable. EBIT margin also improved to 26.9%. Recent growth in net income and EPS was robust, offsetting slower top-line gains.
Is the Income Statement Favorable?
The 2025 income statement shows strong fundamentals. Revenue grew modestly by 2.7%, but gross profit surged 90.8%, driven by better cost control. Operating expenses grew at the same pace as revenue, limiting operating leverage. EBIT jumped 44%, lifting the net margin nearly 95%. Interest expense remains a neutral factor. Overall, profitability and cash flow metrics look solid and favorable.
Financial Ratios
The table below summarizes key financial ratios for AT&T Inc. from 2021 to 2025, providing insight into profitability, liquidity, leverage, and valuation metrics:
| Ratios | 2021 | 2022 | 2023 | 2024 | 2025 |
|---|---|---|---|---|---|
| Net Margin | 15% | -7% | 12% | 9% | 17% |
| ROE | 12.1% | -8.7% | 13.9% | 10.5% | 17.6% |
| ROIC | 4.5% | -1.3% | 5.3% | 5.0% | 5.6% |
| P/E | 6.6 | -15.5 | 8.4 | 15.0 | 8.1 |
| P/B | 0.80 | 1.35 | 1.17 | 1.57 | 1.43 |
| Current Ratio | 1.61 | 0.59 | 0.71 | 0.66 | 0.91 |
| Quick Ratio | 1.58 | 0.53 | 0.67 | 0.62 | 0.86 |
| D/E | 1.18 | 1.59 | 1.50 | 1.35 | 1.25 |
| Debt-to-Assets | 35.5% | 38.4% | 38.1% | 35.7% | 37.0% |
| Interest Coverage | 3.87 | -0.75 | 3.70 | 3.60 | 3.55 |
| Asset Turnover | 0.24 | 0.30 | 0.30 | 0.31 | 0.30 |
| Fixed Asset Turnover | 0.93 | 0.81 | 0.82 | 0.82 | 0.81 |
| Dividend Yield | 11.3% | 7.5% | 6.8% | 5.0% | 4.6% |
Evolution of Financial Ratios
Return on Equity (ROE) improved steadily from negative in 2022 to 17.6% in 2025, reflecting a turnaround in profitability. The Current Ratio rose from 0.59 in 2022 to 0.91 in 2025, remaining below 1, signaling persistent liquidity constraints. Debt-to-Equity declined from 1.59 in 2022 to 1.25 in 2025, indicating modest deleveraging.
Are the Financial Ratios Fovorable?
Profitability ratios like net margin (17.4%) and ROE (17.6%) are favorable, supporting earnings strength. Liquidity ratios show mixed signals: Current Ratio at 0.91 is unfavorable, quick ratio neutral at 0.86. Leverage remains elevated with a Debt-to-Equity of 1.25 marked unfavorable. Asset turnover ratios are weak, while dividend yield of 4.59% is a positive. Overall, ratios are slightly favorable but highlight liquidity and efficiency risks.
Shareholder Return Policy
AT&T Inc. maintains a consistent dividend policy, with a payout ratio of 37% in 2025 and a dividend yield near 4.6%. The dividend per share remained stable around $1.14, supported by solid free cash flow coverage and moderate share buybacks.
This disciplined distribution balances shareholder returns with capital expenditure needs. The payout level appears sustainable, aligning with long-term value creation while managing debt and operational cash flow prudently.
Score analysis
The radar chart below highlights AT&T Inc.’s key financial scores across valuation, profitability, and leverage metrics:
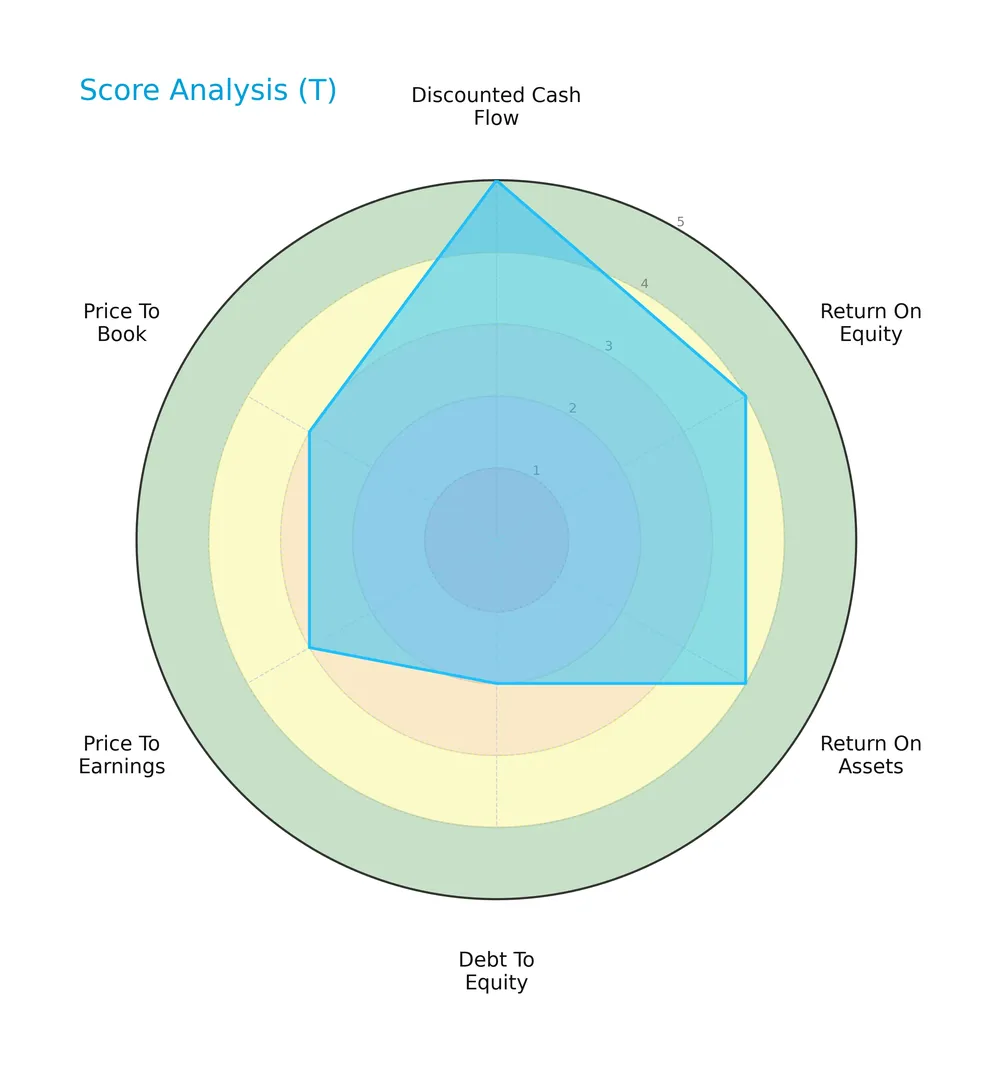
AT&T scores very favorably on discounted cash flow (5) and favorably on return on equity (4) and assets (4). Debt-to-equity is unfavorable (2), while price-to-earnings and price-to-book ratios are moderate (3 each).
Analysis of the company’s bankruptcy risk
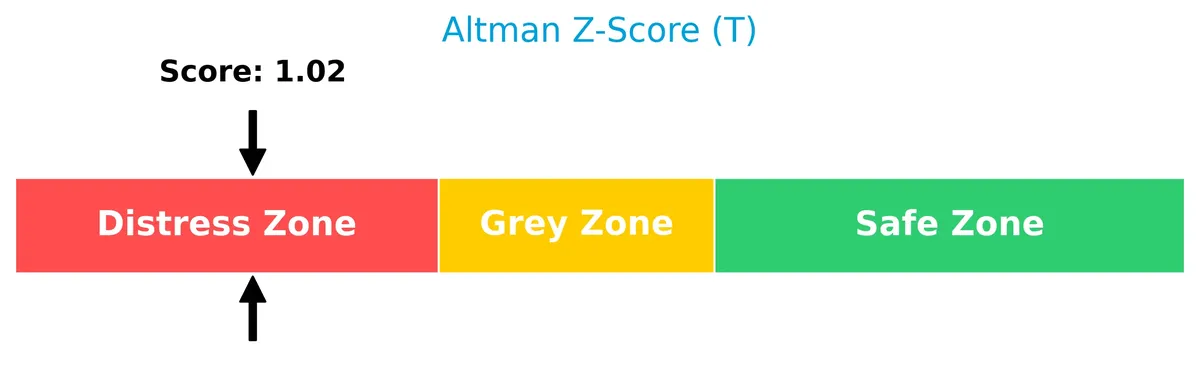
The Altman Z-Score places AT&T in the distress zone, indicating a high risk of bankruptcy based on financial ratios:
Is the company in good financial health?
The Piotroski Score diagram illustrates AT&T’s strong financial health status:

With a Piotroski Score of 7, AT&T demonstrates solid profitability, liquidity, and operational efficiency, signaling robust financial strength despite some balance sheet concerns.
Competitive Landscape & Sector Positioning
This analysis examines AT&T Inc.’s strategic positioning within the telecommunications sector. It reviews revenue sources, key products, competitors, and competitive strengths. I will assess whether AT&T holds a distinct competitive advantage over its main rivals.
Strategic Positioning
AT&T Inc. concentrates heavily on wireless services, generating $70B in 2025, complemented by business services at $16B and IP broadband at $3.5B. Its geographic exposure is largely U.S.-centric with $120B revenue, while Latin America, especially Mexico, contributes a smaller $4.4B segment, reflecting a focused yet diversified telecom and media portfolio.
Revenue by Segment
This pie chart illustrates AT&T Inc.’s revenue distribution by segment for the fiscal year 2025, highlighting key business drivers across its product lines.
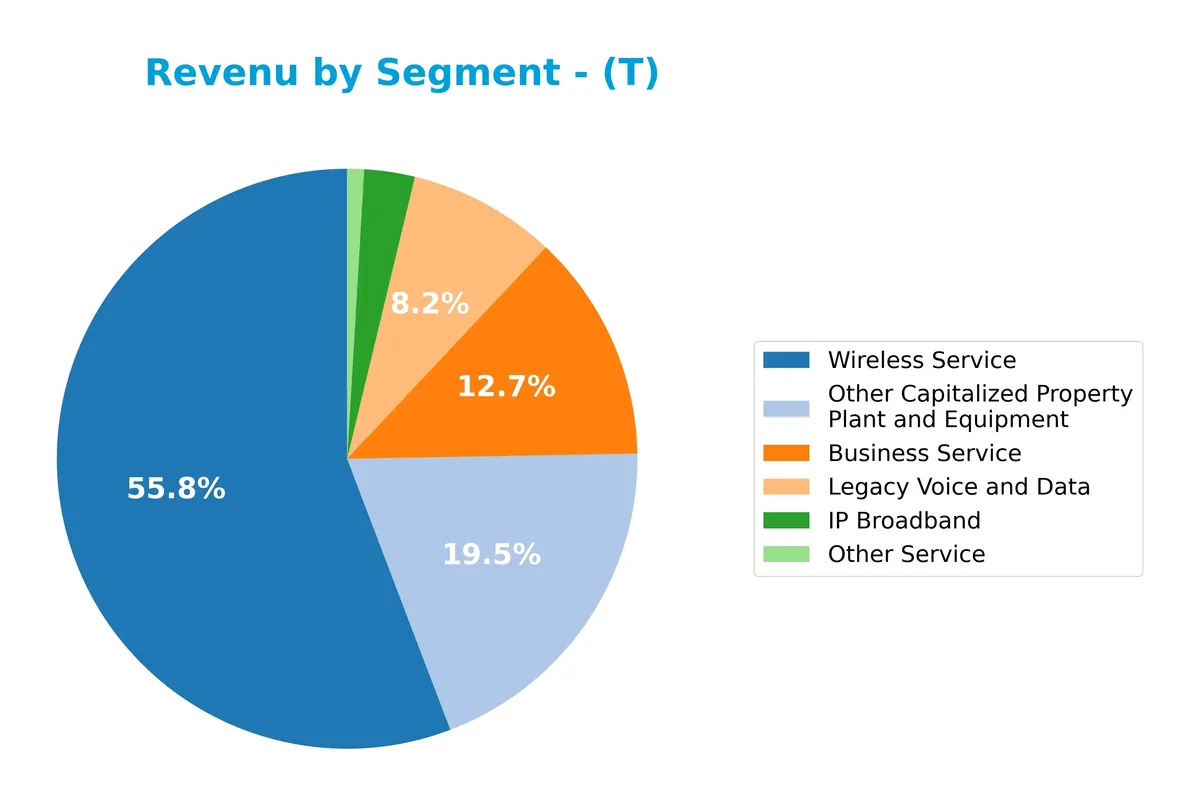
In 2025, Wireless Service dominates with $70B, showing steady growth and reflecting its role as the core revenue engine. Business Service follows at $16B but shows a slight decline from prior years, signaling potential pressure. Legacy Voice and Data, at $10B, still contributes but continues its long-term contraction. Other segments like IP Broadband and Other Service remain smaller but stable, indicating a focused but diversified revenue base.
Key Products & Brands
The table below outlines AT&T Inc.’s primary products and brand offerings based on reported segment data:
| Product | Description |
|---|---|
| Wireless Service | Wireless voice and data communications, including handsets and wireless devices sales. |
| Business Service | Data, voice, security, cloud, outsourcing, managed and professional services for enterprises. |
| Legacy Voice and Data | Traditional voice telephony and data communication services. |
| IP Broadband | Broadband fiber and internet protocol-based services to residential customers. |
| Other Service | Miscellaneous services not explicitly categorized elsewhere. |
| AT&T Brand Family | Includes AT&T, Cricket, AT&T PREPAID, and AT&T Fiber branding for communication products. |
| Latin America Segment | Wireless and video services marketed under AT&T and Unefon brands in Mexico and Latin America. |
AT&T’s portfolio centers on wireless connectivity and comprehensive business services. It maintains legacy services while expanding broadband. The company leverages multiple brand names to serve diverse geographic and customer segments.
Main Competitors
There are 5 competitors in the Telecommunications Services industry; here are the top 10 leaders by market capitalization:
| Competitor | Market Cap. |
|---|---|
| T-Mobile US, Inc. | 223B |
| AT&T Inc. | 174B |
| Verizon Communications Inc. | 171B |
| Comcast Corporation | 108B |
| Charter Communications, Inc. | 29B |
AT&T Inc. ranks 2nd among its competitors with a market cap at 90.4% of the leader, T-Mobile US. It stands above both the average market cap of the top 10 competitors (141B) and the median sector cap (171B). The 10.6% gap to T-Mobile highlights a significant but not insurmountable distance from the top player.
Comparisons with competitors
Check out how we compare the company to its competitors:
Does AT&T have a competitive advantage?
AT&T currently does not demonstrate a clear competitive advantage, as its ROIC remains below WACC, indicating value is being shed despite improving profitability. Its income statement shows favorable margins and net income growth, but revenue growth is weak and inconsistent.
Looking ahead, AT&T’s extensive U.S. market presence and diversified telecommunications services provide opportunities for expansion. Growth in Latin America and new technology offerings could improve its competitive position if capital allocation continues to enhance returns.
SWOT Analysis
This analysis identifies AT&T Inc.’s core strategic factors to guide investment decisions.
Strengths
- Strong U.S. market presence
- Favorable profit margins
- Growing ROIC trend
Weaknesses
- Low current ratio signals liquidity risk
- High debt-to-equity ratio
- Weak asset turnover efficiency
Opportunities
- Expansion in Latin America
- Growth in broadband fiber services
- Increasing demand for cloud solutions
Threats
- Intense telecom competition
- Regulatory pressures
- Currency exposure in international markets
AT&T’s strengths lie in its dominant U.S. footprint and improving profitability. However, liquidity and asset utilization weaknesses require cautious capital management. Growth hinges on international expansion and tech services, but competition and regulation pose significant risks. Strategic focus should balance growth with financial discipline.
Stock Price Action Analysis
The upcoming weekly stock chart illustrates AT&T Inc.’s price movements and volatility over the last 12 months:
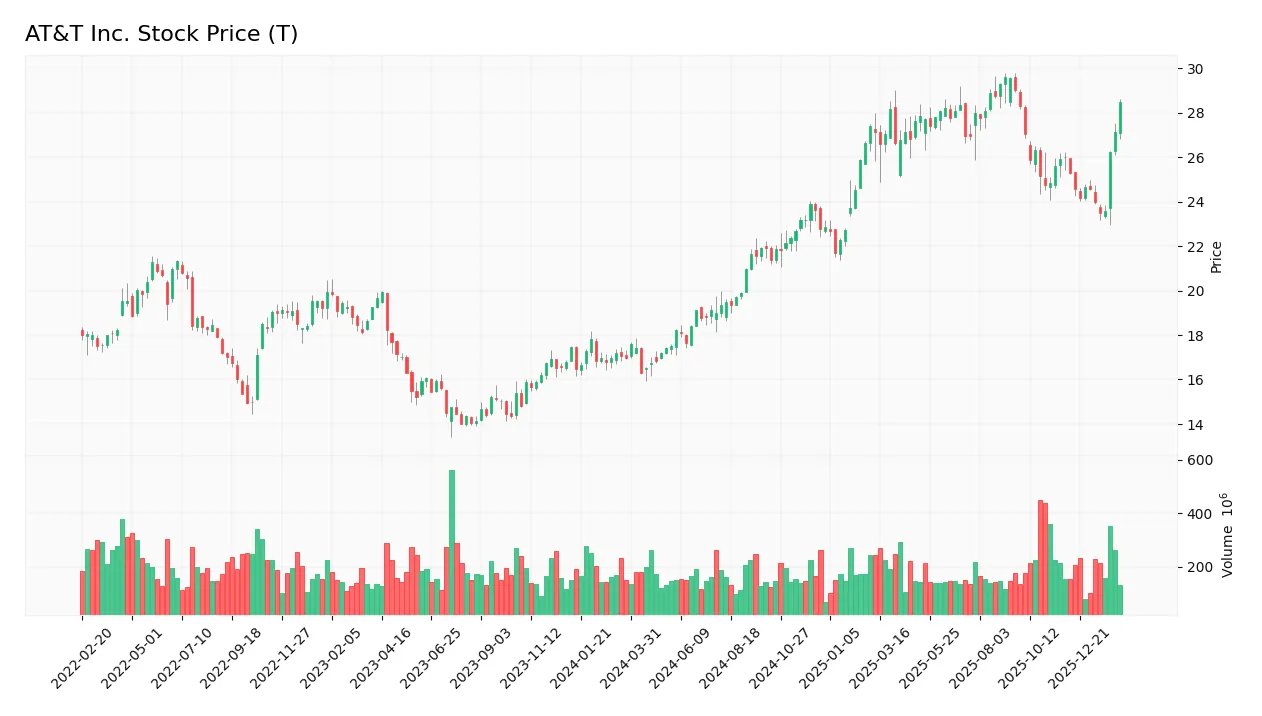
Trend Analysis
Over the past 12 months, AT&T’s stock price surged 67.67%, signaling a bullish trend with accelerating momentum. The price ranged between 16.31 and 29.59, supported by a 3.84 standard deviation, indicating moderate volatility. Recent weeks show a 9.42% gain with a mild upward slope of 0.17, confirming sustained positive momentum.
Volume Analysis
Trading volume has increased overall, with buyers accounting for 58.19% of total activity, reflecting buyer-driven demand. However, in the recent 2.5-month period, buyer dominance fell to 49.91%, showing neutral sentiment and balanced trading. This shift suggests cautious participation amid higher volume.
Target Prices
Analysts set a target consensus that suggests moderate upside potential for AT&T Inc.
| Target Low | Target High | Consensus |
|---|---|---|
| 20 | 33 | 28.96 |
The target range indicates cautious optimism, with analysts expecting the stock to trade between $20 and $33, centering near $29.

Don’t Let Luck Decide Your Entry Point
Optimize your entry points with our advanced ProRealTime indicators. You’ll get efficient buy signals with precise price targets for maximum performance. Start outperforming now!
Analyst & Consumer Opinions
This section examines AT&T Inc.’s recent analyst ratings alongside consumer feedback to assess market sentiment and brand perception.
Stock Grades
Here are the recent stock grades for AT&T Inc. from recognized financial institutions and their respective actions:
| Grading Company | Action | New Grade | Date |
|---|---|---|---|
| Wells Fargo | Maintain | Overweight | 2026-01-26 |
| Bernstein | Maintain | Outperform | 2026-01-16 |
| Barclays | Maintain | Equal Weight | 2026-01-13 |
| Citigroup | Maintain | Buy | 2025-12-22 |
| Goldman Sachs | Maintain | Buy | 2025-12-19 |
| Wolfe Research | Downgrade | Peer Perform | 2025-12-15 |
| Morgan Stanley | Maintain | Overweight | 2025-12-10 |
| Keybanc | Upgrade | Overweight | 2025-11-12 |
| RBC Capital | Maintain | Outperform | 2025-10-23 |
| TD Cowen | Maintain | Hold | 2025-10-23 |
The consensus remains cautious with a “Hold” rating, reflecting a balance between Buy and Hold recommendations. Notably, Wolfe Research issued a recent downgrade, signaling some emerging concerns amid generally stable outlooks.
Consumer Opinions
AT&T Inc. evokes mixed reactions from its consumer base, reflecting both its broad service reach and areas needing improvement.
| Positive Reviews | Negative Reviews |
|---|---|
| Reliable network coverage in urban areas | Customer service response times are slow |
| Competitive pricing on bundled plans | Frequent billing errors reported |
| Wide range of plan options | Inconsistent internet speeds in rural regions |
| Strong 5G rollout and infrastructure | Occasional network outages during peak hours |
Overall, consumers appreciate AT&T’s expansive coverage and competitive pricing. However, recurring complaints about customer service and service consistency pose risks to brand loyalty. I see these as critical areas for management focus.
Risk Analysis
Below is a summary table outlining AT&T’s key risk factors, their likelihood, and potential impact on investment value:
| Category | Description | Probability | Impact |
|---|---|---|---|
| Financial Stability | Altman Z-Score at 1.02 signals high bankruptcy risk (Distress Zone). | High | Severe |
| Liquidity | Current ratio at 0.91 indicates tight short-term liquidity. | Medium | Moderate |
| Leverage | Debt-to-equity ratio of 1.25 reflects elevated financial leverage. | High | High |
| Operational Efficiency | Low asset turnover (0.3) suggests inefficient asset use. | Medium | Moderate |
| Market Volatility | Beta of 0.61 implies less sensitivity to market swings. | Low | Low |
AT&T’s most pressing risk is its financial distress signal from the Altman Z-Score, suggesting vulnerability to economic downturns. Combined with high leverage and subpar liquidity, these factors heighten default risk despite a strong profitability profile. Investors should weigh these risks carefully against the company’s solid dividend yield and favorable valuation metrics.
Should You Buy AT&T Inc.?
AT&T Inc. appears to have improving profitability with growing ROIC, yet the company is shedding value relative to WACC, indicating a slightly favorable moat. Despite a substantial leverage profile and liquidity concerns, its overall rating of A- suggests a cautiously favorable investment case.
Strength & Efficiency Pillars
AT&T Inc. posts solid operational margins with a gross margin of 79.77% and an EBIT margin of 26.91%. The net margin stands at a favorable 17.42%, reflecting efficient cost management. Return on equity at 17.58% confirms shareholder value generation. However, the company’s ROIC at 5.57% slightly trails its WACC of 4.97%, indicating marginal value creation. The growing ROIC trend suggests improving profitability, but AT&T has yet to establish a sustainable competitive moat.
Weaknesses and Drawbacks
AT&T is currently in financial distress, with an Altman Z-Score of 1.02, signaling a high bankruptcy risk. This solvency concern overshadows its profitability metrics. The company’s debt-to-equity ratio is elevated at 1.25, heightening leverage risk. Liquidity is tight, with a current ratio of 0.91 below the safe threshold of 1.0. Asset turnover metrics are weak, limiting efficiency. While valuation metrics are reasonable (P/E 8.14, P/B 1.43), these issues expose AT&T to market and credit vulnerabilities.
Our Final Verdict about AT&T Inc.
Despite operational strengths, AT&T’s solvency risk, highlighted by the distress-zone Altman Z-Score, makes the investment profile highly speculative. The company’s financial distress status overrides favorable margins and growth trends. Investors should approach with caution, recognizing that the risk of bankruptcy may outweigh potential returns. This profile may appear too risky for conservative capital and requires close monitoring before considering exposure.
Disclaimer: This content is for informational purposes only and does not constitute financial, investment, or other professional advice. Investing in financial markets involves a significant risk of loss, and past performance is not indicative of future results.
Additional Resources
- Mount Sinai nurses approve new contract ending strike at its NYC hospitals – WTOP (Feb 11, 2026)
- James Van Der Beek, ‘Dawson’s Creek’ Actor, Dies at 48 After Cancer Battle – The New York Times (Feb 11, 2026)
- ‘Dawson’s Creek’ star James Van Der Beek dies at 48, following years-long battle with colorectal cancer – Yahoo (Feb 11, 2026)
- James Van Der Beek, ‘Dawson’s Creek’ and ‘Varsity Blues’ star, dies at 48 – NBC News (Feb 11, 2026)
- At least 8 killed and dozens injured in Canada shootings – latest updates – CNN (Feb 11, 2026)
For more information about AT&T Inc., please visit the official website: att.com